

Abstract
Objective
Common chronic diseases such as hypertension are costly and difficult to manage. Our ultimate goal is to use data from electronic health records to predict the risk and timing of deterioration in hypertension control. Towards this goal, this work predicts the transition points at which hypertension is brought into, as well as pushed out of, control.
Method
In a cohort of 1294 patients with hypertension enrolled in a chronic disease management program at the Vanderbilt University Medical Center, patients are modeled as an array of features derived from the clinical domain over time, which are distilled into a core set using an information gain criteria regarding their predictive performance. A model for transition point prediction was then computed using a random forest classifier.
Results
The most predictive features for transitions in hypertension control status included hypertension assessment patterns, comorbid diagnoses, procedures and medication history. The final random forest model achieved a c-statistic of 0.836 (95% CI 0.830 to 0.842) and an accuracy of 0.773 (95% CI 0.766 to 0.780).
Conclusions
This study achieved accurate prediction of transition points of hypertension control status, an important first step in the long-term goal of developing personalized hypertension management plans.
Keywords: hypertension control, predictive modeling, visualization
Introduction
More than 65 million Americans and over a billion people worldwide have hypertension,1 2 which is one of the most important modifiable risk factors for cardiovascular disease.3 4 Consider, for each 20/10 mm Hg increment increase in blood pressure (BP), the risk of cardiovascular disease doubles.5 More rapid achievement of BP control is also critical for reducing morbidity and mortality.2 5 Much work has been done to compare specific drugs and to find the most effective treatment for hypertension patients.6–12 As nearly all patients with hypertension require medication to achieve and maintain controlled BP,13–15 we believe that modifications to medication regimens is a promise vector by which such achievement can be accomplished.
However, achieving BP control remains difficult for a number of reasons. The selection of optimal medication regimens varies significantly among patients due to demographic and medical characteristics (eg, salt intake, exercise, obesity),5 16 17 and even when these characteristics are accounted for, BP can be influenced by multiple metabolic pathways.17–19 With respect to the latter, there are more than nine different classes of antihypertensive drugs and more than 100 medications available. Currently, it is not possible to predict which drug class, exact drug, dose, frequency and drug combinations will be required to achieve BP control for each individual patient.16 20–23 As a result, drug regimens often evolve over time through a trial-and-error process.24–27
Predicting changes in hypertension control status is a complicated but important task.28 A number of studies have attempted to consider simple clinical measures to predict the development of hypertension, although such studies often fail to incorporate other clinical factors that would influence risk.29–31 Many have attempted to use predictive analytics to find a combination of indicators that might predict the development of hypertension.32 33 We are unaware of any studies that predict change in BP control status among patients with diagnosed hypertension, nor are we aware of studies that predict optimal antihypertensive therapy to reduce the time required to achieve BP control. Therefore, as a first step towards addressing this issue, we aim to ascertain whether transitions between in-control and out-of-control hypertension can be predictable and, if so, what makes these groups of patients different.
While addressing this aim, this study makes three primary contributions:
We formulate the problem of transition prediction, with a specific focus on hypertension control. We represent the problem as the ascertainment of the likelihood that a patient will transition from his or her current hypertension control status. This includes both a positive transition from out-of-control to in-control and a negative transition from in-control to out-of-control, given available clinical data. We show how both types of transition can be utilized as target labels to build predictive models.
We introduce a predictive model for transitions, leveraging a data-driven approach based on all available clinical information. This information includes demographics, diagnoses, medications, and laboratory results. BP varies throughout the course of a 24-h day (it is highest in the evening and lowest in the morning) with additional intrinsic, random variation of between 5 and 15 mm Hg depending on patient characteristics, acute illness, medications, and methods of measurement.34 Recognizing these issues, we supplement traditional data from electronic health records (EHR) with physician judgment of hypertension control status. Given this knowledge, we devise a feature selection strategy to identify relevant ones from a diverse set of features before building predictive models.
We evaluate our approach with a unique dataset that consists of a de-identified cohort of patients in a chronic disease management program. We study a patient cohort from the Vanderbilt MyHealthTeam (MHT) chronic disease care coordination pilot program, in place from 2010 to 2012 (see Background section for further details). The main findings illustrate that the predictive model is relatively effective (a c-statistic of 0.836, 95% CI 0.830 to 0.842, and accuracy of 0.773, 95% CI 0.766 to 0.780) and that certain features (eg, frequency of certain diagnoses and previous status of hypertension control) are correlated with changes in hypertension status. Overall, the predictive model performs best when multiple concepts of features are included, in particular, hypertension assessment patterns and diagnosis information.
Background
EHR, phenotype heterogeneity, and hypertension control
Integrating and refining the information contained in EHR into specific phenotypes (and subtypes) within formal analytic frameworks are critical to the advancement of methods leveraging EHR for scientific investigation. Thus, when we turn our attention to hypertension, it is important to recognize that there is variability in the definition and manifestation of the disease. Hypertension itself is defined as chronically elevated BP. In the clinic setting, hypertension has been defined as a systolic BP chronically ≥140 mm Hg or diastolic BP chronically ≥90 mm Hg; lower thresholds of 130/80 mm Hg have been set for patients with renal disease and diabetes.5 Thresholds for BP measured in the patient's home are less well defined, but ≥135/85 mm Hg has been suggested for use.35
However, there are additional factors that can contribute to elevated BP and, thus, the diagnosis of hypertension and determination of whether BP control has been achieved is left to the discretion of a patient's care provider. General recommendations have been made regarding initial treatment options for antihypertensive therapies, but detailed protocols for personalized medical therapy have not been firmly defined, leading to significant practice variation.20
Vanderbilt MHT Program
The MHT program was established as a care coordination system designed to empower a collaborative workforce to improve the health and care for patients with hypertension, heart failure, or diabetes. MHT also provides the patient with tools to engage actively in the management of their care, including a web portal and clinical communication intervals based on disease severity. Starting in 2010, within an academic internal medicine group practice in which all of the physicians participated in the MHT program, patients with hypertension along or in combination with diabetes or heart failure were approached personally or by phone for inclusion in the program. Expansion and enrollment into the program continued after initial development.
Care coordinators met with patients (often via face-to-face after clinical appointments), and each patient with hypertension was counseled individually regarding their high BP, barriers to achieving or maintaining control were identified, and plans were made to address these. Each patient was also given a BP monitor to take home and use after the machine was calibrated and patients demonstrated accurate self-measurement of BP. Self-measurement BP in the dataset provides more frequent BP measurements and may provide a more reliable indicator of control status for certain patients.36 Patients were encouraged to measure their BP at home and report these values by phone, web-based portal, fax, or mail. The MHT care coordination system, which was based on the local EHR, was designed to prompt care coordinators to contact patients at prespecified intervals based on individual patient risk levels. Based on the evidence provided, physicians determined whether a patient's hypertension was under control or not after each clinical encounter and documented this control status in the EHR.
Methods
This section begins with an overview of the predictive modeling pipeline and its components. It then introduces the details for each component.
Overview
Predictive modeling pipelines based on EHR have enabled intelligent care delivery37 and the detection of patient-specific risk factors.38 For this work, the predictive modeling pipeline consists of three modules, as shown in figure 1:
A feature engineering module, which turns clinical data into a feature matrix and a target label vector that is used as training data for building the predictive model.
A prediction module, which takes the training data as input and constructs the candidate predictive models.
An analysis module, which examines the results through evaluation and visualization to characterize the predictive model and compares various candidate models.
Figure 1.
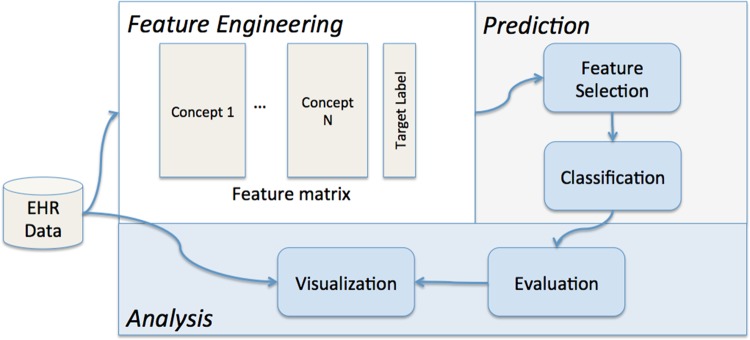
An illustration of the predictive modeling pipeline.
Feature engineering module
First, we present how to construct the target label (ie, whether a transition in hypertension status is positive or negative). Second, we define how to generate features.
We derive target labels based on clinician assessments of BP control status: in-control versus out-of-control, which we refer to as positive versus negative. For illustration, figure 2 depicts positive and negative assessments of a patient as blue and red circles, respectively. We then iteratively merge all of the consecutive instances of in-control (out-of-control) assessment points into positive (negative) episodes, as illustrated by the blue (red) bands in figure 2. A transition point is then defined as the instance between two consecutive episodes. For example, there are three transition points indicated in figure 2. We use the positive and negative transition points as target labels (ie, dependent variables, or outcome variables) for a prediction model. Given a target label of a patient, we work back from the corresponding transition point for specific time windows to construct features to characterize the patient. We required a transition point to have two consecutive events of the same kind, that is, patient either stayed in control or out of control for two clinical assessments.
Figure 2.
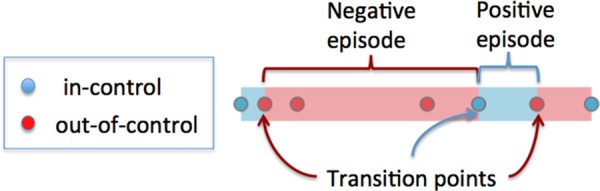
Physician assessments of hypertension control status for a single patient over time. Blue circles are in-control assessments, red circles are out-of-control assessments. The background color bands indicate the type of episodes, where blue means positive episode and red negative episode. The transition points indicate different adjacent assessments. In this example, there are three transitions.
Next, we describe how to construct features for a given patient. The raw clinical data are modeled as feature event sequences of the form 〈patient identifier, date, feature identifier, feature value〉. Each feature identifier maps to a particular feature with its name and concept. For example, the International Classification of Diseases, revision 9 (ICD-9) code 401* (hypertension) is a feature within the diagnosis concept. The feature event sequences used in this study are depicted in table 1. Aside from the patient's demographics, all features are longitudinal, allowing each patient to have multiple encounters with the same feature over time. To convert feature event sequences into feature variables, we specify an observation window for each feature concept and then aggregate all the events of the same feature within the observation window into a single value. For example, the average of all systolic BP measurements of a patient within a 1-year observation window could be applied as the aggregation of the systolic BP feature. The observation window is specified before the transition point corresponding to the target label. We then constructed features using the clinical data before the transition point, which were subsequently applied to predict whether the change was positive or negative. The aggregation functions adopted in this study are summarized in table 1.
Table 1.
A summary of which aggregation functions are applied to the features in patient event sequences over a prespecified time window
| Concepts | Features | Aggregation | Example value |
|---|---|---|---|
| Vital | Weight | Average | 210 lb |
| Height | 6 ft | ||
| BMI | 28.5 kg/m2 | ||
| BP | Systolic, | Average | 135 mm Hg |
| Diastolic | 80 m Hg | ||
| CPT | CPT codes | Sum | 5 times for a specific CPT |
| ICD9 | ICD-9 codes | Sum | 5 times for a specific ICD-9 |
| LABS | Lab measures | Average | 1.31 mg/dL for creatinine |
| MED | Drug name | Sum | 5 prescriptions for hydrochlorothiazide |
| Demographics | Age | Numeric | 65 years |
| Gender | Binary | 1 for male, 0 for female | |
| Race | Binary | 1 for white, 0 for others | |
| Assessment | Chronic diseases (hypertension, DM, HF) | Binary | 1 for in control, 0 for out of control |
BMI, body mass index; BP, blood pressure; CPT, current procedural terminology; DM, diabetes mellitus; ICD-9, International Classification of Diseases, revision 9; HF, heart failure.
In addition to these standard clinical features, we derived features based on hypertension control patterns as follows. Let Cp be the number of transition points for patient p. Let Ip, Op, and Mp be indicator variables (ie, 0 or 1), which correspond to p being mostly in control, mostly out of control, or mixed, respectively. These are mutually exclusive labels, such that Ip+Op+Mp=1. Total controlled (out-of-control) duration corresponds to the sum of the number of days in all positive (negative) episodes. For example, in figure 2 the total controlled duration is computed by summing up the length of two positive episodes (indicated by shaded blue). The total out-of-control duration can be computed as the length of two negative episodes (indicated by shaded red). The mostly in-control indicator Ip indicates whether total controlled duration is 1.5 times or more the total out-of-control duration for a patient p. Similarly, Op indicates whether total out-of-control duration is 1.5 times or more the total controlled duration for a patient p. Patients who failed to meet the Ip and Op were labeled as Mp, which means no predominating BP control pattern. We define the trend Tp as the slope of a fitted line against the positive and negative assessment points. Hypertension in-control and out-of-control assessments map to 1 and −1, respectively. To handle special cases, Tp=1 and=−1 when all assessments are in control and out of control, respectively.
Prediction module
The prediction module iteratively partitions the set of patients into training and testing cohorts to support a 10-fold cross-validation process. At this point, a two-level feature selection process is applied. Within the same concept, predictive features are selected according to an information gain criterion.39 Across concepts, we use a greedy forward selection to ascertain which concepts to retain. More specifically, we measure the prediction performance (c-statistic and accuracy) on those selected features from each concept. Next, we start with the best performing features from a single concept and iteratively combine these with the selected features from the next best concept until the combination fails to improve the prediction performance. Finally, transition point models are learned using various classification techniques, including logistic regression, naive Bayes,9 and random forests.40 Note that the only features with missing values are laboratory results, which we impute with the mean before the classification.
Analysis module
The performance metric we use is the c-statistic and accuracy for predicting transitions. The c-statistic is the area under the receiver operating characteristic curve; accuracy is the percentage correct among all predictions. In addition, to understand better the performance of the model, we developed a visualization system to facilitate the exploration of the prediction results and other events. Figure 3 depicts a snapshot of the visualization. Here, each line represents a patient over time and each circle represents a hypertension control assessment. As mentioned earlier, blue and red indicate out-of-control and in-control BP episodes, respectively. This tool enables a drill down on specific patients for further review.
Figure 3.

An illustration of the visualization tool developed to model temporal assessment patterns with the MyHealthTeam patient cohort.
Results
Data description
All data used in this study were collected from Vanderbilt University Medical Center's de-identified EHR repository, the synthetic derivative, which is a completely de-identified, randomly date-shifted version of the EHR. All dates are changed by a random offset per patient.41 At the time of this study, the MHT cohort consisted of 1294 patients enrolled between 2010 and 2012 who had at least one transition point while in the program. The data analyzed included MHT program-specific measures, such as control status and home BP, and were supplemented by the complete de-identified longitudinal clinical information. Each patient received an average of five hypertension physician assessments across 158 days while in the MHT program. As MHT is a relatively new and ongoing project, the amount of program-specific data on each patient varied significantly depending on the time of enrollment. Based on the definition of a transition point, there are 1564 transitions among the 1294 patients; there are 201 patients with multiple transition points. The evaluation is performed through cross-validation by stratifying on patients to ensure training and testing sets were mutually exclusive with respect to patients. Table 2 illustrates the overall patient characteristics in the data, segmenting patients into the mostly in-control and mostly out-of-control phenotypes as described earlier. As shown in table 2, the characteristics of the two groups are similar across demographics, disease condition, laboratory and vital signs, which makes the prediction task difficult. Therefore, we use a data mining approach to inspect many potential features in the predictive model. Aside from care coordinator disease assessments, which are relatively limited, patients exhibit multi-year records on all features.
Table 2.
A summary of the characteristics of the de-identified patient records utilized in this study
| Variable | Mostly out of control (n=615 transitions) | Mostly in control (n=949 transitions) |
|---|---|---|
| Demographics | ||
| Age, years | 70.37±11.77 | 68.76±12.38 |
| Gender | 280 (46%) female | 450 (47%) female |
| Race | 466 (76%) white | 696 (73%) white |
| Diseases conditions | ||
| Diabetes | 162 (26%) | 207 (22%) |
| Coronary disease | 108 (18%) | 117 (12%) |
| Heart failure | 61 (9.9%) | 72 (7.6%) |
| COPD | 13 (2.1%) | 23 (2.4%) |
| Cardiovascular | 109 (18%) | 117 (12%) |
| Cancer | 29 (4.7%) | 52 (5.5%) |
| Lab measure frequency | ||
| Creatinine | 377 (61%) | 487 (51%) |
| Potassium | 372 (60%) | 480 (51%) |
| eGFR | 20 (3.3%) | 15 (1.6%) |
| troponin | 37 (6.0%) | 50 (5.3%) |
| Brain naturetic peptide | 51 (8.3%) | 73 (7.7%) |
| Vital signs | ||
| Systolic BP, mm Hg (mean, SD) | 131.19±16.52 | 129.39±15.87 |
| Diastolic BP, mm Hg (mean, SD) | 70.05±11.33 | 68.98±10.80 |
| BMI (kg/m2) (mean, SD) | 31.93±7.26 | 30.72±6.50 |
BP, blood pressure; BMI, body mass index; COPD, chronic obstructive pulmonary disease eGFR, estimated glomerular filtration rate.
Observation window size
Different observation window sizes lead to different amounts of clinical data in the model. Figure 4 illustrates the c-statistic as a function of the window size for different types of features. In general, a longer observational window size for all feature concepts results in a higher c-statistic. This may seem counterintuitive because one might expect a medication to have a shorter effect than diagnoses. However, many of the features are sparse, such that larger observation windows allow for more robust documentation on a patient's status.
Figure 4.

Visualization of blood pressure values and clinician determination of blood pressure control status. The rectangles highlight the potential discrepancies between blood pressure values and clinician determination.
Predictive performance of feature concepts
We begin by reporting on the predictive performance of each feature concept. This will be followed by a more nuanced analysis of which specific values in these features are the most predictive.
Table 3 summarizes the c-statistics and accuracy for the random forests models, with feature concepts alone and in combination. In the experiment, we set the number of trees in the random forests to 100 based on a tradeoff analysis between the prediction performance and time cost. Of the models with a single feature concept, the most predictive features are diagnosis and hypertension control patterns. Note that the latter provides significant predictive power with only two components: the number of transition points and indicators for BP control status (mostly in-control/mostly out-of-control/mixed). Evaluating combinations of feature concepts, the largest c-statistic results from hypertension control pattern with diagnosis. Inclusion of additional feature concepts reduced prediction accuracy. We also tested other classification techniques, including logistic regression and naive Bayes, but their c-statistic scores are much lower than those obtained by random forests: the highest c-statistic scores of logistic regression and naive Bayes are 0.686 (95% CI 0.646 to 0.726) and 0.743 (95% CI 0.704 to 0.782), respectively.
Table 3.
Performance of various feature concepts in predicting a transition in hypertension control by random forests
| Model | c-statistic | (95% CI) | Accuracy | (95% CI) |
|---|---|---|---|---|
| Models with a single feature concept | ||||
| Hypertension control patterns | 0.730 | (0.721 to 0.739) | 0.697 | (0.689 to 0.705) |
| Diagnosis (observation window=730 days) | 0.719 | (0.710 to 0.728) | 0.705 | (0.697 to 0.713) |
| Procedure (observation window=270 days) | 0.716 | (0.707 to 0.725) | 0.706 | (0.698 to 0.714) |
| Medication (observation window=545 days) | 0.711 | (0.702 to 0.720) | 0.701 | (0.693 to 0.709) |
| Lab (observation window=545 days) | 0.707 | (0.698 to 0.716) | 0.699 | (0.691 to 0.707) |
| Demographics | 0.699 | (0.691 to 0.707) | 0.702 | (0.694 to 0.710) |
| Vitals (observation window=730 days) | 0.595 | (0.588 to 0.602) | 0.559 | (0.552 to 0.566) |
| Assessment of other chronic diseases (observation window=730 days) | 0.524 | (0.518 to 0.530) | 0.455 | (0.450 to 0.460) |
| Models with multiple feature concepts | ||||
| Hypertension control patterns+diagnosis | 0.836 | (0.830 to 0.842) | 0.773 | (0.766 to 0.780) |
| Hypertension control patterns+diagnosis+procedure | 0.820 | (0.814 to 0.826) | 0.765 | (0.757 to 0.773) |
| Hypertension control patterns+diagnosis+procedure+meds | 0.809 | (0.802 to 0.816) | 0.766 | (0.758 to 0.774) |
| Hypertension control patterns+diagnosis+procedure+meds+Lab | 0.797 | (0.790 to 0.804) | 0.758 | (0.750 to 0.766) |
| Hypertension control patterns+diagnosis+procedure+meds+lab+demographics | 0.798 | (0.791 to 0.805) | 0.763 | (0.756 to 0.770) |
Next, we present the predictive features from three different feature concepts: BP control assessment patterns, diagnosis features and procedure features. Table 4 summarizes the feature prevalence in the observation window before a transition point for mostly out-of-control and mostly in-control groups. For BP control assessment patterns, we confirm all five features are predictive, with p values of 10−3 or less. Of diagnosis features, the ones with smallest p values are hypertension, disorders of lipid metabolism and type 2 diabetes. In general, procedure features tend to reflect the utilization level of the healthcare system. The mostly out-of-control group has relatively higher utilization of the system compared to the BP in-control group, as shown in percentages of current procedural terminology codes in table 4.
Table 4.
Significance of the top predictive features for hypertension assessment patterns, ICD-9 codes, and CPT codes
| Predictive features | Mostly out of control (n=615 transitions) | Mostly in control (n=949 transitions) | p Value* |
|---|---|---|---|
| Hypertension assessment patterns | |||
| Cp (transition points) | 2.79±1.80 | 2.34±1.73 | 7.69×10⁻⁷ |
| Op (mostly out of control) | 291 (47.3%) | 350 (36.9%) | 4.98×10⁻⁵ |
| Ip (mostly in control) | 189 (30.7%) | 441 (46.5%) | 5.97×10⁻¹⁰ |
| Up (mixed group) | 135 (22.0%) | 158 (16.6%) | 9.65×10⁻³ |
| Tp (trend) | −0.02±0.16 | 0.01±0.13 | 1.76×10⁻⁵ |
| Diagnosis features | |||
| Hypertension | 419 (68.1%) | 555 (58.5%) | 0.00012 |
| Disorders of lipid metabolism | 291 (47.3%) | 379 (39.9%) | 0.00405 |
| Diabetes mellitus, type 2 | 163 (26.5%) | 205 (21.6%) | 0.02802 |
| CPT codes | |||
| 36415 (‘collection of venous blood by venipuncture’) | 323 (52.5%) | 426 (44.9%) | 0.00370 |
| 99213 (‘office or other outpatient visit,’ level 3) | 332 (54.0%) | 465 (49.0%) | 0.05557 |
| 99214 (‘office or other outpatient visit,’ level 4) | 336 (54.6%) | 445 (46.9%) | 0.00316 |
*We use the proportional test for percentage values, and t test for real values.
CPT, current procedural terminology; ICD-9, International Classification of Diseases, revision 9.
Discussion and conclusions
In this paper, we developed a model to predict transition points of BP control for patients with hypertension in a chronic disease management program. Our model leveraged various features available in the EHR and supplied by patients (eg, home BP measurements). The model predicts transition points of BP control at the next clinical encounter with a c-statistic of 0.836 (95% CI 0.830 to 0.842) and accuracy of 0.773 (95% CI 0.766 to 0.780). As a first step towards future work in developing methods to predict optimal, personalized antihypertensive medication regimens, our work indicates that we can successfully detect changes in hypertension control status among patients who are mostly in control or mostly out of control with regard to their hypertension control status. Ideally, we would develop and evaluate a model that predicts when the occurrence of transition points will happen. However, without continuous monitoring of hypertension control status, this is not currently possible. Instead, we study the predictive models to prove there is a detectible difference in the types of transitions, to serve as a foundation for future studies. In addition, we report a set of predictive features that include hypertension control patterns, comorbidity diagnoses, and healthcare utilization. The most predictive features are previous BP control assessments and comorbid conditions.
Challenges in defining hypertension control as a phenotype
Figure 5 highlights apparent disparities between clinician assessment of hypertension control and absolute thresholds for hypertension control based on vital sign measurements. It was observed that patients with uncontrolled BP have relatively shorter time windows of observation, and the thresholds for BP control for the tick marks did not account for the comorbid conditions of diabetes or renal failure, while clinician determination of BP control did account for these factors. These factors may contribute to the apparent lack of agreement between BP control assessment and BP values, and may explain why vital signs did not contribute significantly to the final models, although future refinement of the visualization tool may provide additional insight. Earlier work has explored the prevalence of clinician non-adherence to established guidelines, as well as diagnostic and therapeutic inertia.42–44 However, a discrepancy between absolute values of BP in clinic and clinician determination of BP control may be warranted; one study found that 25% of patients referred for ambulatory BP monitoring, the gold standard of BP measurement, had adequate BP control and 30% of patients were uncontrolled due to medication non-adherence.25 In these cases, the apparent discrepancy between BP values and clinician determination of BP control was appropriate.
Figure 5.
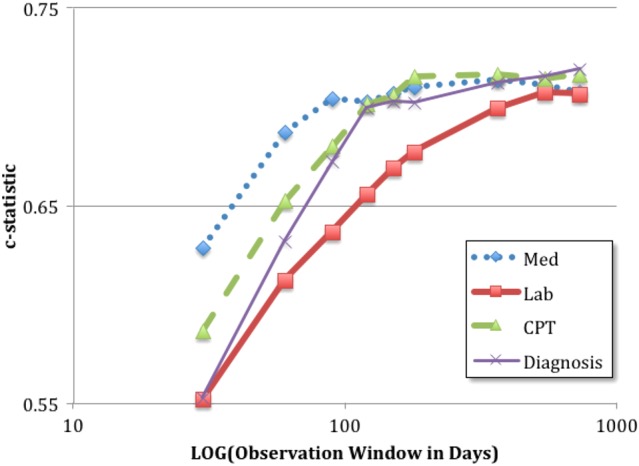
The c-statistic for individual feature concepts when varying the observation window. The larger observation windows tend to have better c-statistics. The performance trends of most feature concepts plateau after approximately 1 year.
One of the core challenges of reusing EHR for phenotype-specific investigations is that they are designed to support clinical care and not necessarily basic research. As a consequence, a phenomenon such as ‘hypertension,’ which can be documented by a very specific billing code (or small set of related codes), fails to characterize the nuance of the phenotype. This is problematic because hypertension is an amalgamation of multiple disease subtypes.45–47 Generally, subtypes are not always documented in a standard form and, even when they are, it is not clear that they cover the set of possible subtypes. In recognition of this challenge, research has increasingly been dedicated towards the development of algorithms to derive phenotypes from EHR,48 with an emphasis on using multimodal strategies49 (eg, billing codes in combination with laboratory reports and concepts derived from clinical narratives). These strategies have enabled novel research on a wide range of phenotypes, including asthma,50 cataracts,51 diabetes,52 red blood cell traits,53 and rheumatoid arthritis,54 55 and potentially broader application of these research methods. Our work shows that use of EHR data can be used to identify changes in hypertension control status, which is a first step in developing optimized medication regimens and developing methods for use in other chronic diseases.
Towards an improved prediction model
We wish to highlight observations that may serve as guideposts for future research. This patient cohort is relatively small (1294 patients with 1564 transition points), with variable longitudinal data as the MHT program was developed and implemented. Small sample size may limit the power to detect predictive features with a weaker signal, although on a positive note the relatively small group of physicians in the MHT program reduces variability in BP measurement, treatment, and follow-up. A long-term challenge is to utilize EHR data, which is intrinsically noisy, and difficult to interpret out of context. Because of these challenges, we recognize that not all features constructed in our models are ideal clinical concepts. For example, the medication features correspond to specific drug names and do not account for variations of the same drug with different names (eg, generic vs brand names). Furthermore, those feature values are the numbers of orders within a time window, which do not yet take into account dosage, number of refills and whether the patients actually filled those orders. Our features should be considered as the first order approximation of those ideal clinical concepts.
In summary, this study indicates that it is possible to predict accurately the types of transitions in hypertension control using EHR data collected for clinical purposes. This study also serves as a first step in developing personalized hypertension medication recommendations.
Acknowledgments
The authors would like to thank Shahram Ebadollahi of IBM Research and Bill Stead of Vanderbilt University for their leadership in establishing and guiding this project. The authors would also like to thank Ravi Atreya, Melissa Basford, Bill Gregg, and Sunny Wang of Vanderbilt University and Harry Stavropoulos from IBM Research for all their assistance and helpful discussions during the progression of this study.
Footnotes
Contributors: JS, CDM, JK, TL and BAM drafted the paper together. PZ and AG-D conducted the experiments. AP developed the visualization. JCD provided important guidance on the phenotyping discussion. JK and AS prepared the dataset.
Funding: This project was supported, in part, by a grant from the National Center for Advancing Translational Sciences (UL1TR000445) and the National Heart, Lung, and Blood Institute (K12HL109019) and IBM TJ Watson Research Center. The opinions expressed do not represent those of the National Institutes of Health.
Competing interests: None.
Ethics approval: This research was conducted under a non-human subject research determination of the Vanderbilt University Medical Center institutional review board.
Provenance and peer review: Not commissioned; externally peer reviewed.
Data sharing statement: We will make this data and model parameters available subject to IRB review board.
References
- 1.Valderrama AL, Gillespie C, King SC, et al. Vital signs: awareness and treatment of uncontrolled hypertension among adults – United States, 2003–2010. MMWR Morb Mortal Wkly Rep 2012;61:703–9 [PubMed] [Google Scholar]
- 2.WHO/Cardiovascular diseases (CVDs) WHO; http://www.who.int/mediacentre/factsheets/fs317/en/ (accessed 11 Apr 2013) [Google Scholar]
- 3.Rosendorff C, Black HR, Cannon CP, et al. Treatment of hypertension in the prevention and management of ischemic heart disease: a scientific statement from the American Heart Association Council for High Blood Pressure Research and the Councils on Clinical Cardiology and Epidemiology and Prevention. Circulation 2007;115:2761–88 [DOI] [PubMed] [Google Scholar]
- 4.Kannel WB. Some lessons in cardiovascular epidemiology from Framingham. Am J Cardiol 1976;37:269–82 [DOI] [PubMed] [Google Scholar]
- 5.Chobanian AV, Bakris GL, Black HR, et al. Seventh report of the Joint National Committee on Prevention, Detection, Evaluation, and Treatment of High Blood Pressure. Hypertension 2003;42:1206–52 [DOI] [PubMed] [Google Scholar]
- 6.Perry HM, Bingham S, Horney A, et al. Antihypertensive efficacy of treatment regimens used in Veterans Administration hypertension clinics. Hypertension 1998;31:771–9 [DOI] [PubMed] [Google Scholar]
- 7.Dhalla IA, Gomes T, Yao Z, et al. Chlorthalidone versus hydrochlorothiazide for the treatment of hypertension in older adults: a population-based cohort study. Ann Intern Med 2013;158:447–55 [DOI] [PubMed] [Google Scholar]
- 8.Major outcomes in high-risk hypertensive patients randomized to angiotensin-converting enzyme inhibitor or calcium channel blocker vs diuretic: the Antihypertensive and Lipid-Lowering Treatment to Prevent Heart Attack Trial (ALLHAT). JAMA 2002;288:2981–97 [DOI] [PubMed] [Google Scholar]
- 9.The ALLHAT Collaborative Research Group. Major cardiovascular events in hypertensive patients randomized to doxazosin vs chlorthalidone: the antihypertensive and lipid-lowering treatment to prevent heart attack trial (ALLHAT) JAMA 2000;283:1967–75 [PubMed] [Google Scholar]
- 10.Wright JT, Jr, Dunn JK, Cutler JA, et al. Outcomes in hypertensive black and nonblack patients treated with chlorthalidone, amlodipine, and lisinopril. JAMA 2005;293:1595–608 [DOI] [PubMed] [Google Scholar]
- 11.Hansson L, Hedner T, Lund-Johansen P, et al. Randomised trial of effects of calcium antagonists compared with diuretics and beta-blockers on cardiovascular morbidity and mortality in hypertension: the Nordic Diltiazem (NORDIL) study. Lancet 2000;356:359–65 [DOI] [PubMed] [Google Scholar]
- 12.Pepine CJ, Handberg EM, Cooper-DeHoff RM, et al. A calcium antagonist vs a non-calcium antagonist hypertension treatment strategy for patients with coronary artery disease. The International Verapamil-Trandolapril Study (INVEST): a randomized controlled trial. JAMA 2003;290:2805–16 [DOI] [PubMed] [Google Scholar]
- 13.Armario P, Waeber B. Therapeutic strategies to improve control of hypertension. J Hypertens 2013;31(Suppl. 1):S9–12 [DOI] [PubMed] [Google Scholar]
- 14.Mancia G, De Backer G, Dominiczak A, et al. 2007 Guidelines for the Management of Arterial Hypertension: the Task Force for the Management of Arterial Hypertension of the European Society of Hypertension (ESH) and of the European Society of Cardiology (ESC). J Hypertens 2007;25:1105–87 [DOI] [PubMed] [Google Scholar]
- 15.Izzo JL, Jr, Gradman AH. Mechanisms and management of hypertensive heart disease: from left ventricular hypertrophy to heart failure. Med Clin North Am 2004;88:1257–71 [DOI] [PubMed] [Google Scholar]
- 16.Thoenes M, Neuberger H-R, Volpe M, et al. Antihypertensive drug therapy and blood pressure control in men and women: an international perspective. J Hum Hypertens 2010;24:336–44 [DOI] [PubMed] [Google Scholar]
- 17.Maitland-van der Zee A-H, Turner ST, Schwartz GL, et al. Demographic, environmental, and genetic predictors of metabolic side effects of hydrochlorothiazide treatment in hypertensive subjects. Am J Hypertens 2005;18:1077–83 [DOI] [PubMed] [Google Scholar]
- 18.Kojima S, Kawano Y, Yoshitomi Y, et al. Comparison of first-line antihypertensive drugs by a randomized cross-over method – a preliminary report. Hypertens Res 1995;18:303–5 [DOI] [PubMed] [Google Scholar]
- 19.Oparil S, Zaman MA, Calhoun DA. Pathogenesis of hypertension. Ann Intern Med 2003;139:761–76 [DOI] [PubMed] [Google Scholar]
- 20.Ma J, Stafford RS. Screening, treatment, and control of hypertension in US private physician offices, 2003–2004. Hypertension 2008;51:1275–81 [DOI] [PMC free article] [PubMed] [Google Scholar]
- 21.Dickerson JE, Hingorani AD, Ashby MJ, et al. Optimisation of antihypertensive treatment by crossover rotation of four major classes. Lancet 1999;353:2008–13 [DOI] [PubMed] [Google Scholar]
- 22.Deary AJ, Schumann AL, Murfet H, et al. Double-blind, placebo-controlled crossover comparison of five classes of antihypertensive drugs. J Hypertens 2002;20:771–7 [DOI] [PubMed] [Google Scholar]
- 23.Brown MJ. Personalised medicine for hypertension. BMJ 2011;343:d4697. [DOI] [PubMed] [Google Scholar]
- 24.Oliveras A, Schmieder RE. Clinical situations associated with difficult-to-control hypertension. J Hypertens 2013;31(Suppl. 1):S3–8 [DOI] [PubMed] [Google Scholar]
- 25.Hyman DJ, Pavlik VN, Greisinger AJ, et al. Effect of a physician uncertainty reduction intervention on blood pressure in uncontrolled hypertensives – a cluster randomized trial. J Gen Intern Med 2012;27:413–19 [DOI] [PMC free article] [PubMed] [Google Scholar]
- 26.Neaton JD, Grimm RH, Jr, Prineas RJ, et al. Treatment of Mild Hypertension Study. Final results. Treatment of Mild Hypertension Study Research Group. JAMA 1993;270:713–24 [PubMed] [Google Scholar]
- 27.Bidiville J, Nussberger J, Waeber G, et al. Individual responses to converting enzyme inhibitors and calcium antagonists. Hypertension 1988;11:166–73 [DOI] [PubMed] [Google Scholar]
- 28.Lackland DT. Hypertension risk prediction: an important but complicated assessment. Hypertension 2010;55:1304–5 [DOI] [PubMed] [Google Scholar]
- 29.Parikh NI, Pencina MJ, Wang TJ, et al. A risk score for predicting near-term incidence of hypertension: the Framingham Heart Study. Ann Intern Med 2008;148:102–10 [DOI] [PubMed] [Google Scholar]
- 30.Whelton PK, He J, Appel LJ, et al. Primary prevention of hypertension: clinical and public health advisory from the National High Blood Pressure Education Program. JAMA 2002;288:1882–8 [DOI] [PubMed] [Google Scholar]
- 31.Muntner P, Woodward M, Mann D, et al. Comparison of the Framingham Heart Study hypertension model with blood pressure alone in the prediction of risk of hypertension: the Multi-Ethnic Study of Atherosclerosis (MESA). Hypertension 2010;55:1339–45 [DOI] [PMC free article] [PubMed] [Google Scholar]
- 32.Bozorgmanesh M, Hadaegh F, Mehrabi Y, et al. A point-score system superior to blood pressure measures alone for predicting incident hypertension: Tehran Lipid and Glucose Study. J Hypertens 2011;29:1486–93 [DOI] [PubMed] [Google Scholar]
- 33.Lukas A, Kumbein F, Temml C, et al. Body mass index is the main risk factor for arterial hypertension in young subjects without major comorbidity. Eur J Clin Invest 2003;33:223–30 [DOI] [PubMed] [Google Scholar]
- 34.Tholl U, Forstner K, Anlauf M. Measuring blood pressure: pitfalls and recommendations. Nephrol Dial Transplant 2004;19:766–70 [DOI] [PubMed] [Google Scholar]
- 35.Head GA, Mihailidou AS, Duggan KA, et al. Definition of ambulatory blood pressure targets for diagnosis and treatment of hypertension in relation to clinic blood pressure: prospective cohort study. BMJ 2010;340:c1104. [DOI] [PMC free article] [PubMed] [Google Scholar]
- 36.Cushman WC, Duprez DA, Weintraub HS, et al. Home and clinic blood pressure responses in elderly individuals with systolic hypertension. J Am Soc Hypertens 2012;6:210–18 [DOI] [PubMed] [Google Scholar]
- 37.Gotz D, Stavropoulos H, Sun J, et al. ICDA: a platform for intelligent care delivery analytics. AMIA Annu Symp Proc 2012;2012:264–73 [PMC free article] [PubMed] [Google Scholar]
- 38.Sun J, Hu J, Luo D, et al. Combining knowledge and data driven insights for identifying risk factors using electronic health records. AMIA Annu Symp Proc 2012;2012:901–10 [PMC free article] [PubMed] [Google Scholar]
- 39.Mitchell TM. Machine Learning. 1st edn. McGraw-Hill Science/Engineering/Math, 1997 [Google Scholar]
- 40.Breiman L. Random forests. Mach Learn 2001;45:5–32 [Google Scholar]
- 41.Roden DM, Pulley JM, Basford MA, et al. Development of a large-scale de-identified DNA biobank to enable personalized medicine. Clin Pharmacol Ther 2008;84:362–9 [DOI] [PMC free article] [PubMed] [Google Scholar]
- 42.Gil-Guillén V, Orozco-Beltrán D, Carratalá-Munuera C, et al. Clinical inertia in poorly controlled elderly hypertensive patients: a cross-sectional study in Spanish physicians to ascertain reasons for not intensifying treatment. Am J Cardiovasc Drugs 2013;13:213–19 [DOI] [PubMed] [Google Scholar]
- 43.Huebschmann AG, Mizrahi T, Soenksen A, et al. Reducing clinical inertia in hypertension treatment: a pragmatic randomized controlled trial. J Clin Hypertens (Greenwich) 2012;14:322–9 [DOI] [PMC free article] [PubMed] [Google Scholar]
- 44.Okonofua EC, Simpson KN, Jesri A, et al. Therapeutic inertia is an impediment to achieving the Healthy People 2010 blood pressure control goals. Hypertension 2006;47:345–51 [DOI] [PubMed] [Google Scholar]
- 45.Ward BW, Schiller JS. Prevalence of multiple chronic conditions among US adults: estimates from the National Health Interview Survey, 2010. Prev Chronic Dis 2013;10:E65. [DOI] [PMC free article] [PubMed] [Google Scholar]
- 46.Cirillo M, Terradura-Vagnarelli O, Mancini M, et al. Cohort Profile: The Gubbio Population Study. Int J Epidemiol. Published Online First: 29 March 2013. 10.1093/ije/dyt025 [DOI] [PMC free article] [PubMed] [Google Scholar]
- 47.Farasat SM, Morrell CH, Scuteri A, et al. Do hypertensive individuals have enlarged aortic root diameters? Insights from studying the various subtypes of hypertension. Am J Hypertens 2008;21:558–63 [DOI] [PMC free article] [PubMed] [Google Scholar]
- 48.Newton KM, Peissig PL, Kho AN, et al. Validation of electronic medical record-based phenotyping algorithms: results and lessons learned from the eMERGE network. J Am Med Inform Assoc 2013;20:e147–54 [DOI] [PMC free article] [PubMed] [Google Scholar]
- 49.Peissig PL, Rasmussen LV, Berg RL, et al. Importance of multi-modal approaches to effectively identify cataract cases from electronic health records. J Am Med Inform Assoc 2012;19:225–34 [DOI] [PMC free article] [PubMed] [Google Scholar]
- 50.Pacheco JA, Avila PC, Thompson JA, et al. A highly specific algorithm for identifying asthma cases and controls for genome-wide association studies. AMIA Annu Symp Proc 2009;2009:497–501 [PMC free article] [PubMed] [Google Scholar]
- 51.Waudby CJ, Berg RL, Linneman JG, et al. Cataract research using electronic health records. BMC Ophthalmol 2011;11:32. [DOI] [PMC free article] [PubMed] [Google Scholar]
- 52.Kho AN, Hayes MG, Rasmussen-Torvik L, et al. Use of diverse electronic medical record systems to identify genetic risk for type 2 diabetes within a genome-wide association study. J Am Med Inform Assoc 2012;19:212–18 [DOI] [PMC free article] [PubMed] [Google Scholar]
- 53.Kullo IJ, Ding K, Jouni H, et al. A genome-wide association study of red blood cell traits using the electronic medical record. PLoS ONE 2010;5:e13011. 10.1371/journal.pone.0013011 [DOI] [PMC free article] [PubMed] [Google Scholar]
- 54.Carroll RJ, Thompson WK, Eyler AE, et al. Portability of an algorithm to identify rheumatoid arthritis in electronic health records. J Am Med Inform Assoc 2012;19:e162–9 [DOI] [PMC free article] [PubMed] [Google Scholar]
- 55.Liao KP, Cai T, Gainer V, et al. Electronic medical records for discovery research in rheumatoid arthritis. Arthritis Care Res (Hoboken) 2010;62:1120–7 [DOI] [PMC free article] [PubMed] [Google Scholar]