

Abstract
The corpus callosum is a midline cerebral structure and has a unique embryological development pattern. In this article, we describe the pathophysiology and present imaging findings of various typical/atypical conditions affecting the corpus callosum. Since many of these pathologies have characteristic appearances on magnetic resonance imaging (MRI) and their therapeutic approaches are poles apart, ranging from medical to surgical, the neuroradiologist should be well aware of them.
Keywords: Corpus callosum, magnetic resonance imaging, pictorial essay
Introduction
The corpus callosum is the largest commissure consisting of tightly packed white matter tracts connecting the two cerebral hemispheres. It comprises of four parts (from anterior to posterior): (i) rostrum, (ii) genu, (iii) body, and (iv) splenium.
Various pathologies that can affect the corpus callosum and their characteristic appearances on magnetic resonance imaging (MRI) are illustrated in this pictorial essay. Pathologies of the corpus callosum result in typical symptoms of interhemispheric discoordination.
The etiological spectrum ranges from congenital, demyelinating, inflammatory, trauma to neoplasm and ischemia. Callosal abnormalities developing after ventricular decompression fall under miscellaneous conditions, which have characteristic imaging findings.
Congenital
Callosal malformations
After the formation of the massa commisuralis around the 10th week of gestation, the first callosal fibers begin to form. The formation is primarily anterior to posterior, beginning with the genu at 12th week. The rostrum is an exception, as it develops last at 18-20 weeks.[1]
Malformations range from agenesis or hypogenesis to hypoplasia. Agenesis can be complete or partial [Figures 1 and 2]. In partial agenesis, only the splenium and/or rostrum are absent. Imaging features include high-riding third ventricle, parallel and non-converging lateral ventricles, colpocephaly, and inverted Probst bundles indenting the superomedial surface of lateral ventricles.
Figure 1 (A-D).
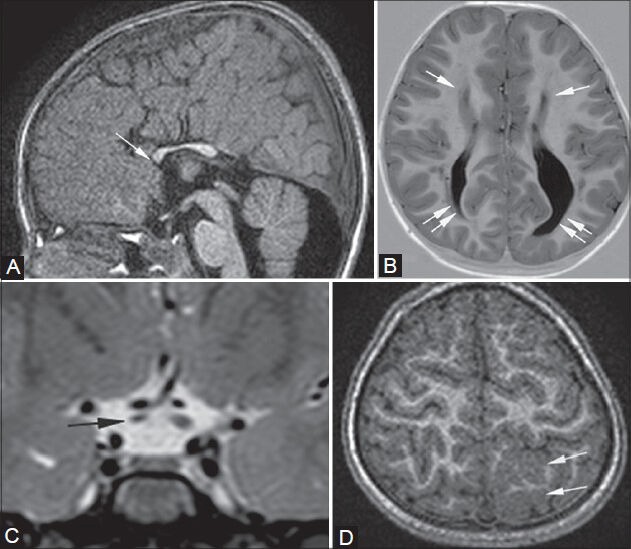
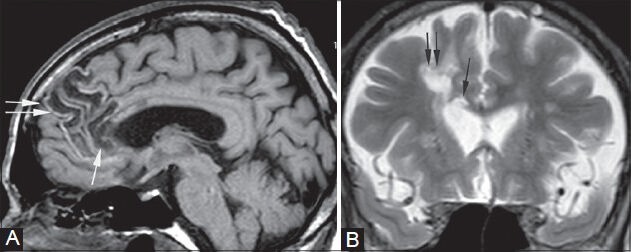
Partial callosal agenesis with cortical dysplasia and right optic nerve atrophy. An 8-year-old male presented with seizures. MRI shows partial agenesis of the corpus callosum on sagittal T1- weighted image (arrow in A), widely spaced atrophic and parallel frontal horns of lateral ventricles (single arrows in B), and colpocephaly (double arrows in B) on axial (B) T1-weighted inversion recovery sequence. Pre-chiasmatic optic nerve atrophy is noted on the right on thin coronal T2-weighted image (arrow in C), along with cortical dysplasia in left high parietal lobe on axial 3D T1-weighted image (arrows in D)
Figure 2 (A-C).
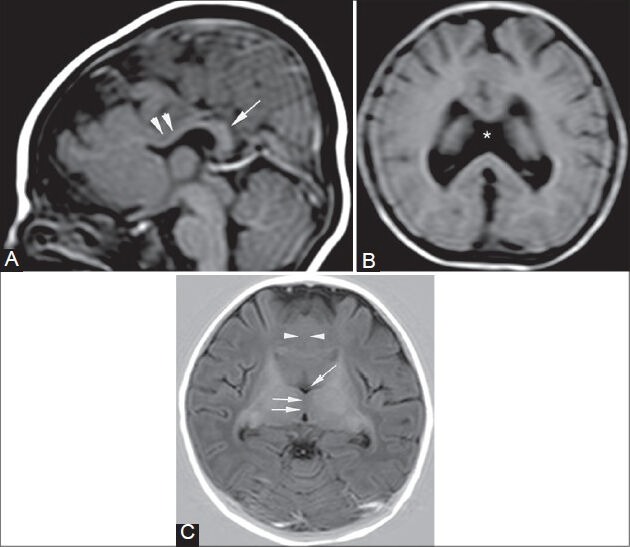
Callosal agenesis with semilobar holoprosencephaly. A 4-month-old infant presented with delayed milestones and poor muscle tone. T1-weighted sagittal image (A) shows agenesis of the corpus callosum (arrowheads in A) and a dorsal interhemispheric commissure or “pseudo-splenium” (single arrow in A). Axial T2-FLAIR image (B) shows the absence of septum pellucidum (asterisk). Axial T1-weighted inversion recovery image (C) shows fusion of brain tissue across the midline (arrowheads in C), partially separated thalami (double arrows in C), and a rudimentary third ventricle (single arrow in C)
Callosal dysgenesis is associated with other cerebral malformations such as Chiari II, migration disorders (heterotopias, lissencephaly, schizencephaly) [Figure 1], Dandy Walker malformation, holoprosencephalies [Figure 2], etc.[2]
In semi-lobar holoprosencephaly, the normal sequence of formation of the corpus callosum does not take place.[1] Apart from callosal agenesis, on sagittal images, a dorsal interhemispheric commissure or “pseudo-splenium,” which mimics the splenium, is seen in its place[3] [Figure 2].
Lipoma
As a result of abnormal persistence and differentiation of the meninx primitiva (normal resorption between 8th and 10th weeks of gestation) into lipomatous tissue, a pericallosal lipoma is formed. It generally presents with seizures.[4]
Based on the appearance of lipomas, there are two types: tubulonodular or curvilinear. Tubulonodular lipomas are located anteriorly. They measure more than 2 cm in diameter and have a high association with encephaloceles, frontal lobe anomalies, and callosal malformations. Curvilinear posterior lipomas are thinner, ribbon-like, and measure less than 1 cm in width. They usually arch around the splenium.[5]
On MRI, lesions are uniformly hyperintense on T1- and T2-weighted images [Figure 3], with signal suppression on fat-saturated images.
Figure 3 (A, B).
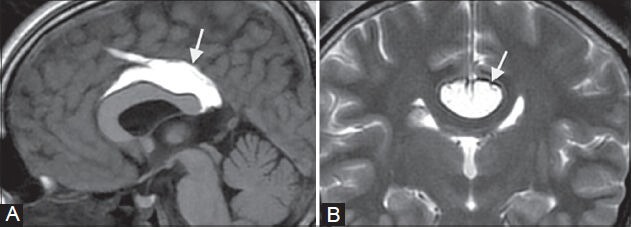
Pericallosal lipoma. A 16-year-old female underwent an MRI for headache. MRI shows an incidental well-defined curvilinear pericallosal lesion (arrows in A, B), which is hyperintense on T1- weighted image (A) and T2-weighted image (B), suggestive of a classic “ribbon-like” corpus callosal lipoma
Disorders of myelination
Hereditary
Krabbe's disease
Deficiency of lysosomal enzyme galactocerebroside betagalactosidase[6] results in white matter dysmyelination associated with large macrophages. This autosomal recessive disorder is known as Krabbe's disease or globoid cell leukodystrophy (GLD). There is an abnormal accumulation of galactocerebroside (component of mature myelin) in the macrophages, leading to the formation of large multinucleated “globoid cells.”[7]
In the early-onset type, patients develop symptoms around the age of 2 years, starting with spasticity, irritability, fever, and developmental delay. Eventually decerebrate rigidity and flaccid paralysis sets in, resulting in death.[8] This early-onset form of GLD usually involves the cerebellar white matter, thalami, dentate nuclei, and lentiform nuclei, as well as the corticospinal tracts. Callosal and white matter atrophy is usually a late manifestation.
The common imaging features in the late-onset type of GLD, in patients more than 2 years of age, are involvement of the pyramidal tracts, corpus callosum, and parieto-occipital white matter, which appear hyperintense on long TR/TE images[9] [Figure 4]. The subcortical U fibers are generally spared.[10]
Figure 4 (A, B).
Krabbe's disease. A 4-year-old girl presented with abnormal gait and dragging of foot. MRI shows increased signal intensity along the pathway of the pyramidal tract in the centrum semiovale, corona radiata, posterior limb of internal capsule (arrows in A), crus cerebri (double arrows in B), and pons bilaterally on FLAIR (A) and T2-weighted images (B). Similar signals are seen in the peritrigonal white matter bilaterally (arrowheads in A) and splenium of corpus callosum (double arrows in A)
X-linked adrenoleukodystrophy
The leukodystrophies are a group of disorders characterized by enzyme deficiencies resulting in abnormal formation, destruction, or turnover of myelin.[11] X-linked adrenoleukodystrophy is an autosomal recessive disorder caused due to acyl-CoA synthetase deficiency, which leads to accumulation of very long chain fatty acids in tissues and plasma.[12]
Patients present during their childhood with seizures, visual–behavioral disturbances, and mental retardation. Symptoms and signs of adrenal insufficiency along with undescended testis may also exist.[13]
Of five imaging patterns described by Loes et al.,[14] pattern 1 is the most common one (66% of cases) [Figure 5]. It manifests as deep white matter involvement of the parieto-occipital lobes, peritrigonal regions, and splenium of the corpus callosum. Involvement of visual and auditory pathways can also occur. These areas appear hyperintense on fluid-attenuated inversion recovery (FLAIR)/T2W images, hypointense on T1W images, and show variable post-contrast enhancement.
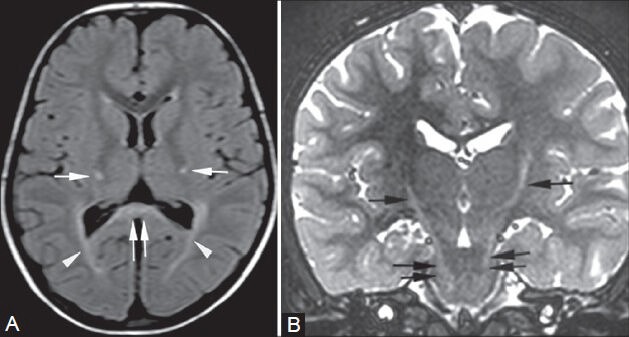
Figure 5 (A, B).
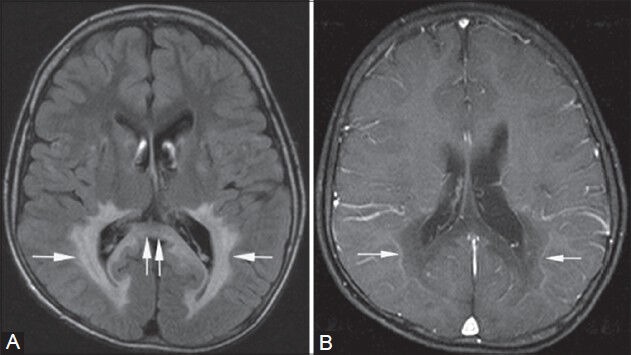
X-linked adrenoleukodystrophy. An 8-year-old male child with Addison's disease presented with mental retardation. Symmetrical high signal intensity lesions are seen on the FLAIR image in the peritrigonal white matter (single arrows in A) and in the splenium of corpus callosum (double arrows in A), giving characteristic “butterfly” appearance. On post-contrast T1-weighted images (B), smooth enhancement of the leading edges is seen bilaterally (arrows in B)
Inflammatory
Multiple sclerosis (MS): MS is an immune mediated, inflammatory demyelinating disorder. The relapsing-remitting form is the commonest clinical presentation, having varied imaging findings on MRI.
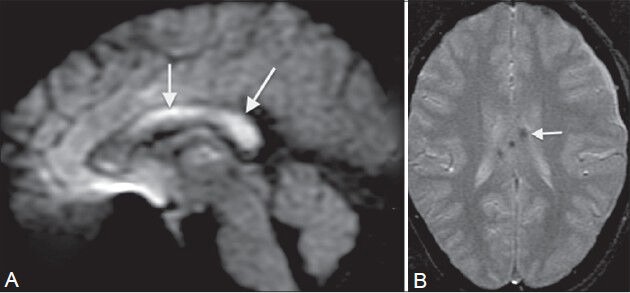
On MRI, the MS plaques are hypointense on T1W images and hyperintense on T2W/FLAIR images. They are thin, ovoid, flame shaped (called “Dawson's fingers”), and oriented perpendicularly to the lateral ventricles [Figure 6B]. This morphology results from inflammatory changes in the white matter surrounding the medullary veins, thus creating dilated perivenular spaces.[15] The specificity for diagnosis increases rapidly with the involvement of the calloso-septal interface,[16] which is seen in upto 93% of patients[17] [Figure 6A]. The corpus callosum is especially prone to demyelination in MS due to its intimate contact with lateral ventricular roofs and with small penetrating vessels.[18] As the disease progresses, the corpus callosum undergoes atrophy and becomes thinned out.[19] Amongst the newer techniques, diffusion tensor tractography can demonstrate degree of axonal loss in the regions of white matter lesions, including the corpus callosum, extremely well.[20]
Figure 6 (A-C).
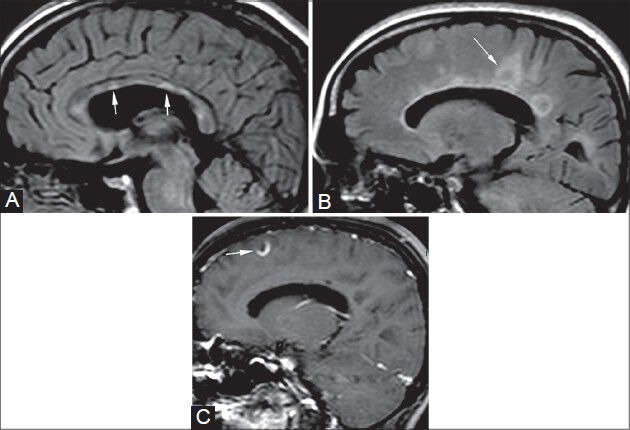
Multiple sclerosis. A 49-year-old female came with muscle weakness and spasms. On sagittal FLAIR images (A, B), multiple focal hyperintense lesions are seen at the calloso-septal interface (arrows in A). Multiple well-defined “ring-like” hyperintense lesions are also seen along the periventricular white matter (Dawson's fingers) (arrow in B) with their long axis perpendicular to the corpus callosum. These appearances are consistent with demyelinating plaques of multiple sclerosis. On post-contrast image (C), these lesions show incomplete ring enhancement
“Lesion within a lesion” or the so-called “beveled” appearance is also typical. “Solid” or “open ring” form[21] of gadolinium-enhancement patterns is seen in the acute inflammatory phase, due to disruption of the blood-brain barrier [Figure 6C].
Tumefactive demyelination: The lesions appear “tumor-like” and are greater than 2 cm in size,[22] and are often confused with gliomas and lead to unnecessary biopsies. Features highly suggestive of tumefactive demyelination are:
-
(1)
Large lesion with little mass effect and edema[23] [Figure 7]
-
(2)
Ring-like or open-ring enhancement[24] [Figure 7] signifying active plaque margins
-
(3)
Central dilated veins within the lesion[25]
-
(4)
Decreased perfusion within the lesions[25]
-
(5)
Rapid resolution after steroid therapy.[26]
Figure 7 (A-D).
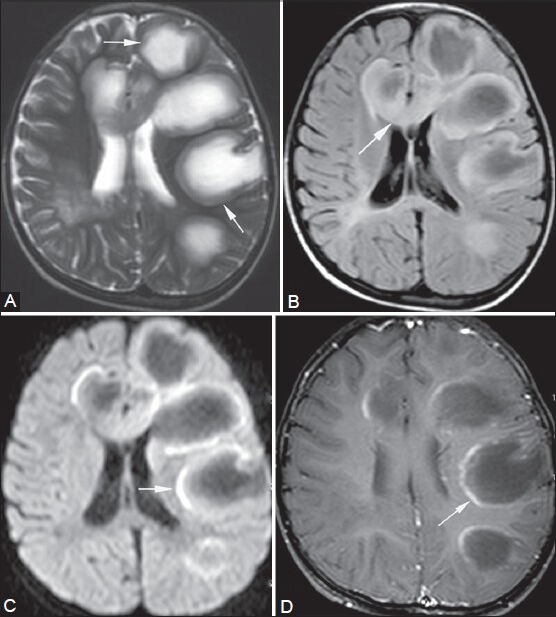
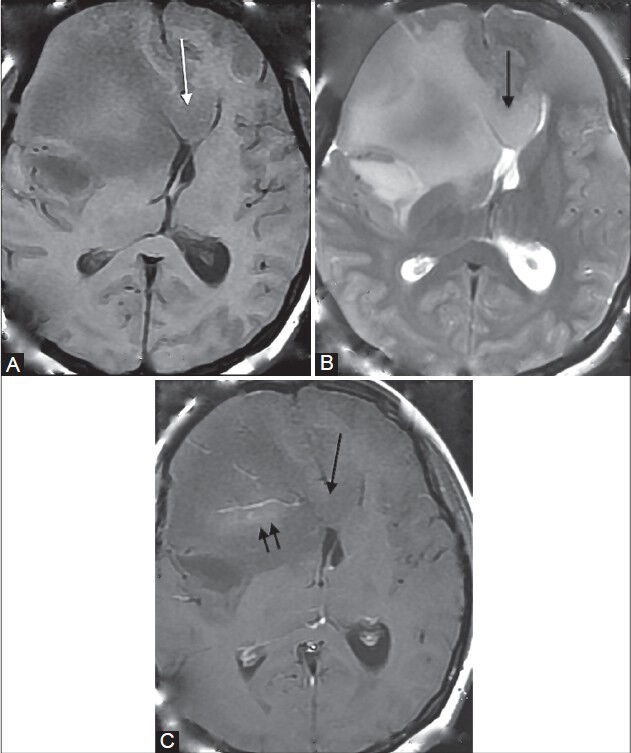
Tumefactive demyelination. A 5-year-old male came with history of recurrent episodes of muscle weakness and seizures. Multiple round to oval lesions are seen in the left parietal and frontal lobes (arrows in A), genu (arrow in B), and body of corpus callosum. They are peripherally hypointense and centrally hyperintense on T2-weighted image (A) and show suppression on FLAIR (B) image. Their margins show partial ring enhancement on post-contrast T1-weighted image (arrow in D) and partial peripheral restricted diffusion on diffusion-weighted image (arrow in C), suggestive of active margins of demyelinating plaques
Corpus callosal involvement, either primary or secondary, though not uncommon, is not pathognomonic for tumefactive demyelination. In such cases, it may mimic gliomas or lymphomas and needs to be kept in mind as a differential, to avoid unnecessary biopsies.[22]
Marchiafava–Bignami disease
This condition affects chronic alcoholics and severely malnourished people with vitamin B12 deficiency.[27] It causes demyelination and necrosis of the corpus callosum, with a predilection for central fibers.[28]
In the acute phase, patients present with sudden onset of altered consciousness, seizures, ataxia, and pyramidal signs. On MRI, in the acute phase, the corpus callosum shows diffuse swelling and hyperintensity on T2W images [Figure 8]. In the chronic phase, the patients present with progressive dementia and interhemispheric disconnection. On MRI, diffuse callosal atrophy with multiple areas of focal necrosis are seen within the corpus callosum, with a predilection for the central portion[28] [Figure 9] and sparing of the upper and lower edges. In some cases, focal hypointense areas are seen on T2W images within the corpus callosum, probably due to hemosiderin or lipid-laden macrophages.[29] Signal changes may also be found in the subcortical and periventricular white matter.[30]
Figure 8 (A, B).
Acute Marchiafava–Bignami disease. A 36-year-old chronic alcoholic male came with acute onset of altered consciousness and seizures. On MRI, diffuse swelling of the entire corpus callosum (arrows in A, B) is seen along with increased signal on T2-weighted (A) and FLAIR (B) images
Figure 9 (A, B).
Chronic Marchiafava–Bignami disease. A 51-year-old male, chronic alcoholic, presented with ataxia and dementia. MRI shows atrophy of the corpus callosum along with areas of focal necrosis in the genu and body which appear hypointense on T1 FLAIR image (arrows in A) and hyperintense on T2-weighted image (arrows in B)
Trauma
Diffuse axonal injury
This is a significant cause of morbidity in patients with traumatic head injury[31] due to sudden acceleration-deceleration or rotational forces, which cause axonal shear-strain deformations in the brain.
As per the grading system for DAI (according to the location of small hemorrhagic foci) by Adams in 1989,[32] grade I involves gray-white matter interface, grade II involves the corpus callosum (posterior body and splenium, because of their dural fixity), and grade III involves the dorsolateral part of upper brainstem.
On MRI, small hemorrhages are seen as hypointense foci on T2*-weighted gradient-recalled echo (GRE) or susceptibility-weighted sequences[33] [Figure 10]. Non-hemorrhagic lesions show restricted diffusion on diffusion-weighted imaging (DWI) and hyperintensity on long TR/TE images.
Figure 10 (A, B).
Diffuse axonal injury (DAI). A 30-year-old male presented with head injury and loss of consciousness. MRI shows multiple foci of altered signal intensity in the body and splenium of the corpus callosum, showing restricted diffusion (arrows in A) on diffusion-weighted image (A) and blooming (arrow in B) on GRE image (B), signifying hemorrhagic DAI
Ischemia
Infarct
The corpus callosum, despite having a rich vascular supply, shows various patterns of infarcts. It is supplied by three main arteries: The pericallosal artery, the anterior communicating artery, and the posterior pericallosal artery. The body is mainly supplied by the pericallosal branch of the anterior cerebral artery. The anterior portion of the corpus callosum is supplied by the subcallosal and medial callosal branches of the anterior communicating artery. The splenium is supplied by the posterior pericallosal branch of the posterior cerebral artery.[34]
Infarcts of the corpus callosum are generally a part of large vessel ischemia.[35] Hence, diabetes mellitus and hypertension are the major risk factors as they predispose to atherosclerosis. Focal infarct patterns [Figure 11] are uncommon as the blood supply is by small perforating vessels running perpendicular to the parent vessel, making it difficult for the emboli to enter and lodge[35] within them. The splenium is the most vulnerable, followed by the body and genu.[35]
Figure 11 (A, B).
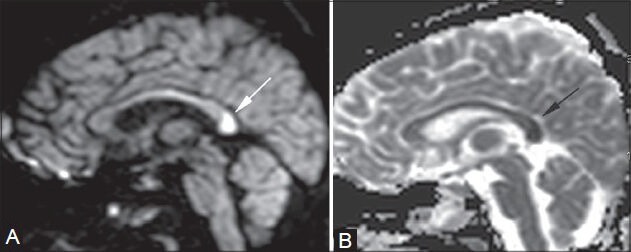
Acute splenial infarct. A 25-year-old female came in an unconscious state, with a history of hanging. A focal area of restricted diffusion is noted in the splenium of the corpus callosum (arrows in A, B) on diffusion-weighted (A) and apparent diffusion coefficient (B) images. It was interpreted as an acute infarct
Ischemia due to hypoxia, especially in the neonatal period, produces a typical diffuse callosal infarct pattern [Figure 12]. Such children have an unfavorable outcome.[36] On MRI, restricted diffusion on DWI is the earliest sign [Figure 11], followed by edema appearing hyperintense on T2W images and hypointense on T1W images. In chronic stages, the changes of gliosis or atrophy are seen [Figure 13].
Figure 12 (A-D).
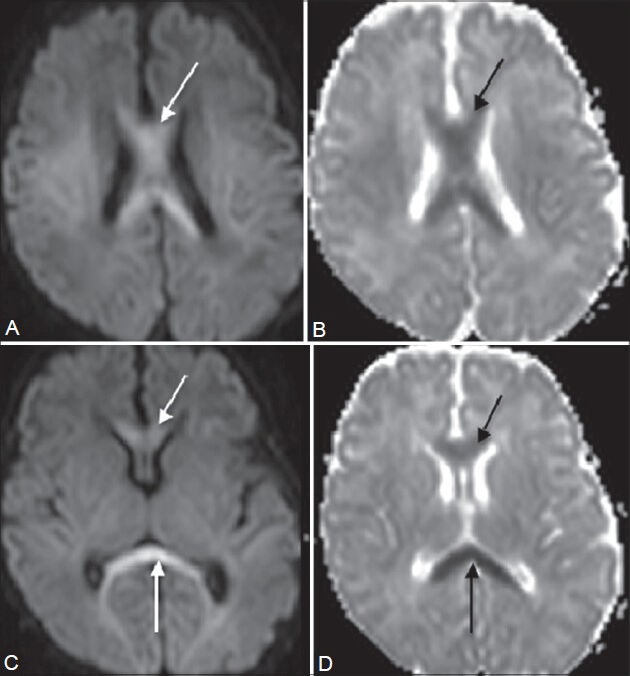
Diffuse hypoxia. A 13-day-old baby with asphyxia and respiratory distress at birth presented with decreased tone in all four limbs. On imaging, restricted diffusion is seen in the entire corpus callosum (arrows in A-D) on diffusion-weighted (A, C) and apparent diffusion coefficient images (B, D). This atypical infarct pattern was attributed to diffuse hypoxia
Figure 13 (A, B).
Callosal gliosis. A 61-year-old male, old case of right anterior cerebral artery (ACA) territory infarct, came for follow-up MRI. Sagittal T1-weighted (A) and coronal T2-weighted (B) images show areas of cystic encephalomalacia in the right frontal lobe (double arrows) and genu of the corpus callosum (single arrow)
Tumors
Mixed oligodendroglioma
Oligodendroglioma is the third most common glioma, with its incidence being 2-5% of all primary brain tumors and 5-18% of all glial tumors.[37] It commonly presents with seizure and headache in adults in the 35-45 years age group.[38]
On MRI, signal intensity of the tumors is characteristically heterogeneous, with a subcortical location. They produce overlying cortical thickening, with calvarial erosion in some cases. They have the highest frequency of calcification (50-90%) in a linear or nodular pattern.[39] Mild, ill-defined contrast enhancement is usually seen.[40] Occasionally, they arise in the frontal lobe and can cross to the contralateral hemisphere via the corpus callosum.
Histologically, “mixed” tumors also exist with astrocytes as their co-component. These oligoastrocytomas show a slightly higher incidence of contrast enhancement[41] ; however, they are indistinguishable from pure oligodendrogliomas on MRI alone[42] [Figure 14]. Pure oligodendrogliomas show longer time to progression and survival period as compared to oligoastrocytomas, on administration of procarbazine, lomustine and vincristine (PCV) chemotherapy.[43] However in practice, it is more important to differentiate between these oligodendroglial tumors and astrocytomas, as the latter show poor response to PCV chemotherapy.[44,45]
Figure 14 (A-C).
Mixed oligodendroglioma. A 32-year-old female came with seizures and headache. MR shows an ill-defined white matter lesion with subcortical extension in the right frontal lobe, causing mild overlying cortical thickening. It is seen to involve the genu of the corpus callosum (single arrow in A-C). It appears slightly heterogeneous, hypointense on T1WI (A), hyperintense on T2WI (B), and shows mild enhancement (double arrows) on post-contrast T1WI (C)
Glioblastoma multiforme (GBM)
GBM (WHO grade IV astrocytoma) is the most common primary intra-axial malignancy, accounting for 12-15% of all intracranial neoplasms.[46]
It generally originates in the cerebral white matter and spreads along the corpus callosum in a “butterfly” pattern [Figure 15A] to the opposite side, thus demonstrating its aggressive nature. Subependymal spread and CSF seeding are the other routes of tumor spread.[47] It may also originate in any part of the corpus callosum with an exophytic extension into the lateral ventricles, wherein it may be difficult to be differentiated from a primary intraventricular tumor. However, in such cases, one must look for the location of the tumor bulk, white matter edema, and enhancement,[47] as these findings favor GBM.
Figure 15 (A, B).
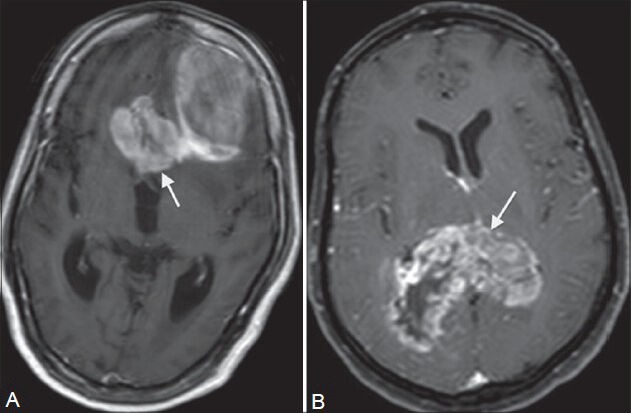
Neoplasm. Two patients (A and B) presented in their 70s with headache and giddiness. On contrast-enhanced MRI, welldefined white matter tumors are seen extending to the other hemisphere in a “butterfly pattern” in both patients. They show intense enhancement with areas of necrosis and hemorrhage within on post-contrast T1W images (A, B). Tumor A is seen in the left frontal lobe involving the genu (arrow in A), while tumor B is in the posterior parietal lobes involving the splenium (arrow in B) of corpus callosum. On histopathology, tumor A was GBM, while tumor B was B-cell non-Hodgkin's lymphoma
It shows marked perilesional edema and heterogeneity within due to areas of necrosis, hemorrhage, and hypercellularity. It also shows intense inhomogeneous post-contrast enhancement in its solid portion as a result of neoangiogenesis.[48]
Lymphoma
Primary cerebral lymphoma (PCL) represents 1-2% of all intracranial neoplasms and is particularly seen in patients with AIDS[49] and other immunodeficiency states. Almost all cases of PCL are of the non-Hodgkin's type.[50]
PCLs have a predilection for the meninges and ependyma and are typically found in the deep basal ganglia, periventricular regions, and corpus callosum[50,51] [Figure 15B].
Histologically, non-cleaved small-cell tumors are more commonly found in the corpus callosum.[50] Their imaging appearances, especially those of AIDS-related lymphomas, are similar to GBM; however, PCLs are more diffuse, generally multiple, less necrotic, have a lower incidence of intratumoral hemorrhage and a lesser degree of perilesional edema. Contrast enhancement pattern is more homogenous in immunocompetent patients, whereas in patients with AIDS, it shows ring enhancement pattern due to higher degree of central necrosis.[53] Pathologically, the infiltrative edges of the lesions extend along perivascular spaces and infiltrate blood vessel walls; hence, post-contrast enhancement along perivascular spaces is highly suggestive of lymphoma.[52] Rapid regression is seen after steroid administration; however, the prognosis is poor due to high recurrence rates, which are as high as 60% after radiotherapy.[53]
Infective
Reversible lesions in the splenium of corpus callosum
Reversible lesions in the splenium of the corpus callosum (SCC) [Figure 16], caused by various infective agents such as influenza, rotavirus, mumps, Escherichia coli, and adenovirus have been documented.[54] The changes become apparent on MRI from as early as 2nd day of onset of symptoms and CSF findings are usually normal or nonspecific. Patients with motor deficits show signal abnormalities in the deep cerebral white matter.
Figure 16 (A-D).
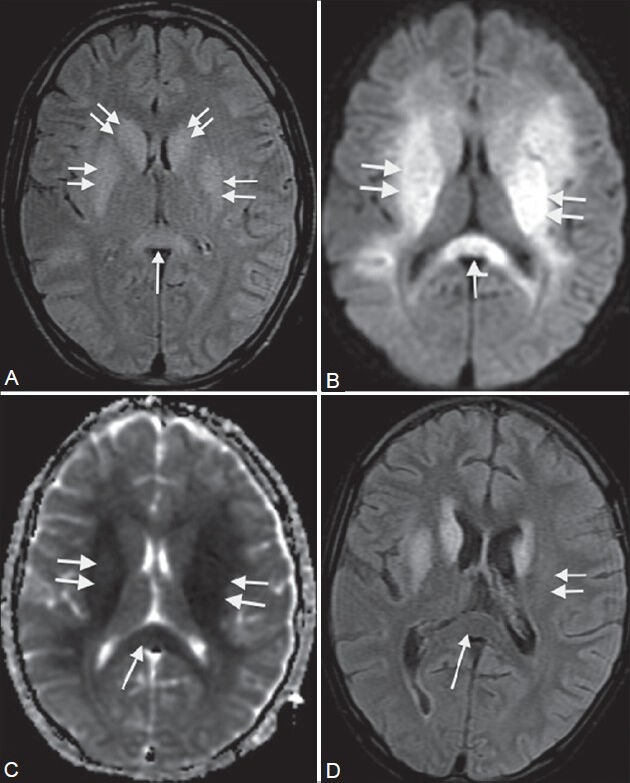
Viral encephalitis. A 13-year-old male came with headache, fever, and disorientation for 4 days. MRI shows bilateral symmetrical high signal intensity in the basal ganglia, internal capsule (double arrows in A-C), and splenium of corpus callosum (single arrows in A-C) on FLAIR image (A). These areas show restricted diffusion on diffusion-weighted image (B) and ADC maps (C). On follow-up scan 2 weeks later, FLAIR image (D) shows reversal of abnormal signal in the splenium (single arrow) and left putamen (double arrow)
There are other pathologies that can cause transient abnormal signals in the SCC. These include certain antiepileptic drugs (AED), epilepsy itself, posterior reversible encephalopathy syndrome,[55] mild encephalitis/encephalopathy with reversible isolated SCC lesion (MERS),[56] hypoglycemia, multiple sclerosis, hemolytic–uremic syndrome with encephalopathy, AIDS dementia complex, etc.[57]
Over the years, many hypotheses have been suggested to explain these transient lesions of the SCC. In 1999, Kim et al.[59] proposed reversible demyelination as the reason, probably due to antiepileptic drug toxicity. AED like primidone and carbamazepine were found to reduce plasma arginine vasopressin values by Krause et al.[58] in 1983. In 2005, Gurtler et al.[59] proposed that abrupt stoppage of chronic antiepileptic therapy could lead to ischemia and resultant cytotoxic edema, as a result of fluctuations in the arginine–vasopressin system.
In 2004, Tada et al.[56] studied patients with encephalitis and concomitant reversible lesions in SCC. They postulated that viral antigens or antibodies induced by them could have an increased affinity for the receptors on splenial axons, resulting in inflammatory infiltrates. Hacket et al.[60] studied cerebral edema occurring at high altitudes and observed similar changes in SCC. They advocated that vasogenic edema involving white matter was the reason for signal changes. This was also concluded by Conti et al.[61] in 2007 in their study on the transient focal lesion in SCC on MRI, with an attempt to explain underlying pathophysiology.
However, in 2003, Oster et al.[62] showed reduced apparent diffusion coefficient (ADC) values in these reversible splenial lesions on MRI. They suggested that repeated and excessive electrical discharges along the commissural fibers during seizures caused transient changes in energy metabolism and ionic transport, resulting in rapidly resolving intramyelinic edema.
Therefore, given its transient and reversible nature, this entity needs to be diagnosed accurately in order to avoid unnecessary invasive diagnostic and therapeutic measures.
Tuberculosis
India, with its tropical climate and high rate of HIV prevalence, has a large patient population afflicted with tuberculosis (TB). TB is shown to have many typical and atypical presentations.
Besides meningitis, the other form of presentation is granuloma formation. This is the most common form of parenchymal central nervous system (CNS) TB. CNS spread usually occurs via the hematogenous route from a primary focus in the lungs or gastrointestinal tract. The tuberculomas can also evolve from spread of infection through CSF via cortical veins and small penetrating arteries into the adjacent neuroparenchyma.[63] The corpus callosum, a rare site of tuberculoma formation [Figure 17], can be affected through both these routes. In such a case, it may mimic a glioma.[64] Advanced MR techniques are useful in such cases to accurately differentiate between them. On MR spectroscopy, tuberculomas show characteristic prominent lipid and lactate peaks with absent amino acid resonances. Lipid resonances are seen at 0.9, 1.3, 2.0, 2.8, and 3.7 ppm, due to the high lipid content of the central caseous material.[65] Gliomas typically show elevated choline-to-creatine ratio and reduced N-acetylaspartate-to-creatine ratio, indicating cellular proliferation and neuronal destruction.[66] High-grade gliomas show elevated lipid levels at 0.3 and 1.9 ppm, while low-grade gliomas show elevated myoinositol levels at 3.5 ppm.[66]
Figure 17.
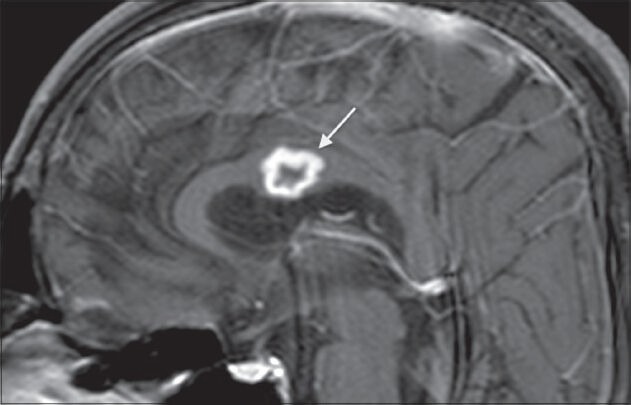
Tuberculosis. A 40-year-old male, K/C/O pulmonary tuberculosis + anti Koch's therapy (AKT) defaulter, came with fever, headache, and disorientation. Post-contrast T1-weighted image shows a ring-enhancing lesion in the body of the corpus callosum (arrow) suggestive of a tuberculoma
DWI provides us with ADC values, which are inversely proportional to cellular density[67] and cytotoxic edema. In a study by Gupta et al. conducted in 2005,[68] tuberculomas with T2-hyperintense cores were found to have ADC values ranging from 0.8 ± 0.08 × 10⁻³ mm2/sec to 0.74 ± 0.13 × 10⁻³ mm2/sec. In a study by Yang et al. conducted in 2002[69] on 17 cases of proven cerebral gliomas, they found that the mean ADC values ranged from 0.92 ± 0.27 × 10⁻³ mm2/sec to 1.28 ± 0.15 × 10⁻³ mm2/sec in the solid, non-necrotic, non-cystic components of the tumors. Hence, ADC values of necrotic tuberculomas are comparatively lesser than those of gliomas. Also, ADC values in the peritumoral region of an infiltrative glioma are lower than those of a tuberculoma, as this region contains nests of tumor cells.[70]
Magnetization transfer (MT) has recently improved lesion detection and characterization in TB. It is directly proportional to the protein or macromolecular content of the lesion.[71] Lipids form a large part of caseating tuberculomas and they show no MT.[72] Hence, the MT ratios of tuberculomas are significantly lower than those of gliomas.[73]
Perfusion imaging helps in assessing tumor-related angiogenesis. The leaky nature of these vessels is reflected in the high relative tumor blood volume (rTBV).[66] In comparison, tuberculomas have very low rTBV values due to the absence of angiogenesis.
Tuberculomas can occur anywhere in the brain, most commonly at the gray–white matter junction and basal ganglia, and depending on their signal characteristics and enhancement patterns, they can be classified as non-caseating and caseating tuberculomas. Caseating tuberculomas can be further classified as liquefied and non-liquefied.[74]
Intra-axial abscess formation is another mode of presentation of intracranial TB. On MRI, it appears as centrally necrotic space-occupying lesion with intense peripheral rim enhancement on post-contrast images. Surrounding perilesional edema is also seen.[75]
Aspergillosis
Immunocompromised patients are at an increased risk for fungal infection of the CNS. Amongst the fungal pathogens, Candida and Aspergillus are the main causative organisms of cerebral abscess in these patients.[76] The respiratory system is the primary site for infection via inhalation of spores. In the Aspergillus genus, Aspergillus fumigatus is the most common infecting agent. It can access the CNS via the hematogenous route from the lungs, or directly from the paranasal sinuses and nasal cavities. Rarely, direct inoculation may take place due to trauma or surgical procedures.[77]
Nonspecific symptoms of headache, lethargy, hemiparesis, and seizures in an immunocompromised patient should raise the suspicion of cerebral aspergillosis.[78]
A distinct feature of Aspergillus is its angioinvasive nature, which frequently causes early cerebral infarction, with or without hemorrhage.[77] From the parent artery, the fungi have a tendency to occlude the origins of the smaller perforating arteries.[79] Hence, the common sites of infection include the corpus callosum, basal ganglia, thalami, and brainstem, along with the gray–white matter junction.[79] Three common imaging patterns are recognized:
Ill-defined cortical-subcortical lesions appearing hyperintense on T2W images and hypointense on T1W images
Multiple ring-enhancing abscesses [Figure 18]
Abnormal dural enhancement adjacent to the primary source of infection (e.g., paranasal sinuses).[77]
Figure 18 (A-E).
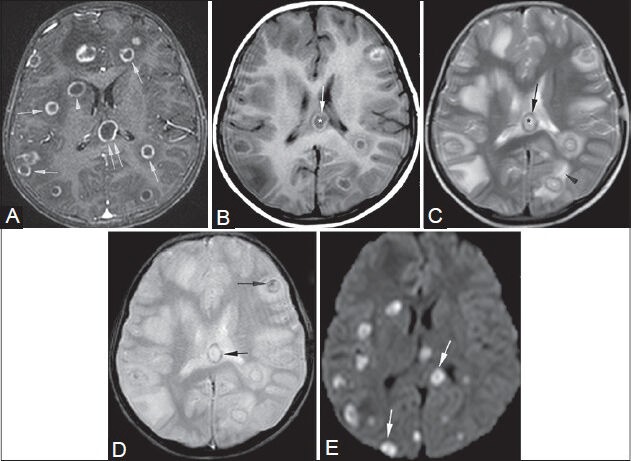
Aspergillosis. An 11-year-old female, K/C/O acute myeloid leukemia, presented with headache. Post-contrast T1W image (A): multiple ring-enhancing lesions in the cerebral hemispheres (single arrows), body of corpus callosum (double arrows), and right basal ganglia (arrowhead). T1W image (B): core- hypointense (*), rim- hyperintense (arrow). T2W image (C): core- hyperintense (*), rimhypointense (arrow), perilesional edema (arrowhead). GRE image (D): hemorrhagic foci in the walls and cores of lesions (arrows). Granulomas show restricted diffusion (arrows) on DWI (E). Histopathology: multiple Aspergillus hyphae and central necrosis
The abscesses appear hypointense on T1W images, with areas of hyperintensity peripherally or centrally, corresponding to hemorrhage.[80] On T2W images, they appear centrally hyperintense with a peripheral hypointense rim. In a study by Zinreich et al.[81] conducted in 1988, this rim of low signal intensity was attributed to fungal concretions containing iron, manganese, and magnesium that are found in abundance in the fungal hyphae at the periphery.
Hemorrhages occur in approximately 25% of the lesions and are seen as areas of blooming on gradient echo T2W images.[80] Enhancement may range from being peripheral and mild in immune suppressed patients to ring-enhancing lesions in patients with normal lymphocyte and white blood cell counts.[79] Rarely, CNS aspergillosis may also present with a mycotic aneurysm.[82]
Miscellaneous
Post shunt decompression in chronic hydrocephalus
Post-shunt decompression in patients of long-standing hydrocephalus yields typical MRI findings in the corpus callosum.
Prolonged lateral ventriculomegaly causes stretching and impingement of the corpus callosum against the rigid falx cerebri, resulting in chronic ischemia.[83] Rapid decompression of this long-standing hydrocephalus results in transcallosal demyelination.[83]
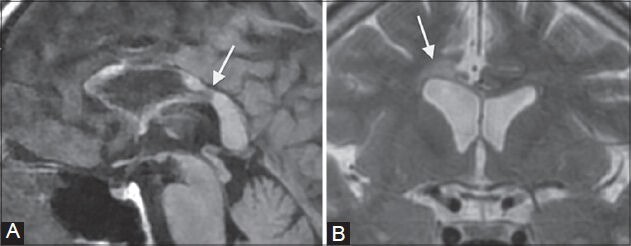
On MRI, the corpus callosum appears redundant and slightly increased in size, with signal changes appearing hypointense on T1W images and hyperintense on T2W images. Its rostral margin appears irregular due to segmental tethering by branches of the pericallosal artery [Figure 19]. The asymptomatic nature of these changes is assumed to be due to the relative sparing of the splenium.[83]
Figure 19 (A, B).
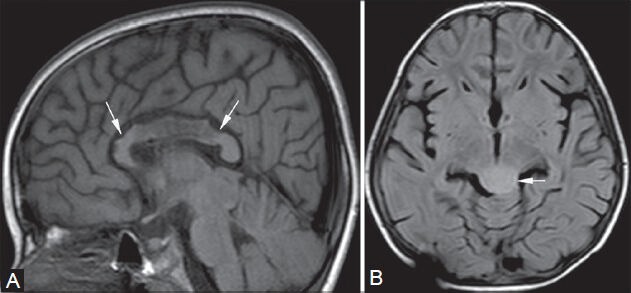
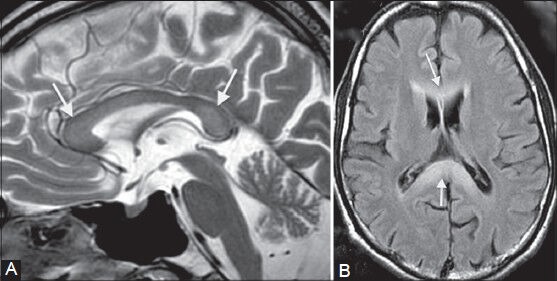
Post shunt decompression of chronic hydrocephalus. An 8-year-old female, K/C/O tectal glioma (arrow in B, FLAIR image) causing obstructive hydrocephalus, underwent an MRI for follow-up 7 days after palliative shunt decompression. The corpus callosum (arrows in A) appears redundant with irregular rostral margins and focal signal abnormalities, which appear hypointense on T1-weighted (A) and hyperintense on FLAIR images
Cytotoxic/vasogenic edema due to sinus thrombosis
Cerebral venous sinus thrombosis commonly presents as an acute neurological deterioration with symptoms such as headache, seizures, etc., Its etiology is varied with common causes being pregnancy or puerperal period, infection, dehydration, oral contraceptives, hypercoagulable states, and trauma.[84]
The superior sagittal sinus is the most commonly affected, followed by transverse and straight sinuses.[85] On comparison with dural sinus thrombosis, deep venous system thrombosis has a poorer clinical course and outcome, with a high incidence of coma and death.[86] The deep venous system consists mainly of the vein of Galen, internal cerebral veins, the basal vein of Rosenthal, and medullary and subependymal veins. This system drains the inferior frontal lobe, deep white matter of the parietal and temporal lobes, corpus callosum, thalamus, basal ganglia, and the upper brainstem.[87]
The appearance of the venous thrombus on T1W and T2W images depends on the stage of thrombus formation at the time of imaging. With the formation of paramagnetic products such as deoxyhemoglobin and intracellular methemoglobin within the thrombus, GRE sequences show blooming in the region of the sinuses due to magnetic susceptibility, making them highly specific[88] [Figure 20].
Figure 20 (A-E).
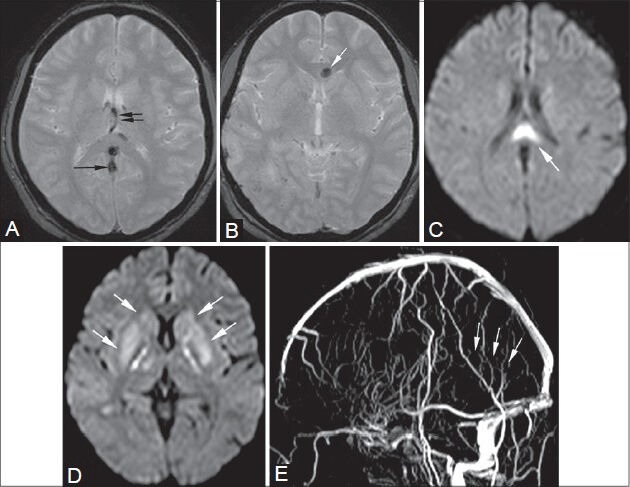
Cytotoxic/vasogenic edema. (A, B) GRE images. (C, D) Diffusion-weighted images. (E) Time-of-flight venography: A 28-year-old postpartum female presented with headache, giddiness, and ataxia. On MRI, thrombosis of the straight sinus (arrows in A, E) and internal cerebral veins (double arrows in A) is seen causing cytotoxic edema in bilateral basal ganglia (arrows in D) and body of corpus callosum (arrow in C). A hemorrhagic focus is also seen in the genu of corpus callosum (arrow in B)
By estimation of ADC values on diffusion-weighted sequences, we can differentiate between cytotoxic and vasogenic edema. Cytotoxic edema shows reduced ADC values (0.33 × 10⁻³ mm2/s to 0.58 × 10⁻³ mm2/s[89]) due to disabling of the Na+/K+ pump. Raised ADC values (around 1.1 × 10⁻³ mm2/s[91] to 1.955 × 10⁻³ mm2/s[92]) are seen in vasogenic edema, possibly due to raised dural sinus pressure. Both these patterns of edema can be seen together, with or without hemorrhage.[90]
It has also been observed that in patients diagnosed with venous sinus thrombosis along with reduced ADC values, the changes of edema have resolved.[89]
Hence, the term “infarct” should be discouraged, and should only be used if signal changes are irreversible and gliosis is demonstrated on follow-up scans.[85]
Conclusion
A number of pathologies affecting the corpus callosum, typical and typical, have thus been illustrated in this pictorial essay. The various conditions must be kept in mind in order to make an accurate diagnosis, which is essential for appropriate therapy, whether medical or surgical.
Footnotes
Source of Support: Nil
Conflict of Interest: None declared.
References
- 1.Barkovich AJ, Norman D. Anomalies of the corpus callosum: Correlation with further anomalies of the brain. Am J Roentgenol. 1988;151:171–9. doi: 10.2214/ajr.151.1.171. [DOI] [PubMed] [Google Scholar]
- 2.Hetts SW, Sherr EH, Chao S, Gobuty S, Barkovich AJ. Anomalies of the corpus callosum: An MR analysis of the phenotypic spectrum of associated malformations. Am J Roentgenol. 2006;187:1343–8. doi: 10.2214/AJR.05.0146. [DOI] [PubMed] [Google Scholar]
- 3.Caruso PA, Robertson R, Setty B, Grant E. Disorders of brain development. In: Atlas SW, editor. Magnetic Resonance imaging of the Brain and Spine. 4th ed. Philadelphia: Lippincott Williams and Wilkins; 2009. pp. 197–8. [Google Scholar]
- 4.Ketonen L, Hiwatashi A, Sidhu R. 1st ed. Berlin: Springer Verlag; 2005. Pediatric brain and spine, an atlas of MRI and spectroscopy; p. 24. [Google Scholar]
- 5.Tart RP, Quisling RG. Curvilinear and tubulonodular varieties of lipoma of the corpus callosum: An MR and CT study. J Comput Assist Tomogr. 1991;15:805–10. doi: 10.1097/00004728-199109000-00015. [DOI] [PubMed] [Google Scholar]
- 6.Jardim LB, Giugliani R, Fensom AH. Thalamic and basal ganglia hyperdensities: A CT marker for globoid cell leukodystrophy? Neuropediatrics. 1992;23:30–1. doi: 10.1055/s-2008-1071308. [DOI] [PubMed] [Google Scholar]
- 7.Lake BD. Lysosomal and peroxisomal disorders. In: Graham DI, Lantos PL, editors. Greenfield's Neuropathology. London: Arnold; 1997. pp. 657–753. [Google Scholar]
- 8.Van der Knaap MS, Valk J. Globoid cell leukodystrophy: Krabbe's disease. In: Van der knaap MS, Valk J, editors. Magnetic resonance of myelin, myelination, and myelin disorders. 2nd ed. Berlin: Springer-Verlag; 1995. p. 68. [Google Scholar]
- 9.Loes DJ, Peters C, Krivit W. Globoid cell leukodystrophy: Distinguishing early-onset from late-onset disease using a brain MR imaging scoring method. Am J Neuroradiol. 1999;20:316–23. [PMC free article] [PubMed] [Google Scholar]
- 10.Nusbaum AO, Rapalino O, Fung KM. White matter diseases and inherited metabolic disorders. In: Atlas SW, editor. Magnetic Resonance imaging of the Brain and Spine. 4th ed. Philadelphia: Lippincott Williams and Wilkins; 2009. p. 414. [Google Scholar]
- 11.Becker LE. Lysosomes peroxisomes and mitochondria: Function and disorder. Am J Neuroradiol. 1992;13:621–53. [PMC free article] [PubMed] [Google Scholar]
- 12.Moser HW. Adrenoleukodystrophy: Phenotype, genetics, pathogenesis and therapy. Brain. 1997;120:1485–508. doi: 10.1093/brain/120.8.1485. [DOI] [PubMed] [Google Scholar]
- 13.Assies J, Gooren LJ, Van Geel B, Barth PG. Signs of testicular insufficiency in adrenomyeloneuropathy and neurologically asymptomatic X-linked adrenoleukodystrophy: A retrospective study. Int J Androl. 1997;20:315–21. doi: 10.1046/j.1365-2605.1997.00066.x. [DOI] [PubMed] [Google Scholar]
- 14.Loes DJ, Fatemi A, Melhem ER, Gupte N, Bezman L, Moser HW, et al. Analysis of MRI patterns aids prediction of progression in X-linked adrenoleukodystrophy. Neurology. 2003;61:369–74. doi: 10.1212/01.wnl.0000079050.91337.83. [DOI] [PubMed] [Google Scholar]
- 15.Ge Y, Law M, Herbert J, Grossman RI. Prominent perivenular spaces in multiple sclerosis as a sign of perivascular inflammation in primary demyelination. Am J Neuroradiol. 2005;26:2316–9. [PMC free article] [PubMed] [Google Scholar]
- 16.Wilms G, Marchal G, Kersschot E, Vanhoenacker P, Demaerel P, Bosmans H, et al. Axial vs sagittal T2- weighted brain MR images in the evaluation of multiple sclerosis. J Comput Assist Tomogr. 1991;15:359–64. doi: 10.1097/00004728-199105000-00003. [DOI] [PubMed] [Google Scholar]
- 17.Gean-Marton AD, Vezina LG, Marton KI, Stimac GK, Peyster RG, Taveras JM, et al. Abnormal corpus callosum: A sensitive and specific indicator of multiple sclerosis. Radiology. 1991;180:215–21. doi: 10.1148/radiology.180.1.2052698. [DOI] [PubMed] [Google Scholar]
- 18.Nusbaum AO, Rapalino O, Fung KM. White matter diseases and inherited metabolic disorders. In: Atlas SW, editor. Magnetic Resonance imaging of the Brain and Spine. 4th ed. Philadelphia: Lippincott Williams and Wilkins; 2009. p. 365. [Google Scholar]
- 19.Dietemann JL, Beigelman C, Rumbach L, Vouge M, Tajahmady T, Faubert C, et al. Multiple sclerosis and corpus callosum atrophy: relationship of MRI findings to clinical data. Neuroradiology. 1988;30:478–80. doi: 10.1007/BF00339686. [DOI] [PubMed] [Google Scholar]
- 20.Nusbaum AO, Rapalino O, Fung KM. White matter diseases and inherited metabolic disorders. In: Atlas SW, editor. Magnetic Resonance imaging of the Brain and Spine. 4th ed. Philadelphia: Lippincott Williams and Wilkins; 2009. p. 373. [Google Scholar]
- 21.Kermode AG, Tofts PS, Thompson AJ, MacManus DG, Rudge P, Kendall BE, et al. Heterogeneity of blood-brain barrier changes in multiple sclerosis: An MRI study with gadolinium-DTPA enhancement. Neurology. 1990;40:229–35. doi: 10.1212/wnl.40.2.229. [DOI] [PubMed] [Google Scholar]
- 22.Given CA, 2nd, Stevens BS, Lee C. The MRI appearance of tumefactive demyelinating lesions. Am J Roentgenol. 2004;182:195–9. doi: 10.2214/ajr.182.1.1820195. [DOI] [PubMed] [Google Scholar]
- 23.Dagher AP, Smirniotopoulos J. Tumefactive demyelinating lesions. Neuroradiology. 1996;38:560–5. doi: 10.1007/BF00626098. [DOI] [PubMed] [Google Scholar]
- 24.Masdeu JC, Moreira J, Trasi S, Visintainer P, Cavaliere R, Grundman M. The open ring: A new imaging sign in demyelinating disease. J Neuroimaging. 1996;6:104–7. doi: 10.1111/jon199662104. [DOI] [PubMed] [Google Scholar]
- 25.Cha S, Pierce S, Knopp EA. Dynamic contrast-enhanced T2-weighted MR imaging of tumefactive demyelinating lesions. Am J Neuroradiol. 2001;22:1109–16. [PMC free article] [PubMed] [Google Scholar]
- 26.Kepes JJ. Large focal tumor-like demyelinating lesions of the brain: Intermediate entity between multiple sclerosis and acute disseminated encephalomyelitis? A study of 31 patients. Ann Neurol. 1993;33:18–27. doi: 10.1002/ana.410330105. [DOI] [PubMed] [Google Scholar]
- 27.Marchiafava E, Bignami A. On a corpus callosa alteration observed in alcoholic subjects. Riv Patol Nerv Ment. 1903;8:544–9. [Google Scholar]
- 28.Nusbaum AO, Rapalino O, Fung KM. White matter diseases and inherited metabolic disorders. In: Atlas SW, editor. Magnetic Resonance imaging of the Brain and Spine. 4th ed. Philadelphia: Lippincott Williams and Wilkins; 2009. p. 393. [Google Scholar]
- 29.Chang KH, Cha SH, Han MH, Park SH, Nah DL, Hong JH. Marchiafava-Bignami disease—Serial changes in corpus-callosum on MRI. Neuroradiology. 1992;34:480–2. doi: 10.1007/BF00598954. [DOI] [PubMed] [Google Scholar]
- 30.Ruiz-Martínez J, Martínez Pérez-Balsa A, Ruibal M, Urtasun M, Villanua J, Martí Massó JF, et al. Marchiafava-Bignami disease with widespread extracallosal lesions and favourable course. Neuroradiology. 1999;41:40–3. doi: 10.1007/s002340050702. [DOI] [PubMed] [Google Scholar]
- 31.Gentry LR. Head trauma. In: Atlas SW, editor. Magnetic Resonance Imaging of the Brain and Spine. New York: Raven Press; 1991. pp. 436–9. [Google Scholar]
- 32.Adams JH, Doyle D, Ford I, Gennarelli TA, Graham DI, McLellan DR. Diffuse axonal injury in head injury: Definition, diagnosis and grading. Histopathology. 1989;15:49–59. doi: 10.1111/j.1365-2559.1989.tb03040.x. [DOI] [PubMed] [Google Scholar]
- 33.Atlas SW, Mark AS, Grossman RI, Gomori JM. Intracranial haemorrhage: gradient-echo MR imaging at 1.5 T. Comparison with spin-echo imaging and clinical applications. Radiology. 1988;168:803–7. doi: 10.1148/radiology.168.3.3406410. [DOI] [PubMed] [Google Scholar]
- 34.Ture U, Yasargil MG, Krisht AF. The arteries of the corpus callosum: A microsurgical anatomic study. Neurosurgery. 1996;39:1075–85. doi: 10.1097/00006123-199612000-00001. [DOI] [PubMed] [Google Scholar]
- 35.Chrysikopoulos H, Andreou J, Roussakis A, Pappas J. Infarction of the corpus callosum: Computed tomography and magnetic resonance imaging. Eur J Radiol. 1997;25:2–8. doi: 10.1016/s0720-048x(96)01155-2. [DOI] [PubMed] [Google Scholar]
- 36.Twomey E, Twomey A, Ryan S, Murphy J, Donoghue VB. MR imaging of term infants with hypoxic-ischemic encephalopathy as a predictor of neurodevelopmental outcome and late MRI appearances. Pediatr Radiol. 2010;40:1526–35. doi: 10.1007/s00247-010-1692-9. [DOI] [PubMed] [Google Scholar]
- 37.Reifenberger G, Kros JM, Burger PC, Louis DN, Collins VP. Oligodendroglioma. In: Kleihues P, Cavenee WK, editors. Pathology and genetics of tumours of the nervous system. Lyon, France: IARC Press; 2000. pp. 56–61. [Google Scholar]
- 38.Shaw EG, Scheithauer BW, O’Fallon JR, Tazelaar HD, Davis DH. Oligodendrogliomas: The Mayo Clinic experience. J Neurosurg. 1992;76:428–34. doi: 10.3171/jns.1992.76.3.0428. [DOI] [PubMed] [Google Scholar]
- 39.Vonofakos D, Marcu H, Hacker H. Oligodendrogliomas: CT patterns with emphasis on features indicating malignancy. J Comput Assist Tomogr. 1979;3:783–8. [PubMed] [Google Scholar]
- 40.Olson JD, Riedel E, DeAngelis LM. Long-term outcome of low-grade oligodendroglioma and mixed glioma. Neurology. 2000;54:1442–8. doi: 10.1212/wnl.54.7.1442. [DOI] [PubMed] [Google Scholar]
- 41.Shaw EG, Scheithauer BW, O’Fallon JR, Davis DH. Mixed oligoastrocytomas: A survival and prognostic factor analysis. Neurosurgery. 1994;34:577–82. doi: 10.1227/00006123-199404000-00002. discussion 582. [DOI] [PubMed] [Google Scholar]
- 42.Lee C, Duncan VW, Young AB. Magnetic resonance features of the enigmatic oligodendroglioma. Invest Radiol. 1998;33:222–31. doi: 10.1097/00004424-199804000-00005. [DOI] [PubMed] [Google Scholar]
- 43.Kim L, Hochberg FH, Thornton AF, Harsh GR, 4th, Patel H, Finkelstein D, et al. Procarbazine, lomustine, and vincristine (PCV) chemotherapy for grade III and grade IV oligoastrocytomas. J Neurosurg. 1996;85:602–7. doi: 10.3171/jns.1996.85.4.0602. [DOI] [PubMed] [Google Scholar]
- 44.Perry JR, Cairncross JG. J Vecht Ched. Handbook of Clinical Neurology. Vol. 24. New York, NY: Elsevier Science Inc; 1997. Oligodendrogliomas; pp. 123–3. [Google Scholar]
- 45.Perry JR, Louis DN, Cairncross J. Current Treatment of Oligodendrogliomas. Arch Neurol. 1999;56:434–6. doi: 10.1001/archneur.56.4.434. [DOI] [PubMed] [Google Scholar]
- 46.Kleihues P, Burger PC, Collins VP, Newcomb EW, Ohgaki H, Cavenee WK. Glioblastoma. In: Kleihues P, Cavenee WK, editors. Pathology and genetics of tumors of the nervous system. Lyon, France: IARC; 2000. pp. 29–39. [Google Scholar]
- 47.Rees JH, Smirniotopoulos JG, Jones RV, Wong K. Glioblastoma multiforme: Radiologic-pathologic correlation. Radiographics. 1996;16:1413–38. doi: 10.1148/radiographics.16.6.8946545. quiz 1462-3. [DOI] [PubMed] [Google Scholar]
- 48.Jayaraman MV, Boxerman JL. Adult brain tumors. In: Atlas SW, editor. Magnetic Resonance imaging of the Brain and Spine. 4th ed. Philadelphia: Lippincott Williams and Wilkins; 2009. p. 487. [Google Scholar]
- 49.Roman-Goldstein SM, Goldman DL, Howieson J, Belkin R, Neuwelt EA. MR in primary CNS lymphoma in immunologically normal patients. Am J Neuroradiol. 1992;13:1207–13. [PMC free article] [PubMed] [Google Scholar]
- 50.Jack CR, Jr, O’Neill BP, Banks PM, Reese DF. Central nervous system lymphoma: Histologic types and CT appearance. Radiology. 1988;167:211–5. doi: 10.1148/radiology.167.1.3279454. [DOI] [PubMed] [Google Scholar]
- 51.Erdag N, Bhorade RM, Alberico RA, Yousuf N, Patel MR. Primary lymphoma of the central nervous system: Typical and atypical CT and MR imaging appearances. Am J Roentgenol. 2001;176:1319–26. doi: 10.2214/ajr.176.5.1761319. [DOI] [PubMed] [Google Scholar]
- 52.Hochberg FH, Miller DC. Primary central nervous system lymphoma. J Neurosurg. 1988;68:835–53. doi: 10.3171/jns.1988.68.6.0835. [DOI] [PubMed] [Google Scholar]
- 53.Jayaraman MV, Boxerman JL. Adult brain tumors. In: Atlas SW, editor. Magnetic Resonance imaging of the Brain and Spine. 4th ed. Philadelphia: Lippincott Williams and Wilkins; 2009. p. 525. [Google Scholar]
- 54.Takanashi J, Barkovich AJ, Yamaguchi K, Kohno Y. Influenza-associated encephalitis/encephalopathy with a reversible lesion in the splenium of the corpus callosum: A case report and literature review. Am J Neuroradiol. 2004;25:798–802. [PMC free article] [PubMed] [Google Scholar]
- 55.Kim SS, Chang KH, Kim ST, Suh DC, Cheon JE, Jeong SW, et al. Focal lesion in the splenium of the corpus callosum in epileptic patients: Antiepileptic drug toxicity? Am J Neuroradiol. 1999;20:125–9. [PubMed] [Google Scholar]
- 56.Tada H, Takanashi J, Barkovich AJ, Oba H, Maeda M, Tsukahara H, et al. Clinically mild encephalitis/encephalopathywith reversible splenial lesion. Neurology. 2004;63:1854–8. doi: 10.1212/01.wnl.0000144274.12174.cb. [DOI] [PubMed] [Google Scholar]
- 57.Malhotra HS, Garg RK, Vidhate MR, Sharma PK. Boomerang sign: Clinical significance of transient lesion in splenium of corpus callosum. Ann Indian Acad Neurol. 2012;15:151–7. doi: 10.4103/0972-2327.95005. [DOI] [PMC free article] [PubMed] [Google Scholar]
- 58.Krause KH, Rascher W, Berlit P. Plasma arginine vasopressin concentrations in epileptics under monotherapy. J Neurol. 1983;230:193–6. doi: 10.1007/BF00313630. [DOI] [PubMed] [Google Scholar]
- 59.Gürtler S, Ebner A, Tuxhorn I, Ollech I, Pohlmann-Eden B, Woermann FG. Transient lesion in the splenium of the corpus callosum and antiepileptic drug withdrawal. Neurology. 2005;65:1032–6. doi: 10.1212/01.wnl.0000179301.96652.27. [DOI] [PubMed] [Google Scholar]
- 60.Hackett PH, Yarnell PR, Hill R, Reynard K, Heit J, McCormick J. High-altitude cerebral edema evaluated with magnetic resonance imaging. JAMA. 1998;280:1920–5. doi: 10.1001/jama.280.22.1920. [DOI] [PubMed] [Google Scholar]
- 61.Conti M, Salis A, Urigo C, Canalis L, Frau S, Canalis GC. Transient focal lesion in the splenium of the corpus callosum: MR imaging with an attempt to clinical-physiopathological explanation and review of the literature. Radiol Med. 2007;112:921–35. doi: 10.1007/s11547-007-0197-9. [DOI] [PubMed] [Google Scholar]
- 62.Oster J, Doherty C, Grant PE, Simon M, Cole AJ. Diffusion-weighted imaging abnormalities in the splenium after seizures. Epilepsia. 2003;44:852–4. doi: 10.1046/j.1528-1157.2003.40902.x. [DOI] [PubMed] [Google Scholar]
- 63.Parker JC, Jr, Dyer MC. Neurologic infections due to bacteria fungi, and parasites. In: Doris RL, Robertson DM, editors. Textbook of Neuropathology. Baltimore: Williams and Wilkins; 1985. pp. 632–703. [Google Scholar]
- 64.Fath-Ordoubadi F, Lane RJ, Richards PG. Histological surprise: Callosal tuberculoma presenting as malignant glioma. J Neurol Neurosurg Psychiatry. 1997;63:98–9. doi: 10.1136/jnnp.63.1.98. [DOI] [PMC free article] [PubMed] [Google Scholar]
- 65.Gupta RK, Poptani H, Kohli A, Chhabra DK, Sharma B, Gujral RB. In vivo localized proton magnetic resonance spectroscopy of intracranial tuberculomas. Indian J Med Res. 1995;101:19–24. [PubMed] [Google Scholar]
- 66.Al-Okaili RN, Krejza J, Wang S, Woo JH, Melhem ER. Advanced MR imaging techniques in the diagnosis of intraaxial brain tumors in adults. Radiographics. 2006;26(Suppl 1):S173–89. doi: 10.1148/rg.26si065513. [DOI] [PubMed] [Google Scholar]
- 67.Lai PH, Ho JT, Chen WL, Hsu SS, Wang JS, Pan HB, et al. Brain abscess and necrotic brain tumor: discrimination with proton MR spectroscopy and diffusion-weighted imaging. Am J Neuroradiol. 2002;23:1369–77. [PMC free article] [PubMed] [Google Scholar]
- 68.Gupta RK, Prakash M, Mishra AM, Husain M, Prasad KN, Husain N. Role of diffusion weighted imaging in differentiation of intracranial tuberculoma and tuberculous abscess from cysticercus granulomas-a report of more than 100 lesions. Eur J Radiol. 2005;55:384–92. doi: 10.1016/j.ejrad.2005.02.003. [DOI] [PubMed] [Google Scholar]
- 69.Yang D, Korogi Y, Sugahara T, Kitajima M, Shigematsu Y, Liang L, et al. Cerebral gliomas: Prospective comparison of multivoxel 2D chemical-shift imaging proton MR spectroscopy, echoplanar perfusion and diffusion-weighted MRI. Neuroradiology. 2002;44:656–66. doi: 10.1007/s00234-002-0816-9. [DOI] [PubMed] [Google Scholar]
- 70.Cha S. Update on brain tumor imaging: From anatomy to physiology. Am J Neuroradiol. 2006;27:475–87. [PMC free article] [PubMed] [Google Scholar]
- 71.Okumura A, Kuwata K, Takenaka K, Nishimura Y, Shirakami S, Sakai N, et al. Pulsed off-resonance magnetization transfer for brain tumor in patients. Neurol Res. 1998;20:313–9. doi: 10.1080/01616412.1998.11740524. [DOI] [PubMed] [Google Scholar]
- 72.Woff SD, Balaban RS. Magnetization transfer contrast and tissue water proton relaxation in vivo. Magn Reson Med. 1989;10:135–44. doi: 10.1002/mrm.1910100113. [DOI] [PubMed] [Google Scholar]
- 73.Goebell E, Fiehler J, Siemonsen S, Vaeterlein O, Heese O, Hagel C, et al. Macromolecule content influences proton diffusibility in gliomas. Eur Radiol. 2011;21:2626–32. doi: 10.1007/s00330-011-2206-3. [DOI] [PubMed] [Google Scholar]
- 74.Trivedi R, Saksena S, Gupta RK. Magnetic resonance imaging in central nervous system tuberculosis. Indian J Radiol Imaging. 2009;19:256–65. doi: 10.4103/0971-3026.57205. [DOI] [PMC free article] [PubMed] [Google Scholar]
- 75.Farrar DJ, Flanigan TP, Gordon NM, Gold RL, Rich JD. Tuberculous brain abscess in a patient with HIV infection: Case report and review. Am J Med. 1997;102:297–301. doi: 10.1016/S0002-9343(97)00386-0. [DOI] [PubMed] [Google Scholar]
- 76.Cox J, Murtagh FR, Wilfong A, Brenner J. Cerebral aspergillosis: MR imaging and histopathologic correlation. Am J Neuroradiol. 1992;13:1489–92. [PMC free article] [PubMed] [Google Scholar]
- 77.Ashdown BC, Tien RD, Felsberg GJ. Aspergillosis of the brain and paranasal sinuses in immunocompromised patients: CT and MR imaging findings. Am J Roentgenol. 1994;162:155–9. doi: 10.2214/ajr.162.1.8273655. [DOI] [PubMed] [Google Scholar]
- 78.Beal MF, O’Carroll P, Kleinman GM, Grossman RI. Aspergillosis of the nervous system. Neurology. 1982;32:473–9. doi: 10.1212/wnl.32.5.473. [DOI] [PubMed] [Google Scholar]
- 79.DeLone DR, Goldstein RA, Petermann G, Salamat MS, Miles JM, Knechtle SJ, et al. Disseminated aspergillosis involving the brain: Distribution and imaging characteristics. Am J Neuroradiol. 1999;20:1597–604. [PMC free article] [PubMed] [Google Scholar]
- 80.Almutairi BM, Nguyen TB, Jansen GH, Asseri AH. Invasive aspergillosis of the brain: Radiologic-pathologic correlation. Radiographics. 2009;29:375–9. doi: 10.1148/rg.292075143. [DOI] [PubMed] [Google Scholar]
- 81.Zinreich SJ, Kennedy DW, Malat J, Curtin HD, Epstein JI, Huff LC, et al. Fungal sinusitis: Diagnosis with CT and MR imaging. Radiology. 1988;169:439–44. doi: 10.1148/radiology.169.2.3174990. [DOI] [PubMed] [Google Scholar]
- 82.Harris DE, Enterline DS. Fungal infections of the central nervous system. Neuroimaging Clin N Am. 1997;7:187–98. [PubMed] [Google Scholar]
- 83.Suh DY, Gaskill-Shipley M, Nemann MW, Tureen RG, Warnick RE. Corpus callosal changes associated with hydrocephalus: A report of two cases. Neurosurgery. 1997;41:488–94. doi: 10.1097/00006123-199708000-00037. [DOI] [PubMed] [Google Scholar]
- 84.Stam J. Cerebral venous and sinus thrombosis: Incidence and causes in ischemic stroke. Adv Neurol. 2003;92:225–32. [PubMed] [Google Scholar]
- 85.Leach JL, Fortuna RB, Jones BV, Gaskill-Shipley MF. Imaging of cerebral venous thrombosis: Current techniques, spectrum of findings, and diagnostic pitfalls. Radiographics. 2006;26(Suppl 1):S19–41. doi: 10.1148/rg.26si055174. discussion S42-3. [DOI] [PubMed] [Google Scholar]
- 86.Crawford SC, Digre KB, Palmer CA, Bell DA, Osborn AG. Thrombosis of the deep venous drainage of the brain in adults. Analysis of seven cases with review of the literature. Arch Neurol. 1995;52:1101–8. doi: 10.1001/archneur.1995.00540350095021. [DOI] [PubMed] [Google Scholar]
- 87.Meder JF, Chiras J, Roland J, Guinet P, Bracard S, Bargy F. Venous territories of the brain. J Neuroradiol. 1994;21:118–33. [PubMed] [Google Scholar]
- 88.Selim M, Fink J, Linfante I, Kumar S, Schlaug G, Caplan LR. Diagnosis of cerebral venous thrombosis with echo-planar T2*-weighted magnetic resonance imaging. Arch Neurol. 2002;59:1021–6. doi: 10.1001/archneur.59.6.1021. [DOI] [PubMed] [Google Scholar]
- 89.Ducreux D, Oppenheim C, Vandamme X, Dormont D, Samson Y, Rancurel G, et al. Diffusion-weighted imaging patterns of brain damage associated with cerebral venous thrombosis. Am J Neuroradiol. 2001;22:261–8. [PMC free article] [PubMed] [Google Scholar]
- 90.Lovblad KO, Bassetti C, Schneider J, Ozdoba C, Remonda L, Schroth G. Diffusion-weighted MRI suggests the coexistence of cytotoxic and vasogenic oedema in a case of deep cerebral venous thrombosis. Neuroradiology. 2000;42:728–31. doi: 10.1007/s002340000395. [DOI] [PubMed] [Google Scholar]
- 91.Keller E, Flacke S, Urbach H, Schild HH. Diffusion- and perfusion-weighted magnetic resonance imaging in deep cerebral venous thrombosis. Stroke. 1999;30:1144–6. doi: 10.1161/01.str.30.5.1144. [DOI] [PubMed] [Google Scholar]
- 92.Koch S, Rabinstein A, Falcone S, Forteza A. Diffusion-weighted imaging shows cytotoxic and vasogenic edema in eclampsia. Am J Neuroradiol. 2001;22:1068–70. [PMC free article] [PubMed] [Google Scholar]