Abstract
The mitochondrial protein frataxin plays a central role in mitochondrial iron homeostasis, and frataxin deficiency is responsible for Friedreich ataxia, a neurodegenerative and cardiac disease that affects 1 in 40000 children. Here we present a single-particle reconstruction from cryoelectron microscopic images of iron-loaded 24-subunit oligomeric frataxin particles at 13 and 17 Å resolution. Computer-aided classification of particle images showed heterogeneity in particle size, which was hypothesized to result from gradual accumulation of iron within the core structure. Thus, two reconstructions were created from two classes of particles with iron cores of different sizes. The reconstructions show the iron core of frataxin for the first time. Compared to the previous reconstruction of iron-free particles from negatively stained images, the higher resolution of the present reconstruction allowed a more reliable analysis of the overall three-dimensional structure of the 24-meric assembly. This was done after docking the X-ray structure of the frataxin trimer into the EM reconstruction. The structure revealed a close proximity of the suggested ferroxidation sites of different monomers to the site proposed to serve in iron nucleation and mineralization. The model also assigns a new role to the N-terminal helix of frataxin in controlling the channel at the 4-fold axis of the 24-subunit oligomer. The reconstructions show that, together with some common features, frataxin has several unique features which distinguish it from ferritin. These include the overall organization of the oligomers, the way they are stabilized, and the mechanisms of iron core nucleation.
Iron is one of the central elements required for the functioning of living organisms (1). It is often found within prosthetic groups in the active centers of many enzymes and oxygen carrier proteins. Despite its abundance in the Earth’s crust, however, iron is not easily available to organisms. At physiological pH and in the presence of oxygen it mainly exists in a biologically inert state as Fe(III), which is characterized by extremely low solubility [approximately 10−10 M and 10−18 M for Fe(II) and Fe(III), respectively]. On the other hand, the Fe(II) state is highly active chemically and may promote the generation of highly toxic compounds, commonly referred to as reactive oxygen species (ROS),1 capable of causing severe damage to biological material (2). For these reasons living organisms require molecular mechanisms for acquisition, safe transportation, delivery, and detoxification of iron. The conserved ferritin, Dps (DNA binding proteins from starved cells), and frataxin families of proteins have a critical role in iron storage and detoxification in the cytoplasm and other cellular compartments (3–6). The importance of frataxin in iron homeostasis was first demonstrated by the observation that development of the hereditary autosomal disease Friedreich ataxia (FRDA) is linked to mutations in and dysfunction of frataxin (7). FRDA is a progressive disease of children and adolescents and is characterized by neurological impairment, cardiomyopathy, and diabetes mellitus. The majority of patients with FRDA have been recognized to have extensive GAA repeats in the first intron of the frataxin-encoding gene, which leads to abnormal DNA structures and impaired gene transcription, causing frataxin deficiency in cells and aberrations in cellular iron homeostasis (8).
Proteins from both the frataxin and ferritin superfamilies have been shown to assemble into large multimeric particles capable of detoxifying iron by catalyzing the oxidation of Fe(II) to Fe(III) and storing large amounts of the metal in the form of a ferrihydrite mineral within the core of the particles. The functional particles of ferritin, which are capable of storing up to 4500 iron atoms, are built up of 24 monomers arranged in 234 symmetry (3, 4). Dps monomers are arranged in 23 symmetry and built up of dodecameric particles capable of storing up to 500 iron atoms (9). In contrast, frataxin and its bacterial homologue CyaY may exist in several oligomeric states in solution, with varying amounts of stored iron (10, 11). In the case of yeast frataxin, the iron-dependent assembly has been suggested to proceed through several stable intermediates: α → α3 → α6 → α12→ α24 → α48 (12, 13). The largest oligomers can contain up to 2400 iron atoms (12, 13). Stabilization and stepwise assembly of yeast frataxin oligomers have been suggested to be mediated by interactions between the ferrihydrite crystallites, formed at separate mineralization sites. This suggestion is supported by the observation that yeast frataxin oligomers can be readily disassembled into monomers upon reduction of their ferric iron core (14). Unlike yeast frataxin, human frataxin assembles in an iron-independent manner, presumably via subunit—subunit interactions mediated by the unconserved N-terminal region of the protein (15).
Sequence and three-dimensional structure analysis of ferritin and Dps clearly suggest evolutionary relationships between these two families, but not with the frataxin family. While ferritin and Dps monomers are folded into a fourhelix bundle, frataxin is folded into an α—β sandwich structure in which two helices are packed against a five-stranded β-sheet. Despite these structural differences, several features of the frataxin oligomer structure show striking similarities to the ferritin superfamily. Among these is the arrangement of monomers within the particles into trimers, which creates a highly negatively charged channel at the 3-fold axis, and the charge distribution on the side of the oligomers that faces the inner core of the particles (16). One of the specific features that distinguish frataxin from the ferritin superfamily is its unique ability to deliver iron to other proteins within the mitochondria. Among these is ferrochelatase, the terminal enzyme of heme biosynthesis (14, 17–19), the scaffold protein IscU, which initiates the assembly of iron—sulfur clusters (20), and mitochondrial aconitase, which needs iron for the repair of its ISC (21). Frataxin has also been shown to interact with succinate dehydrogenase, a component of mitochondrial complex II (22), while one of the subunits of complex I was found to be a structural homologue of frataxin (23). In this paper, we present single-particle reconstructions of two forms of the iron-loaded 24-subunit oligomeric frataxin from cryo-EM images. The results provide the first structural insight into the gradual accumulation of iron in the core of frataxin.
EXPERIMENTAL PROCEDURES
Protein Preparation
The Y73A variant of frataxin from Saccharomyces cerevisiae, which included residues 52–174 corresponding to the mature form of the protein (24), was expressed as a recombinant protein in Escherichia coli and purified as described previously (16). This variant of yeast frataxin assembles in an iron-independent fashion into trimers and 24-subunit oligomers. Iron loading of the 24-subunit oligomer was accomplished using the same procedure as described previously (12, 13).
Cryo-EM Data Acquisition and Image Processing
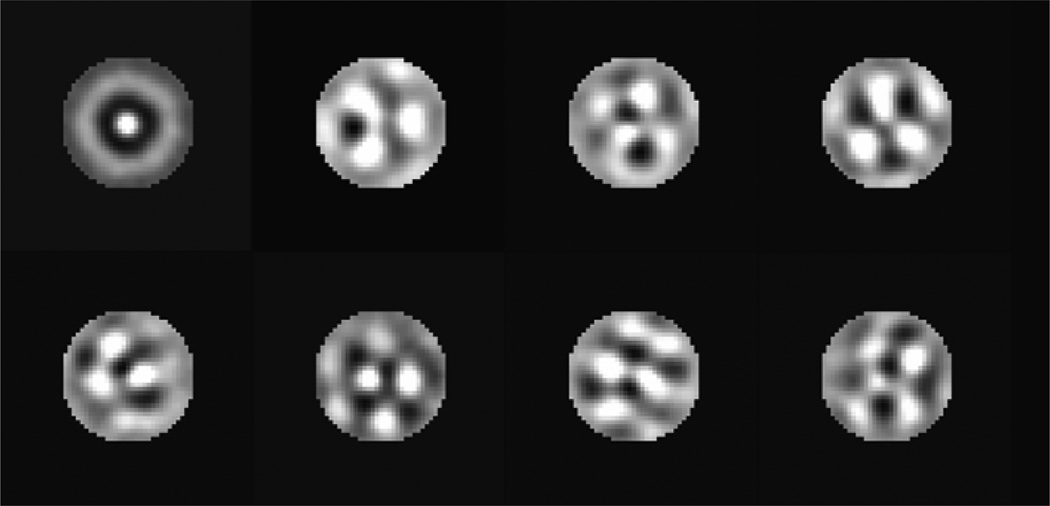
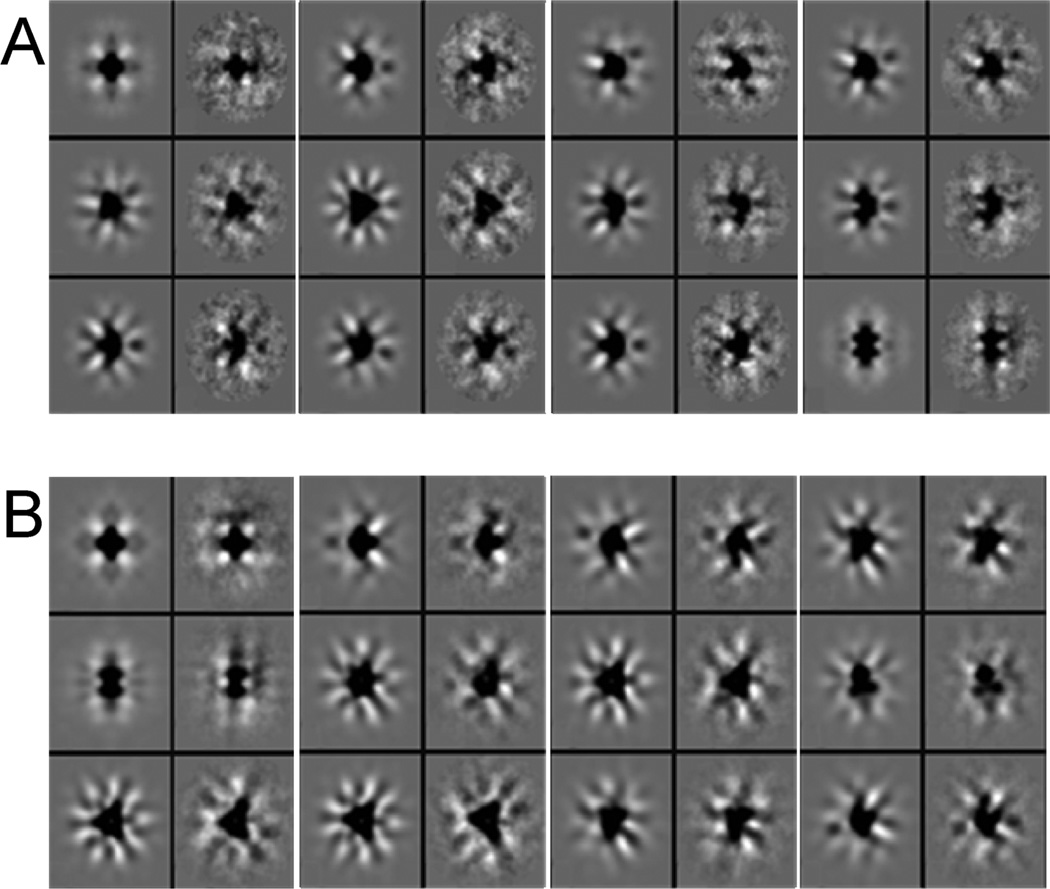
Two-microliter aliquots of protein solution (with a concentration of 0.1 mg/mL) were applied to glow-discharged Quantifoil R 2/4 400-mesh copper grids (Canemco & Marivac, Jena, Germany) in the humidity-controlled environment of a Vitrobot (FEI Co., Eindhoven, The Netherlands) at 100% humidity and a temperature of 16 °C. After adsorption for 40 s, excess solution was removed by blotting with a filter paper, and the specimen was flash-frozen in liquid ethane, cooled with liquid nitrogen. Images were acquired under low-dose conditions (10–15 electrons/Å2) using a JEOL 2100F transmission electron microscope equipped with a field-emission gun and operated at an acceleration voltage of 120 kV. Image data were recorded onto SO-163 film (Kodak, Rochester, NY) at 50000× magnification. The micrographs were digitized using a Zeiss SCAI scanner, resulting in a sampling size corresponding to 1.4 Å/pixel at the specimen level. Selection of particles was performed automatically in Boxer, which is part of the Eman program package (25), by using image dimensions large enough to prevent cutoff of high-resolution information spread outside the boundaries of the particles. The CTF was parametrized individually for each micrograph in Ctfit (25), by using the averaged power spectrum calculated from the set of 256 × 256 pixel images periodically boxed over the micrograph with a 50% overlap between each image. Correction for the contrast inversions was performed simultaneously with a careful up-weighting of high-frequency components by applying a Wiener filter to each defocus group using the commands tf c and tf cts in Spider. Translational alignment, using only integer shifts, to avoid interpolation artifacts, was performed in EMAN before reducing the image dimensions to allow for ~30% background padding around the particles and applying a Gaussian mask. After translational alignment and compression by correspondence analysis, the images were clustered according to the radial symmetry eigenvectors describing the variation in iron core size. For this, we used hierarchic ascendant classification as implemented in Spider (26, 27). There were five classes describing the main variations in size. These were subsequently merged into two main classes for further processing (Figure 2). Three-dimensional (3D) reconstruction was performed on iron core size-invariant groups using angular reconstitution as implemented in the EMAN software package (25). The octahedral symmetry was applied in the combined alignment and reconstruction algorithm in EMAN, which converged after three refinement cycles. Both data sets showed an even angular distribution, with data points present in the entire Euler angle space. For the data set containing the large particles, 1777 out of 3495 particles/images were used for the final reconstruction, and for the small particle data set, 12464 out of 16497 particles/images were used. The resolution of the reconstructions was determined according to the 0.5 Fourier shell correlation criteria. Validation of the final reconstructions was accomplished by comparing class averages with projections of the 3D reconstructions in the same angular orientation (see Figure 4). Docking of the trimeric X-ray structure (PDB id 2FQL) into the low-resolution EM envelope was performed manually in Chimera (28). Rendered images were generated in either Chimera (28) or PyMOL (29).
Figure 2.
Images of the first eight eigenvectors calculated from correspondence analysis. The first vector describes the size variation in the population and was used to create the size-dependent classes. The remaining seven vectors show the different symmetry elements present in the population. All three axes of rotation of the octahedral point group, 2-, 3-, and 4-fold, can be distinguished. This symmetry operation was applied in the alignment and in the subsequent reconstruction used to calculate the two 3D volumes.
Figure 4.
Validation of the final reconstructions was performed by comparing class averages with projections of the 3D reconstructions in the same angular orientation. (A) represents the validation for the large reconstruction and (B) for the small. For each pair the images in the left columns are projection images of the final reconstruction, while the images in the right columns are class averages of the individual classes used to make the final reconstruction.
RESULTS
Reconstruction of Particles
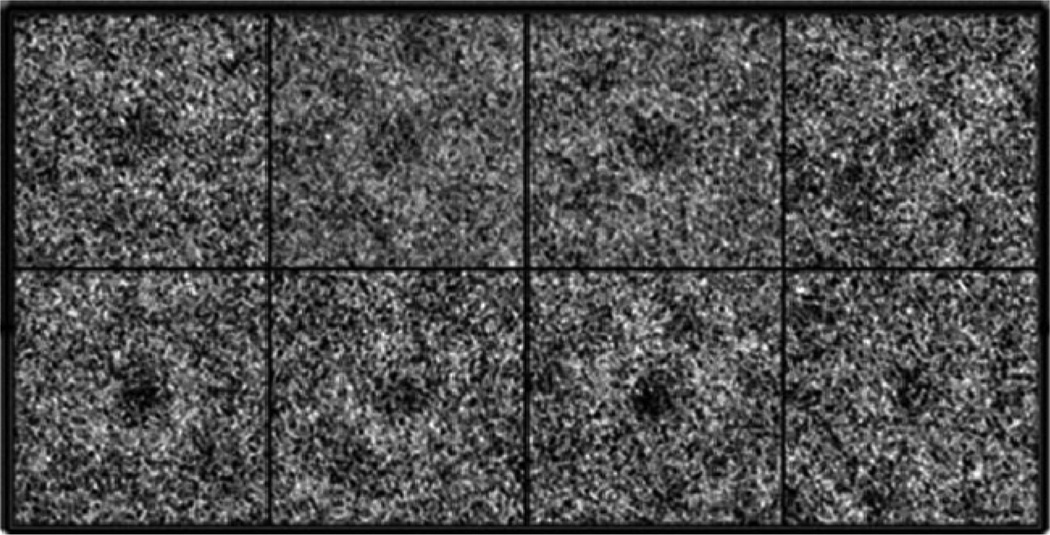
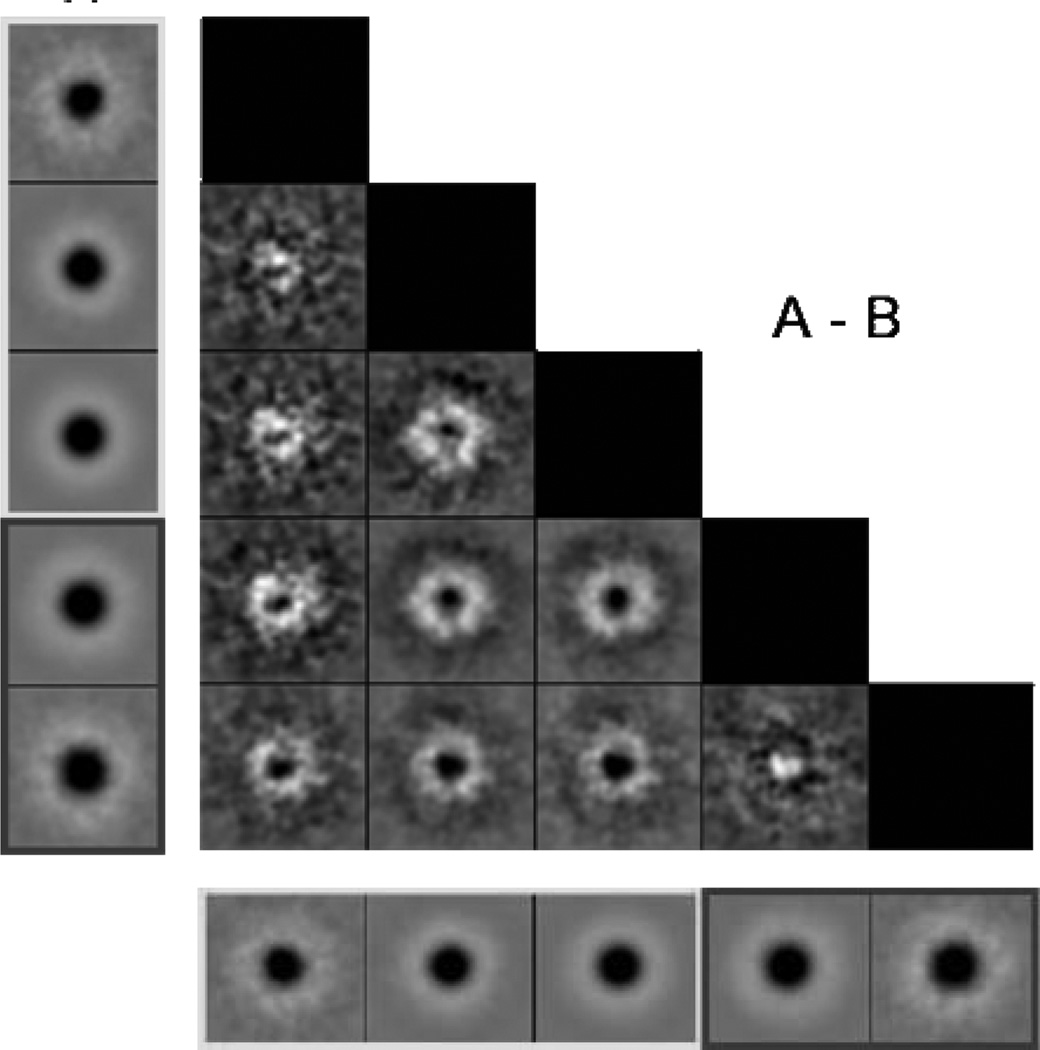
As shown in the micrographs in Figure 1, the iron cores of the frataxin oligomers could be directly observed as dark density in the centers of the individual particles. This is a result of the higher amplitude/phase contrast ratio of the iron core, as compared to the surrounding protein material (Figure 1). It became clear even at the stage of the initial processing of the images that the particle population was highly heterogeneous in size, which seemed to be a result of the variations in the size of the iron core. After compression in factor space by using correspondence analysis, radial symmetric eigenvectors were selected for hierarchic ascendant classification of the only translationally aligned population (30). The octahedral point-group symmetry was inferred from eigenimage analysis which revealed 2-, 3-, and 4-fold symmetries in the seventh, eighth, and fourth eigenvectors (Figure 2). The first eigenimage describes the size variation within the population. Classification based on this eigenvector resulted in five classes representing the main variations in size. The results of a systematic calculation of the pairwise differences between the two-dimensional (2D) class averages are presented in a schematic diagram shown on Figure 3. The three first classes had a smaller size with approximately 185 Å in diameter, compared to the large-particle classes which had approximately 195 Å in diameter. The classes containing small and large oligomers were assigned 16497 and 3495 particles, which was 82.5% and 17.5%, respectively, of the total number of particles (19992). Two individual 3D reconstructions were generated from the two particle subsets. The higher amplitude/phase contrast ratio for the iron core compared to the surrounding protein material limits the accuracy of the CTF correction of the micrographs. This limitation, together with the apparent polydispersity of the material, accounts for the limited resolution of the reconstructions compared to what would be expected from cryo-EM. Thus, the resolution of the reconstructions was estimated to be 17 and 13 Å for the large and small oligomer classes, respectively, using the 0.5 Fourier shell correlation criteria (31,32). However, as mentioned below, the relatively “loose” packing of trimers in the oligomers may also limit the resolution of the reconstructions. Comparison of the 2D class averages with projections of the final 3D reconstruction in the same orientations showed good agreement (Figure 4). The above-mentioned experimental limitations also prevent the resolution of any details of the iron core, apart from its size and general appearance.
Figure 1.
Examples of boxed particles used in the reconstruction. The iron core is visible as a high-density dark object inside the lighter protein density.
Figure 3.
Evaluation of the five different classes of particle size after compression in factor space, size-directed classification, and averaging. The five class averages are aligned vertically to the left (A) and horizontally at the bottom (B). They are systematically compared to each other by image subtraction (A1 — B1, A2 — B1, etc.), which illustrates the size difference between the averages. The first three class averages were considered to represent one iron core size (small), and the two remaining classes were considered to represent a second iron core size (large).
Description of Reconstructed Particles
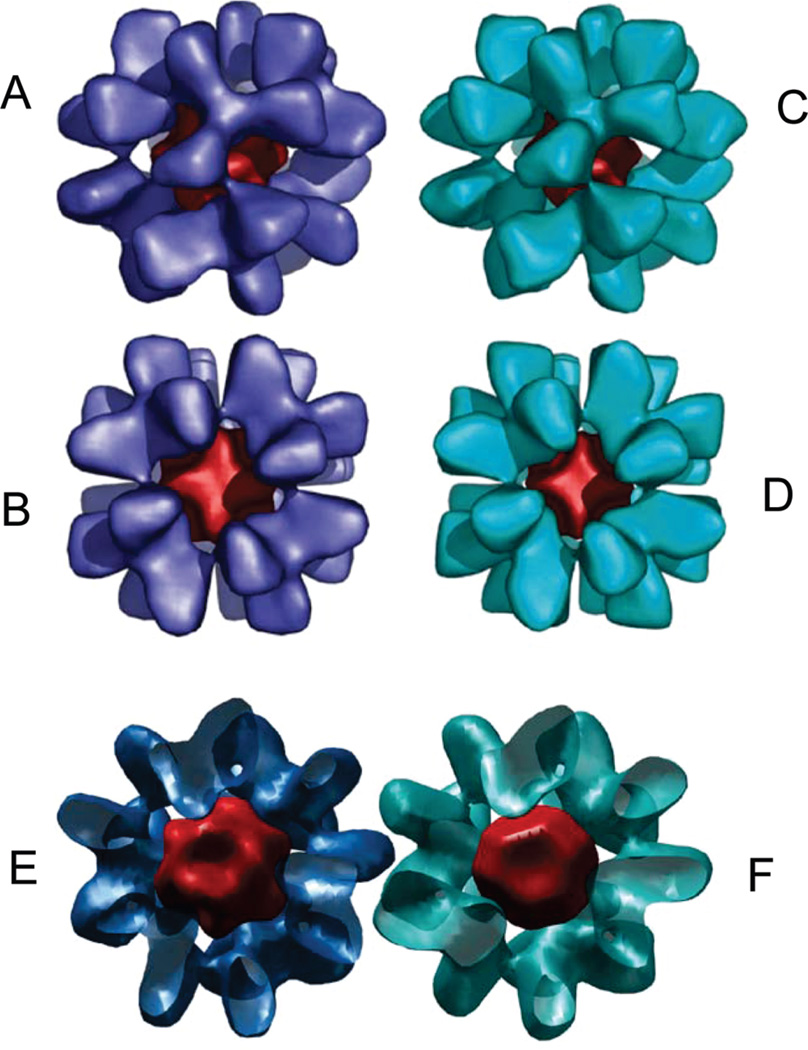
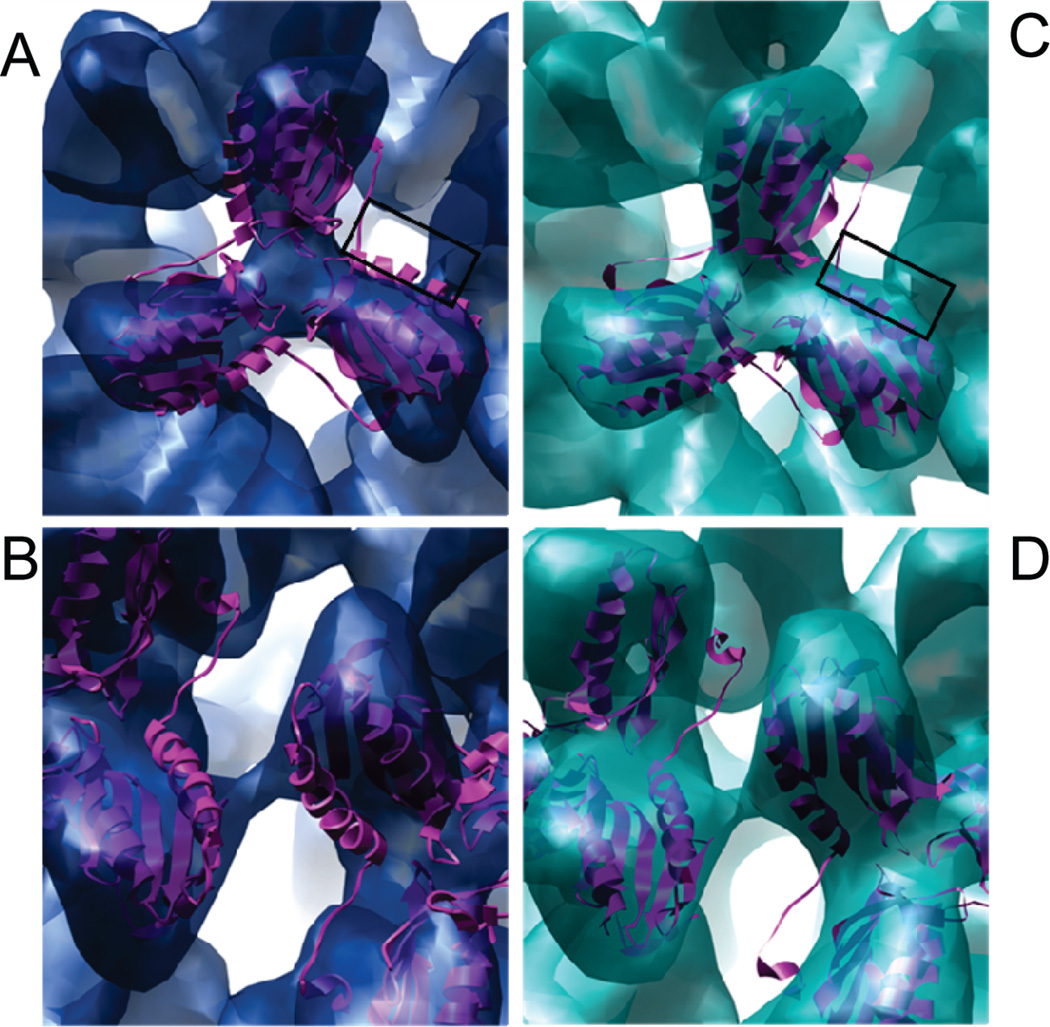
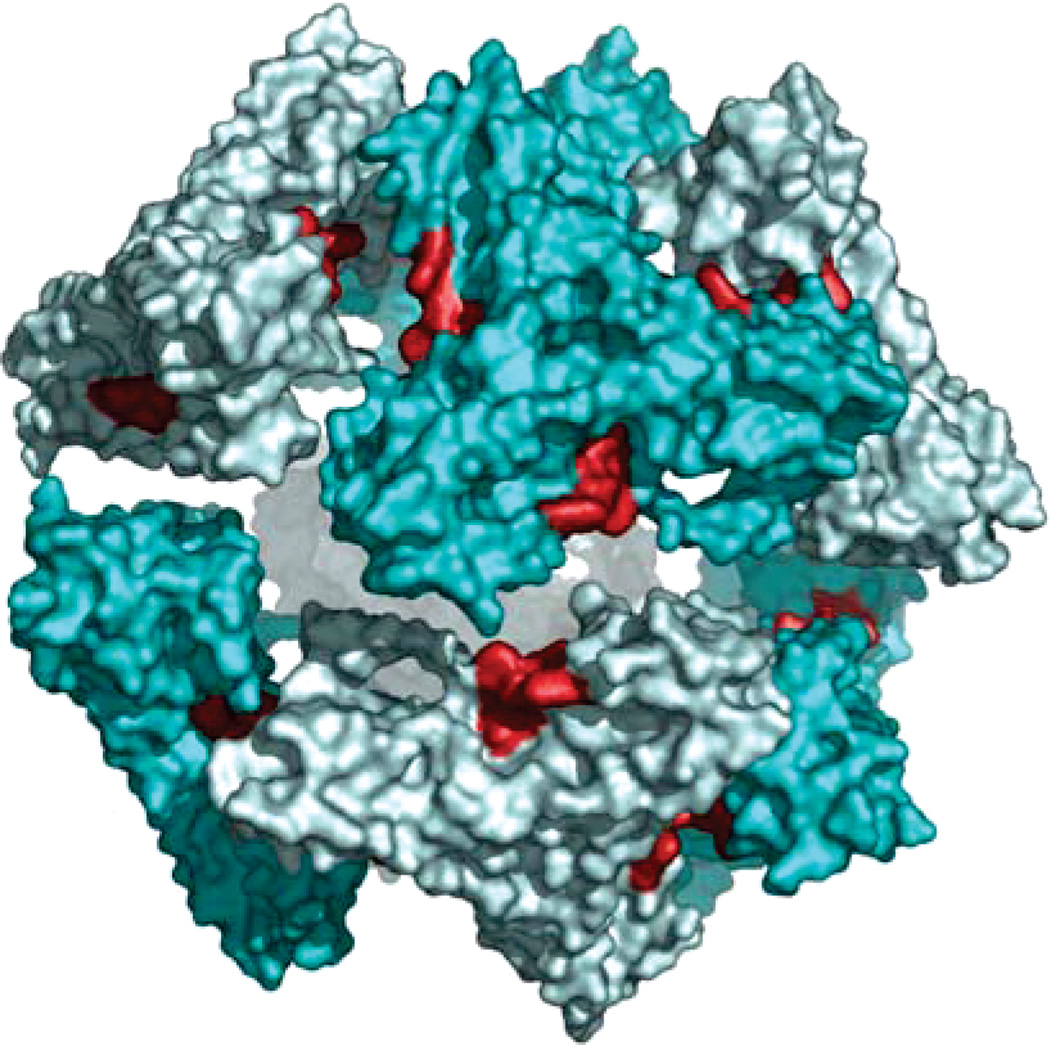
The reconstructions representing two iron-loaded Y73A yeast frataxin 24-subunit oligomers are shown in Figure 5A. It can be seen that the main difference between the two volumes is the size of the iron core, while the outer radii of the particles are essentially similar. In contrast to the previous reconstruction from negatively stained images, the present reconstructions from cryoimages clearly show separated trimers with very few contacts. This observed mode of packing of trimers would probably allow a relatively high degree of rotational freedom of the trimer, which may in turn result in breakage of the strict octahedral symmetry, thus limiting the resolution of the reconstruction. A comparison of the trimer densities from the two reconstructions shows that, at the present resolution, the structural organization of the monomers within the trimers is identical (Figure 5B). This was further confirmed by docking of the X-ray structure of a trimer into both cryo-EM reconstructions (Figure 6A,C). The trimers could be fitted into the density without any need for major adjustments of the structure. An interesting feature of the model built on the basis of this docking is the close proximity of the putative ferroxidation site of one trimer (residues H74, D78, D79, D82, and H83) to the area of the neighboring trimer, which by analogy with ferritin has been suggested to be associated with the nucleation site of the ferrihydrite mineral (residue E93) (Figures 6B,D and 7) (16,33). It can also be seen from the figures that this is the only area where the density of the reconstruction suggests close contacts.
Figure 5.
3D reconstructions of the iron-loaded 24-subunit oligomeric yeast frataxin Y73A. The dark red volume represents the iron core of the complexes. The larger reconstruction (blue) is visualized close to the 3-fold axis in (A) and along the 4-fold axis in (B). The small reconstruction (cyan) is also shown in the direction of the 3-fold axis (C) and along the 4-fold axis (D). A cross section through the large (E) and small (F) reconstructions showing the iron core (dark red) of the particles.
Figure 6.
Docking of the trimeric X-ray structure into the large (A and B) and small (C and D) iron-loaded frataxin reconstructions. (A, C) The trimer contacts are close to the ferroxidation sites (marked by a black box). (B, D) Close-up of the interface between neighboring trimers.
Figure 7.
Individually docked trimers in the small EM reconstruction visualized close to the 2-fold axis as surface renderings. The ferroxidation sites are outlined in red, revealing their proximity to the interface between the trimers.
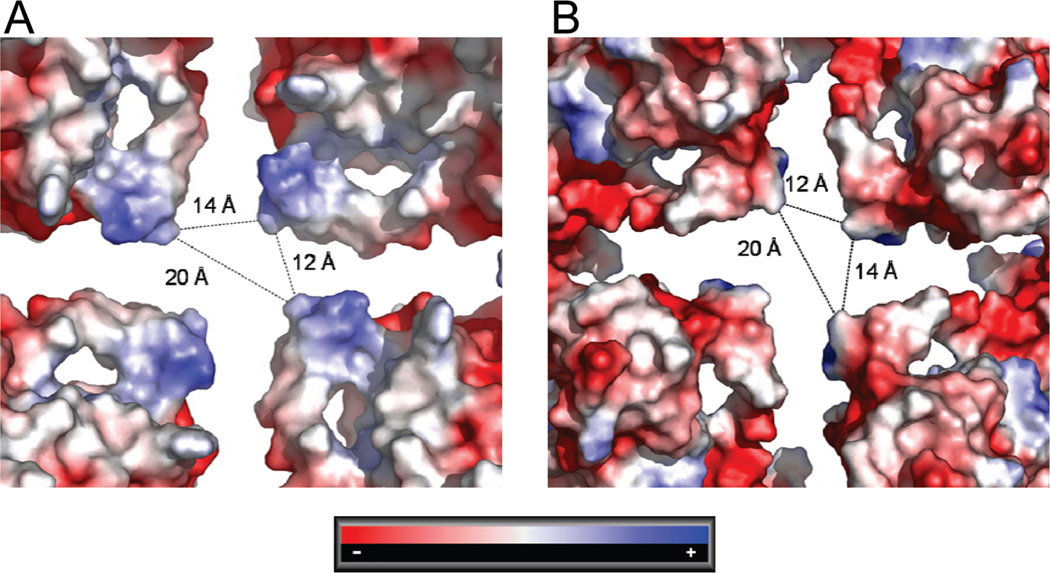
The X-ray structure of the trimer, in which the N-terminus of each monomer interacts with the neighboring monomer (16), and the packing of trimers docked into the present reconstructions strongly support earlier biochemical data on the importance of the N-terminus for trimer formation and for the stabilization of larger oligomeric frataxin structures (15). The analysis of the present reconstruction shows that the N-terminus is located very close to the pore at the 4-fold axis of the particle and, thus, may control entrance into the inner space of the particle. Although one must take into account that nine residues at the N-terminus of each monomer in the X-ray structure could not be built into the electron density due to a high degree of disorder, it still appears that the opening along the 4-fold axis is too large to allow the N-terminus to mechanically prevent any ions from entering. The surface around the pore is built up mainly by charged amino acid residues. Analysis of the electrostatic surface potential at the inner and outer sides of the protein monomers around the pore shows interesting differences: seen from the iron core, the electrostatic surface potential is positive, while on the outer surface, it is highly negative (Figure 8).
Figure 8.
Distribution of electrostatic surface potential around the 4-fold axis of symmetry of the particles. The channel is created mainly by the N-terminal α-helix. The figure shows the positive surface potential at the inside of the particle (A) and the negative surface potential at the outer surface (B). The approximate distances (in Å) between the helices from different monomers at the channel are also shown.
DISCUSSION
Previous analysis of the iron core of yeast frataxin has identified the mineral as ferrihydrite, which also constitutes the iron core of ferritin. However, these experiments suggested that in frataxin the iron core is less condensed and less well ordered (33). Thus, in the case of horse spleen ferritin high-resolution micrographs have revealed highly ordered regular lattice fringes inside the protein complex (3). The polydispersity of the iron-loaded particles of yeast frataxin, which apparently depends mainly on the size of the iron core, clearly suggests a gradual increase in the iron content of the oligomers. This is also supported by the observation that particles with very small iron cores, or even without any visible iron cores, could be found within the population (data not shown). On the other hand, the size distribution of the particles also indicates that only a small fraction of the population has reached the limit of its iron accumulation capacity. These results provide the first structural insight into the process of building up the iron core of yeast frataxin and indicate that, similar to ferritin, frataxin oligomers may be involved in iron exchange between particles. They also show that the Y73A variant of the protein, which assembles in an iron-independent fashion into 24-subunit oligomers, may acquire and store iron. It cannot be excluded that the preassembly of the particles may affect the iron-loading kinetics and capacity of the oligomers, compared to that of the native yeast frataxin. In this case, iron-loading capacity was estimated to be in the range of 50–75 iron atoms per subunit for a 48-subunit oligomer (33).
The packing of the trimers within the particles suggests that the oligomers are stabilized by weak interactions between trimers. This is in contrast to ferritin particles, which are stabilized by extensive hydrophobic and polar interactions between the individual subunits within the oligomer. This suggests that the contribution of the iron core itself to the stabilization of the particles, e.g., through interactions with the nucleation sites, may play a more important role in frataxin, as compared to ferritin (14). The arrangement of the trimers, which brings the oxidation and nucleation sites into close proximity, would allow the trimers to cooperate during iron oxidation and storage, thus facilitating the iron-dependent self-assembly of yeast frataxin. In the case of ferritin the functions of iron oxidation and nucleation are performed by the different subunits of the oligomer, H and L, respectively (3, 4).
In contrast to ferritin in which the pore at the 4-fold axis is highly hydrophobic and probably has a minor role in metal trafficking, the negative surface potential at the outer side around the pore in frataxin may allow positively charged ions to enter the core of the particle, while the positive surface potential at the inner side would prevent these ions from escaping into the mitochondrial matrix. Although the pore in frataxin seems to have a larger diameter than the pore in ferritin, large-pore ferritin oligomers have been observed in the hyperthermophilic archaeon Archaeoglobus fulgidus (34). It cannot be excluded that the surface around the pore at the 4-fold axis may also be used for binding proteins that may interact with frataxin. Thus, yeast ferrochelatase, one of the functional partners of frataxin, has a positively charged area around the porphyrin binding cleft (35). This surface could be used in interactions with the negatively charged surface around the pore of the 24-subunit frataxin particle.
Altogether, the presented results show that while there are some common features between frataxin and ferritin, such as the general symmetry of the particles, the presence of pores at the 3- and 4-fold axes of symmetry, the construction of the pore at the 3-fold axis, and charge distribution on the surface around this pore (35), there are also some marked differences. The most important among these are probably the more “loose” packing of the trimers within the oligomers and the different character of the pore at the 4-fold axis. The effect of these common features and differences on the mechanism of iron storage and detoxification by frataxin still needs to be elucidated.
Supplementary Material
Footnotes
This work was supported by grants from the Swedish Research Council to S.A.-K. and from the NIH/NIA (AG15709) and the Friedreich Ataxia Research Alliance (FARA) to G.I.
Abbreviations: ROS, reactive oxygen species; Dps, DNA binding proteins from starved cells; FRDA, Friedreich ataxia; ISC, iron—sulfur cluster; EM, electron microscopy; CTF, contrast-transfer function.
SUPPORTING INFORMATION AVAILABLE
One figure showing resolution of the reconstructions. This material is available free of charge via the Internet at http://pubs.acs.org.
REFERENCES
- 1.Kaplan J. Strategy and tactics in the evolution of iron acquisition. Semin. Hematol. 2002;39:219–226. doi: 10.1053/shem.2002.35631. [DOI] [PubMed] [Google Scholar]
- 2.Halliwell B. Superoxide-dependent formation of hydroxyl radicals in presence of iron salts—Its role in degradation of hyaluronic-acid by a superoxide-generating system. FEBS Lett. 1978;96:238–242. doi: 10.1016/0014-5793(78)80409-8. [DOI] [PubMed] [Google Scholar]
- 3.Chasteen ND, Harrison PM. Mineralization in ferritin: An efficient means of iron storage. J. Struct. Biol. 1999;126:182–194. doi: 10.1006/jsbi.1999.4118. [DOI] [PubMed] [Google Scholar]
- 4.Theil EC. Coordinating responses to iron and oxygen stress with DNA and mRNA promoters: the ferritin story. Biometals. 2007;20:513–521. doi: 10.1007/s10534-006-9063-6. [DOI] [PubMed] [Google Scholar]
- 5.Al-Karadaghi S, Franco R, Hansson M, Shelnutt JA, Isaya G, Ferreira GC. Chelatases: distort to select? Trends Biochem. Sci. 2006;31:135–142. doi: 10.1016/j.tibs.2006.01.001. [DOI] [PMC free article] [PubMed] [Google Scholar]
- 6.Bencze KZ, Kondapalli KC, Cook JD, McMahon S, Millan-Pacheco C, Pastor N, Stemmler TL. The structure and function of frataxin. Crit. Rev. Biochem. Mol. Biol. 2006;41:269–291. doi: 10.1080/10409230600846058. [DOI] [PMC free article] [PubMed] [Google Scholar]
- 7.Campuzano V, Montermini L, Molto MD, Pianese L, Cossee M, Cavalcanti F, Monros E, Rodius F, Duclos F, Monticelli A, Zara F, Canizares J, Koutnikova H, Bidichandani SI, Gellera C, Brice A, Trouillas P, DeMichele G, Filla A, DeFrutos R, Palau F, Patel PI, DiDonato S, Mandel JL, Cocozza S, Koenig M, Pandolfo M. Friedreich’s ataxia: Autosomal recessive disease caused by an intronic GAA triplet repeat expansion. Science. 1996;271:1423–1427. doi: 10.1126/science.271.5254.1423. [DOI] [PubMed] [Google Scholar]
- 8.Pandolfo M. Iron metabolism and mitochondrial abnormalities in Friedreich ataxia. Blood Cells Mol. Dis. 2002;29:536–547. doi: 10.1006/bcmd.2002.0591. [DOI] [PubMed] [Google Scholar]
- 9.Grant RA, Filman DJ, Finkel SE, Kolter R, Hogle JM. The crystal structure of Dps, a ferritin homolog that binds and protects DNA. Nat. Struct. Biol. 1998;5:294–303. doi: 10.1038/nsb0498-294. [DOI] [PubMed] [Google Scholar]
- 10.Park S, Gakh O, Mooney SM, Isaya G. The ferroxidase activity of yeast frataxin. J. Biol. Chem. 2002;277:38589–38595. doi: 10.1074/jbc.M206711200. [DOI] [PMC free article] [PubMed] [Google Scholar]
- 11.Adinolfi S, Trifuoggi M, Politou AS, Martin S, Pastore A. A structural approach to understanding the iron-binding properties of phylogenetically different frataxins. Hum. Mol. Genet. 2002;11:1865–1877. doi: 10.1093/hmg/11.16.1865. [DOI] [PubMed] [Google Scholar]
- 12.Adamec J, Rusnak F, Owen WG, Naylor S, Benson LM, Gacy AM, Isaya G. Iron-dependent self-assembly of recombinant yeast frataxin: implications for Friedreich ataxia. Am. J. Hum. Genet. 2000;67:549–562. doi: 10.1086/303056. [DOI] [PMC free article] [PubMed] [Google Scholar]
- 13.Gakh O, Adamec J, Gacy AM, Twesten RD, Owen WG, Isaya G. Physical evidence that yeast frataxin is an iron storage protein. Biochemistry. 2002;41:6798–6804. doi: 10.1021/bi025566+. [DOI] [PubMed] [Google Scholar]
- 14.Park S, Gakh O, O’Neill HA, Mangravita A, Nichol H, Ferreira GC, Isaya G. Yeast frataxin sequentially chaperones and stores iron by coupling protein assembly with iron oxidation. J. Biol. Chem. 2003;278:31340–31351. doi: 10.1074/jbc.M303158200. [DOI] [PubMed] [Google Scholar]
- 15.O’Neill HA, Gakh O, Isaya G. Supramolecular assemblies of human frataxin are formed via subunit-subunit interactions mediated by a non-conserved amino-terminal region. J. Mol. Biol. 2005;345:433–439. doi: 10.1016/j.jmb.2004.10.074. [DOI] [PubMed] [Google Scholar]
- 16.Karlberg T, Schagerlof U, Gakh O, Park S, Ryde U, Lindahl M, Leath K, Garman E, Isaya G, Al-Karadaghi S. The structures of frataxin oligomers reveal the mechanism for the delivery and detoxification of iron. Structure. 2006;14:1535–1546. doi: 10.1016/j.str.2006.08.010. [DOI] [PubMed] [Google Scholar]
- 17.Yoon T, Cowan JA. Frataxin-mediated iron delivery to ferrochelatase in the final step of heme biosynthesis. J. Biol. Chem. 2004;279:25943–25946. doi: 10.1074/jbc.C400107200. [DOI] [PubMed] [Google Scholar]
- 18.He Y, Alam SL, Proteasa SV, Zhang Y, Lesuisse E, Dancis A, Stemmler TL. Yeast frataxin solution structure, iron binding, and ferrochelatase interaction. Biochemistry. 2004;43:16254–16262. doi: 10.1021/bi0488193. [DOI] [PMC free article] [PubMed] [Google Scholar]
- 19.Bencze KZ, Yoon T, Millan-Pacheco C, Bradley PB, Pastor N, Cowan JA, Stemmler TL. Human frataxin: iron and ferrochelatase binding surface. Chem. Commun. (Cambridge) 2007:1798–1800. doi: 10.1039/b703195e. [DOI] [PMC free article] [PubMed] [Google Scholar]
- 20.Yoon T, Cowan JA. Iron-sulfur cluster biosynthesis. Characterization of frataxin as an iron donor for assembly of [2Fe-2S] clusters in ISU-type proteins. J. Am. Chem. Soc. 2003;125:6078–6084. doi: 10.1021/ja027967i. [DOI] [PubMed] [Google Scholar]
- 21.Bulteau AL, O’Neill HA, Kennedy MC, Ikeda-Saito M, Isaya G, Szweda LI. Frataxin acts as an iron chaperone protein to modulate mitochondrial aconitase activity. Science. 2004;305:242–245. doi: 10.1126/science.1098991. [DOI] [PubMed] [Google Scholar]
- 22.Gonzalez-Cabo P, Vazquez-Manrique RP, Garcia-Gimeno MA, Sanz P, Palau F. Frataxin interacts functionally with mitochondrial electron transport chain proteins. Hum. Mol. Genet. 2005;14:2091–2098. doi: 10.1093/hmg/ddi214. [DOI] [PubMed] [Google Scholar]
- 23.Sazanov LA, Hinchliffe P. Structure of the hydrophilic domain of respiratory complex I from Thermus thermophilus. Science. 2006;311:1430–1436. doi: 10.1126/science.1123809. [DOI] [PubMed] [Google Scholar]
- 24.Branda SS, Yang ZY, Chew A, Isaya G. Mitochondrial intermediate peptidase and the yeast frataxin homolog together maintain mitochondrial iron homeostasis in Saccharomyces cerevisiae. Hum. Mol. Genet. 1999;8:1099–1110. doi: 10.1093/hmg/8.6.1099. [DOI] [PubMed] [Google Scholar]
- 25.Ludtke SJ, Baldwin PR, Chiu W. EMAN: Semiautomated software for high-resolution single-particle reconstructions. J. Struct. Biol. 1999;128:82–97. doi: 10.1006/jsbi.1999.4174. [DOI] [PubMed] [Google Scholar]
- 26.White HE, Saibil HR, Ignatiou A, Orlova EV. Recognition and separation of single particles with size variation by statistical analysis of their images. J. Mol. Biol. 2004;336:453–460. doi: 10.1016/j.jmb.2003.12.015. [DOI] [PubMed] [Google Scholar]
- 27.Frank J, Radermacher M, Penczek P, Zhu J, Li YH, Ladjadj M, Leith A. SPIDER and WEB: Processing and visualization of images in 3D electron microscopy and related fields. J. Struct. Biol. 1996;116:190–199. doi: 10.1006/jsbi.1996.0030. [DOI] [PubMed] [Google Scholar]
- 28.Pettersen EF, Goddard TD, Huang CC, Couch GS, Greenblatt DM, Meng EC, Ferrin TE. UCSF Chimera—a visualization system for exploratory research and analysis. J. Comput. Chem. 2004;25:1605–1612. doi: 10.1002/jcc.20084. [DOI] [PubMed] [Google Scholar]
- 29.DeLano WL. The PyMOL Molecular Graphics System. San Carlos, CA: DeLano Scientific; 2002. [Google Scholar]
- 30.White HE, Saibil HR, Ignatiou A, Orlova EV. Recognition and separation of single particles with size variation by statistical analysis of their images. J. Mol. Biol. 2004;336:453–460. doi: 10.1016/j.jmb.2003.12.015. [DOI] [PubMed] [Google Scholar]
- 31.Böttcher B, Wynne SA, Crowther RA. Determination of the fold of the core protein of hepatitis B virus by electron cryomicroscopy. Nature. 1997;386:88–91. doi: 10.1038/386088a0. [DOI] [PubMed] [Google Scholar]
- 32.Malhotra A, Penczek P, Agrawal RK, Gabashvili IS, Grassucci RA, Junemann R, Burkhardt N, Nierhaus KH, Frank J. Escherichia coli 70 S ribosome at 15 angstrom resolution by cryo-electron microscopy: Localization of fMet-tRNA(f)(Met) and fitting of L1 protein. J. Mol. Biol. 1998;280:103–116. doi: 10.1006/jmbi.1998.1859. [DOI] [PubMed] [Google Scholar]
- 33.Nichol H, Gakh O, O’Neill HA, Pickering IJ, Isaya G, George GN. Structure of frataxin iron cores: An X-ray absorption spectroscopic study. Biochemistry. 2003;42:5971–5976. doi: 10.1021/bi027021l. [DOI] [PubMed] [Google Scholar]
- 34.Johnson E, Cascio D, Sawaya MR, Gingery M, Schroder I. Crystal structures of a tetrahedral open pore ferritin from the hyperthermophilic archaeon Archaeoglobus fulgidus. Structure. 2005;13:637–648. doi: 10.1016/j.str.2005.01.019. [DOI] [PubMed] [Google Scholar]
- 35.Karlberg T, Lecerof D, Gora M, Silvegren G, Labbe-Bois R, Hansson M, Al-Karadaghi S. Metal binding to Saccharomyces cerevisiae ferrochelatase. Biochemistry. 2002;41:13499–13506. doi: 10.1021/bi0260785. [DOI] [PubMed] [Google Scholar]
Associated Data
This section collects any data citations, data availability statements, or supplementary materials included in this article.


