

Abstract
The creation of smart, self-assembling materials that undergo morphological transitions in response to specific physiological environments can allow for the enhanced accumulation of imaging or drug delivery agents based on differences in diffusion kinetics. Here, we have developed a series of self-assembling peptide amphiphile molecules that transform either isolated from molecules or spherical micelles into nanofibers when the pH is slightly reduced from 7.4 to 6.6, in isotonic salt solutions that simulate the acidic extracellular microenvironment of malignant tumor tissue. This transition is rapid and reversible, indicating the system is in thermodynamic equilibrium. The self-assembly phase diagrams show a single-molecule-to-nanofiber transition with a highly concentration-dependent transition pH. However, addition of a sterically bulky Gd(DO3A) imaging tag on the exterior periphery shifts this self-assembly to more acidic pH values and also induces a spherical micellar morphology at high pH and concentration ranges. By balancing the attractive hydrophobic and hydrogen-bonding forces, and the repulsive electrostatic and steric forces, the self-assembly morphology and the pH of transition can be systematically shifted by tenths a pH unit.
There has been much interest in understanding the influence of size, shape, and mechanical properties of nanomaterials on their biodistribution, to design more effective drug delivery and imaging agents. For example, the enhanced permeation and retention of spherical materials with 20–200 nm diameters in the leaky, non-lymphatic vasculature of tumor tissue has ultimately led to the development of FDA-approved liposomal therapies.1 More recently, the size and shape of nanomaterials has been found to play a significant role in the distribution and circulation lifetimes of these objects when delivered intraveneously.2 For example, cylindrical polymeric micelles have been shown to have a 10 times longer circulation time in the bloodstream compared to their spherical counterparts.2a Still, most of these materials tend to be either static objects that do not transform in the cancer environment or carriers that fragment into smaller objects to release cargo when they get to the target.3
Designing nanomaterials that can spontaneously change shape and size in response to specific physiological stimuli has the potential to exploit the differential diffusion kinetics to amplify the accumulation of these agents. For cancer, one particularly attractive stimulus is the slightly acidic extracellular microenvironment of tumor tissue (pH 6.6–7.4)4 that arises due to the enhanced rate of glycolysis.5 There are numerous examples of materials that incorporate acid-cleavable linkages that degrade under the lysosomal (pH 5.0–5.5) or the slightly acidic tumor environment to release cargo;3,6 however, there are far fewer examples of materials that reversibly transform to larger, more slowly diffusing morphologies in response to the extracellular cancer pH. Creating a material that, upon reaching the acidic extracellular tumor environment, transforms into a bulky, more slowly diffusing object could serve as a novel mechanism for achieving a higher relative concentration of imaging, drug delivery, or radiotherapeutic agent at the tumor site compared to the bloodstream. Although a multitude of self-assembling materials have pH-dependent assembly behavior, there are very few biologically compatible systems designed for in vivo use, with assembly behavior that can be reversibly triggered at neutral pH values (6.6–7.4) in an ionic environment that resembles serum. Both the concentration and the valency of the ionic environment play key roles in mediating the self-assembly of charged systems.7 Thus, developing systems that function under the stringent set of conditions for in vivo use requires considerable insight and optimization.
To develop materials capable of reversible pH-triggered morphological changes, we sought to design amphiphilic molecules that would exist as either single molecules or spherical micelles under normal physiological conditions (pH 7.4) and would self-assemble into nanofibers upon encountering the acidic environment (pH 6.6) of the tumor vasculature (Figure 1). Peptide amphiphiles (PAs, Chart 1) are an attractive class of molecules in this regard since they are biocompatible, can spontaneously self-assemble into a variety of morphologies, and have intermolecular forces that can be precisely tuned with the peptide sequence.8 Our PA molecules consist of three main segments: a hydrophobic alkyl tail, a β-sheet-forming peptide sequence, and a charged amino acid sequence. Decreasing the repulsive interaction of the charged region either via electrostatic screening or by lowering the degree of side-chain ionization with pH induces assembly into nanofibers. For instance, it was recently shown that upon addition of 5 mM Ca2+, a specific peptide amphiphile (palmitoyl-VVAAEEEEGIKVAV) underwent a spherical-to-nanofiber transition at pH 7.4.8d From this observation, we reasoned that, by balancing the relative attractive and repulsive forces via the peptide sequence, it would be possible to enable the transition to occur at the desired pH in physiological salt concentrations.
Figure 1.
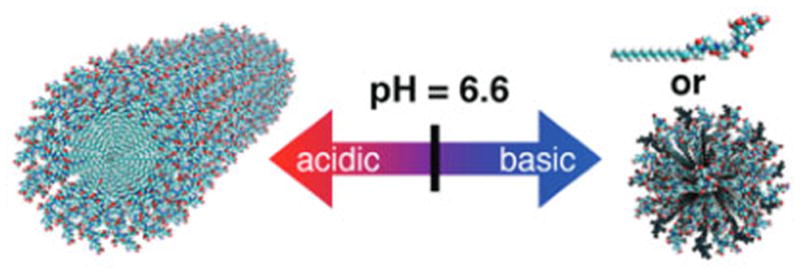
Schematic of the target reversible, pH-triggered morphological transition of self-assembling peptide amphiphiles.
Chart 1.
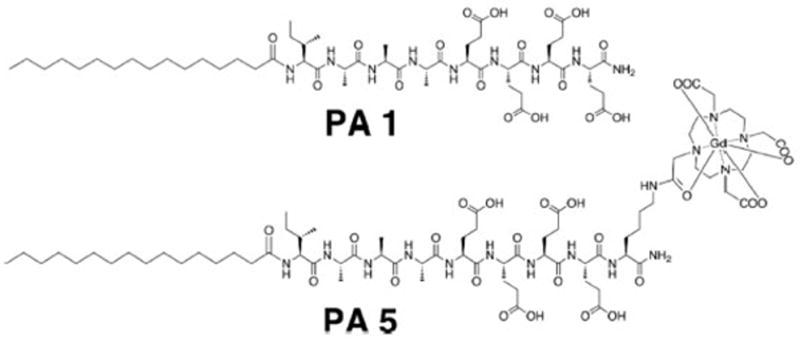
PA Structure and Design
Herein, we have developed a PA design strategy for tuning the pH at which the self-assembly transition into nanofibers occur by tenths of a pH unit, in simulated serum salt solutions (150 mM NaCl, 2.2 mM CaCl2) at 10 μM PA.9 As one of our eventual goals is to develop Gd3+-based magnetic resonance imaging agents, 10 μM is the minimum diagnostic concentration of these agents in blood.10 The PAs in this study contain a palmitic acid tail, an XAAA β-sheet-forming region, where X is an amino acid with a nonpolar side chain, and four glutamic acid residues (Table 1). A ratio of one strongly hydrophobic amino acid (tyrosine (Y), valine (V), phenylalanine (F), or isoleucine (I)) to four glutamic acids was essential to enable this transition in the desired pH range of 6.0–6.6. PAs were synthesized by solid-phase Fmoc synthesis and purified by reverse-phase high-performance liquid chromatography (HPLC) (SI-1). Their purity was assessed using analytical HPLC, electrospray ionization mass spectrometry (ESI-MS), and peptide content analysis (SI-1, SI-2).
Table 1.
Synthesized PA Molecules
| molecule | sequence |
|---|---|
| PA1 | palmitoyl-IAAAEEEE-NH2 |
| PA2 | palmitoyl-FAAAEEEE-NH2 |
| PA3 | palmitoyl-VAAAEEEE-NH2 |
| PA4 | palmitoyl-YAAAEEEE-NH2 |
| PA5 | palmitoyl-IAAAEEEEK(DO3A:Gd)-NH2 |
| PA6 | palmitoyl-VAAAEEEEK(DO3A:Gd)-NH2 |
Our target PA concentration (10 μM) is below the detectable limit of conventional techniques to determine the morphology such as cryoTEM and small-angle X-ray scattering. Consequently, circular dichroism (CD) spectroscopy was initially used to characterize the morphology of these PAs at various pH values. PA1 was the first molecule synthesized that underwent a self-assembly transition in our desired pH range of 6.6–7.4 at 10 μM PA in 150 mM NaCl and 2.2 mM CaCl2 (SI-3).8d The secondary structure exhibited a superimposable random coil morphology at pH > 6.82. At more acidic pH, the peptides start self-assembling into a structure with β-sheet character, which is indicative of a nanofiber morphology.8d The transition pH from random coil to β-sheet occurred at pH 6.6. We defined the transition pH to be the value at which the ellipticity at 205 nm rises to zero, followed by the appearance of a minimum at 218–220 nm.
The transition between random coil and β-sheet structure was rapid and reversible. At pH 7.75, HCl was added until the pH was 6.1, and the resulting β-sheet CD spectrum was collected within 3 min. An appropriate amount of NaOH was then added to reverse the pH back to 7.70, and random coil behavior was observed again. This process was repeated three times, and the CD spectra were found to be superimposable with respect to pH (SI-3), indicating that this self-assembly transition occurs under thermodynamic equilibrium and requires 3 min or less to achieve the expected morphology. Conventional transmission electron microscopy (TEM) imaging was used to determine the morphology of 10 μM PA1 at pH 6 and 8 (SI-4). The TEM grids were prepared within 3 min of pH adjustment. At pH 6, both individual and bundled fibers were present but dilute, and the isolated fibers had an average length of 590 ± 200 nm and an average diameter of 9.1 ± 1.5 nm. This fiber diameter corresponds to roughly twice the molecular length from MM+ molecular simulations, corresponding approximately to the expected diameter of cylindrical fibers consisting of hydrophobically collapsed β-sheets. At pH 8, no fibers were present, confirming that the β-sheet character corresponds to the existence of fibers.
When the CD spectra show a random coil morphology, the PA molecules could either be self-assembled into spherical micelles or exist as isolated molecules in solution.8d Because it is difficult to distinguish between staining artifacts and sample with TEM imaging at such a low concentration of sample, to determine the morphology under basic pH values, the critical aggregation concentration (CAC) was measured for PA1 at pH 6.6 using the pyrene 1:3 method (SI-3).11 The CAC was found to be 6.0 μM, which is slightly below the 10 μM concentration at which the CD spectrum was obtained. These two values are in relative agreement considering the arbitrary nature of defining the transition pH from the CD spectrum. Thus, the random coil behavior corresponds to isolated molecules in solution, as opposed to a spherical micellar morphology.
To determine the overall influence of concentration and pH on the nature of this self-assembly transition, CAC measurements were performed at pH 4.0–10.0 (SI-5), and CD spectra were collected at 10–30 μM concentrations (SI-6). The transition points determined from both techniques were plotted to generate a concentration–pH self-assembly phase diagram (Figure 2c). PA1 exhibited a strong dependence on both concentration and pH in the self-assembly transition. This concentration dependence was further confirmed via conventional TEM imaging. At pH 6.0 and 10.0, both isolated and bundled nanofibers were observed in samples prepared at 0.5 mM concentration (Figure 2a,b). At pH 6.0 and 10.0, the isolated nanofibers had average diameters of 9.4 ± 1.1 and 9.5 ± 1.2 nm, respectively.
Figure 2.
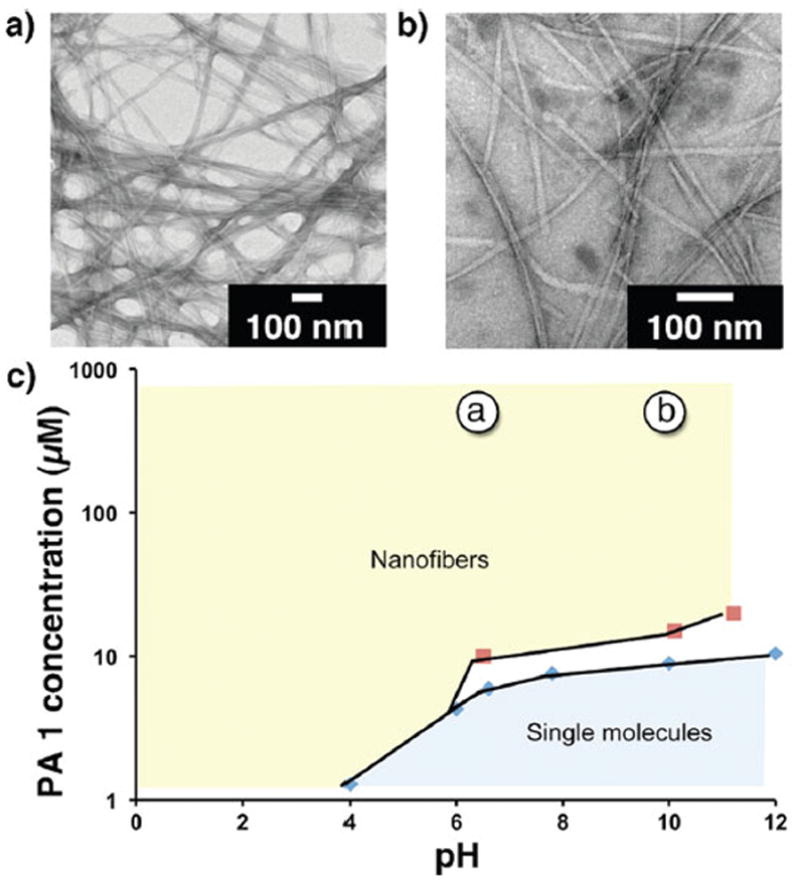
TEM images of 0.5 mM of PA1, measured pH (a) 6.0 and (b) 10.0. (c) Concentration–pH self-assembly phase diagram of PA1 as determined via CAC (blue diamonds) and CD (red squares) measurements. All samples were prepared in 150 mM NaCl and 2.2 mM CaCl2. The concentration and pH values at which the TEM images were obtained are labeled in (c). The white area corresponds to a region where the self-assembled morphology is uncertain due to the lack of suitable experimental techniques.
By varying the β-sheet propensity of the amino acids in the β-sheet-forming region, the transition pH can be systematically tuned. In PA2–PA4, the isoleucine of PA1 was substituted with the hydrophobic amino acids phenylalanine, valine, and tyrosine. pH-dependent CD spectra of PA2–PA4 at 10 μM also show a β-sheet-to-random coil transition at pH 6.0–6.6 (SI-7). Similar to PA1, this transition was observed to be reversible (SI-8). Previous studies have shown that the propensity for β-sheet formation of these amino acids follows the trend I > F > V > Y.12 In PA1–PA4, the transition pH shifts to lower values with decreasing β-sheet propensity of the substituted hydrophobic amino acid (Table 2). The average pKa values for the glutamic acid residues in each molecule were determined from pH titration curves (Table 2) to be in the range 4.66–4.94, with no specific correlation with the hydrophobicity of the peptide (SI-9). Therefore, the difference in self-assembly pH is not due to changes in the pKa of the glutamic acid side chains. Rather, the transition is determined by the balance between the relative attractive forces of the β-sheet-forming and hydrophobic regions, and the repulsive forces of the deprotonated glutamic acids in the peptide. With a stronger β-sheet-forming segment, the transition shifts to more basic pH. For PA1 and PA4, the transition at 10 μM occurred when 98.8% and 91%, respectively, of the glutamic acids were deprotonated.
Table 2.
CD Transition pH and pKa for PA1–PA4a
| molecule | CD transition pH | average pKa |
|---|---|---|
| PA1 | 6.6 | 4.66 ± 0.10 |
| PA2 | 6.6 | 4.94 ± 0.09 |
| PA3 | 6.2 | 4.86 ± 0.11 |
| PA4 | 6.0 | 4.70 ± 0.10 |
For 10 μM PA1–PA4, measured in 150 mM NaCl and 2.2 mM CaCl2.
We then incorporated an MRI imaging moiety on the C-terminus of the PA. An additional lysine, conjugated to a 1,4,7-tris(carboxymethylaza)cyclododecane-10-azaacetylamide (DO3A) tag was linked to the C-terminus of PA1 and P3 to produce PA5 and PA6. The molecule-to-nanofiber transition was still observed at 10 μM PA; however, the transition pH of PA5 was shifted to 5.7 (SI-10). Since this imaging moiety does not add excess charge, this shift toward more acidic pH is likely due to the greater steric hindrance and additional hydrophilicity of DO3A restricting the formation of the self-assembled state.
The concentration–pH self-assembly phase diagram was mapped out for PA5 (Figure 3c). Under basic conditions and above the CAC, a random coil secondary structure was observed in the CD spectra, which is indicative of self-assembly into a spherical micelle phase. The transition from nanofibers to spherical micelles was confirmed via TEM imaging at 0.5 mM PA at pH 4 and 10, respectively (Figure 3a,b). The nanofibers and spherical micelles had diameters of 11.9 ± 1.6 and 10.0 ± 1.2 nm, respectively. In contrast to the nanofiber-to-molecule transition, the pH for the nanofiber-to-micelle transition showed relatively little concentration dependence. The nanofiber-to-micelle transitions at 0.5 mM and 20 μM PA occurred at pH 6.0 and 5.7, respectively (SI-11). The steric bulk of the DO3A moiety increases the headgroup size of PA5 relative to PA1, thus inducing the spherical self-assembly morphology.13
Figure 3.
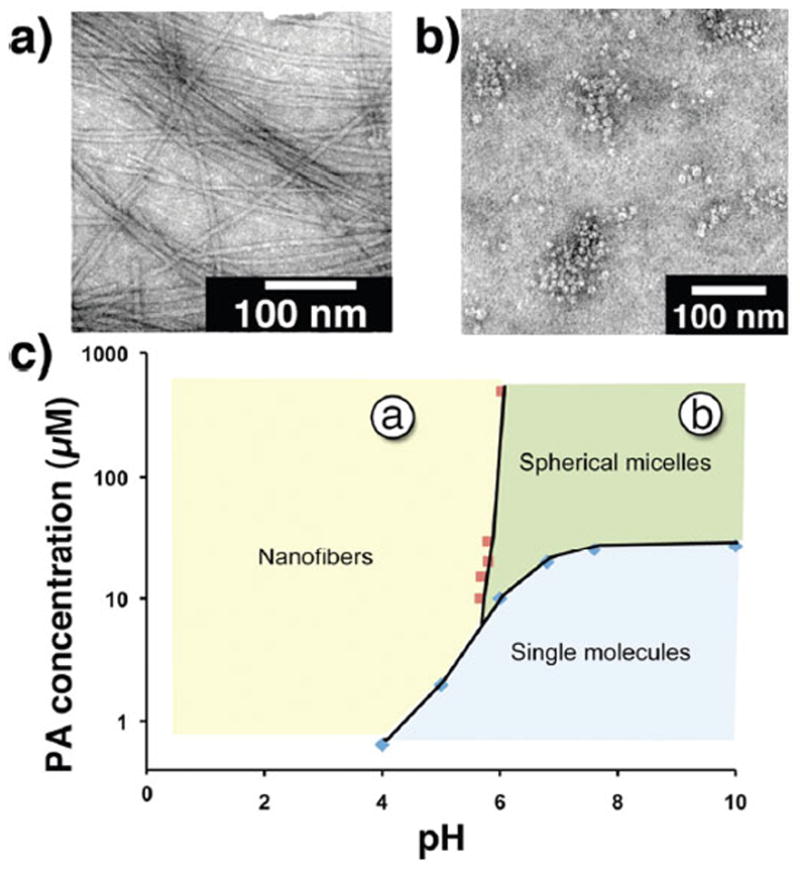
TEM images of 0.5 mM of PA5, measured at pH (a) 4.0 and (b) 10.0. (c) Concentration–pH self-assembly phase diagram of PA5 as determined via CAC (blue diamonds) and CD (red square) measurements. All samples were prepared in 150 mM NaCl and 2.2 mM CaCl2. The concentration and pH values at which the TEM images were obtained are labeled in (c).
The shift in transition pH due to the change in β-sheet propensity still occurs when the Gd(DO3A) moiety is present. For each concentration, PA6 had a nanofiber-to-micelle transition that occurred 0.4 unit lower than for PA5 (SI-12). Because the same trend occurs in these PAs irrespective of the presence of a Gd(DO3A) moiety, this strategy of altering the β-sheet propensity can be generally used to systematically shift the transition pH.
Relaxivity values of water protons in the presence of PA5 at 500 μM, at pH of 4 and 10, were found to be 8.3 and 6.6 mM−1 s−1, respectively, using a 1.5 T magnet. These values were higher than those measured for a Magnevist control standard (4.5 mM−1 s−1).14 This relaxivity increase from spherical micelles to nanofibers likely originates from the longer rotational correlation time when imaging agents are coupled to large molecular weight objects, which has been well-established for magnetic resonance agents coupled to polymers and peptide amphiphiles.15 The relaxivity of these systems is about 25–50% lower than that of other supramolecular assemblies with similar K(DO3A:Gd) linkages.15a,16 This suggests that the Gd(DO3A) motion is independently faster than that of the nanofiber due to the conformationally flexible E4K tether, which can be further optimized. Regardless, the primary mechanism for tumor imaging relies on the increased local concentration of the more slowly diffusing nanofibers in the tumor environment compared to the bloodstream, but the improved relaxivity of fibers compared to spheres could serve as a secondary mechanism for enhanced tumor detection.
In summary, we have shown that, through judicious design, it is possible to use the power of self-assembly to develop dynamic materials that change shape and size in response to slight changes in pH, in solutions that have monovalent and divalent ion concentrations similar to those of serum. This morphological change is rapid and reversible and occurs under thermodynamic equilibrium, which is ideal for in vivo imaging and drug delivery applications. Although further optimization of the spherical-to-nanofiber transition pH is required for in vivo MRI applications, the molecules presented here outline a design strategy for precisely tuning self-assembly behavior.
Supplementary Material
Acknowledgments
We thank N. Raju and K. Kumar for helpful discussions. TEM images presented in this report were generated using the instruments and services at the Campus Microscopy and Imaging Facility at The Ohio State University. J.G. thanks The Ohio State University Research Foundation, and M.T. thanks the Stefanie Spielman Foundation for financial support.
Footnotes
Notes
The authors declare no competing financial interest.
Experimental methods, materials, and synthesis schemes; HPLC chromatagrams, ESI-MS spectra, CD spectra, pH titration curves, and CAC determination for relevant PAs. This material is available free of charge via the Internet at http://pubs.acs.org.
References
- 1.(a) Torchilin VP. Nat Rev Drug Discov. 2005;4:145. doi: 10.1038/nrd1632. [DOI] [PubMed] [Google Scholar]; (b) Matsumura Y, Maeda H. Cancer Res. 1986;46:6387. [PubMed] [Google Scholar]
- 2.(a) Geng Y, Dalhaimer P, Cai S, Tsai R, Tewari M, Minko T, Discher DE. Nat Nanotech. 2007;2:249. doi: 10.1038/nnano.2007.70. [DOI] [PMC free article] [PubMed] [Google Scholar]; (b) Petros RA, DeSimone JM. Nat Rev Drug Discov. 2010;9:615. doi: 10.1038/nrd2591. [DOI] [PubMed] [Google Scholar]; (c) Yoo JW, Irvine DJ, Discher DE, Mitragotri S. Nat Rev Drug Discov. 2011;10:521. doi: 10.1038/nrd3499. [DOI] [PubMed] [Google Scholar]; (d) Popovic Z, Liu W, Chauhan VP, Lee J, Wong C, Greytak AB, Insin N, Nocera DG, Fukumura D, Jain RK, Bawendi MG. Angew Chem, Int Ed. 2010;49:8649. doi: 10.1002/anie.201003142. [DOI] [PMC free article] [PubMed] [Google Scholar]
- 3.Torchilin VP. Pharm Res. 2007;24:1. doi: 10.1007/s11095-006-9132-0. [DOI] [PubMed] [Google Scholar]
- 4.Gatenby RA, Gillies RJ. Nat Rev Cancer. 2004;4:891. doi: 10.1038/nrc1478. [DOI] [PubMed] [Google Scholar]
- 5.Hanahan D, Weinberg RA. Cell. 2011;144:646. doi: 10.1016/j.cell.2011.02.013. [DOI] [PubMed] [Google Scholar]
- 6.Sawant RM, Hurley JP, Salmaso S, Kale A, Tolcheva E, Levchenko TS, Torchilin VP. Bioconjugate Chem. 2006;17:943. doi: 10.1021/bc060080h. [DOI] [PMC free article] [PubMed] [Google Scholar]
- 7.Hiemenz PC, Rajagopalan R. Principles of Colloid and Surface Chemistry. 3. Marcel Dekker; New York: 1997. [Google Scholar]
- 8.(a) Cui H, Webber MJ, Stupp SI. Biopolymers. 2010;94:1. doi: 10.1002/bip.21328. [DOI] [PMC free article] [PubMed] [Google Scholar]; (b) Missirlis D, Chworos A, Fu CJ, Khant HA, Krogstad DV, Tirrell M. Langmuir. 2011;27:6163. doi: 10.1021/la200800e. [DOI] [PMC free article] [PubMed] [Google Scholar]; (c) Paramonov SE, Jun HW, Hartgerink JD. J Am Chem Soc. 2006;128:7291. doi: 10.1021/ja060573x. [DOI] [PubMed] [Google Scholar]; (d) Goldberger JE, Berns EJ, Bitton R, Newcomb CJ, Stupp SI. Angew Chem, Int Ed. 2011;50:6292. doi: 10.1002/anie.201100202. [DOI] [PMC free article] [PubMed] [Google Scholar]
- 9.Porter RS, Kaplan JL, editors. The Merck Manual of Diagnosis and Therapy. 19. Merck Publishing Group; Rahway, NJ: 2011. [Google Scholar]
- 10.(a) Nunn AD, Linder KE, Tweedle MF. Q J Nucl Med. 1997;41:155. [PubMed] [Google Scholar]; (b) Wedeking P, Shukla R, Kouch YT, Nunn AD, Tweedle MF. Magn Reson Imag. 1999;17:569. doi: 10.1016/s0730-725x(98)00203-3. [DOI] [PubMed] [Google Scholar]
- 11.Aguiar J, Carpena P, Molina-Bolivar JA, Ruiz CC. J Colloid Interface Sci. 2003;258:116. [Google Scholar]
- 12.Kim CA, Berg JM. Nature. 1993;362:267. doi: 10.1038/362267a0. [DOI] [PubMed] [Google Scholar]
- 13.Israelachvili JN. Intermolecular and Surface Forces. 2. Academic Press; San Diego, CA: 1992. [Google Scholar]
- 14.(a) Stanisz GJ, Henkelman RM. Magn Reson Med. 2000;44:665. doi: 10.1002/1522-2594(200011)44:5<665::aid-mrm1>3.0.co;2-m. [DOI] [PubMed] [Google Scholar]; (b) Sasaki M, Shibata E, Kanbara Y, Ehara S. Magn Res Med Sci. 2005;4:145. doi: 10.2463/mrms.4.145. [DOI] [PubMed] [Google Scholar]
- 15.(a) Bull SR, Guler MO, Bras RE, Meade TJ, Stupp SI. Nano Lett. 2005;5:1. doi: 10.1021/nl0484898. [DOI] [PubMed] [Google Scholar]; (b) Bull SR, Guler MO, Bras RE, Venkatasubramanian PN, Stupp SI, Meade TJ. Bioconjugate Chem. 2005;16:1343. doi: 10.1021/bc050153h. [DOI] [PubMed] [Google Scholar]; (c) Nicolle GM, Toth E, Eisenwiener KP, Macke HR, Merbach AE. J Biol Inorg Chem. 2002;7:757. doi: 10.1007/s00775-002-0353-3. [DOI] [PubMed] [Google Scholar]
- 16.Accardo A, Tesauro D, Aloj L, Pedone C, Morelli G. Coord Chem Rev. 2009;253:2193. [Google Scholar]
Associated Data
This section collects any data citations, data availability statements, or supplementary materials included in this article.