

Abstract
There is not any method to measure metatarsal protrusion in the whole metatarsal. The aim of this research is to know the normal metatarsal parabola in male and female feet. The system of measurement devised by Hardy and Clapham to evaluate the protrusion between metatarsals I and II was adapted to study the whole metatarsal parabola and applied to the five metatarsals of 169 normal feet, 72 female feet and 97 male feet. Authors measured all metatarsal protrusion relative to metatarsal II. The results obtained show a female metatarsal protrusion relative to metatarsal II of +1.27% for metatarsal I, −3.36% for metatarsal III, −8.34% for metatarsal IV, and −15.54% for metatarsal V. Data obtained for male metatarsal parabola were +0.5% for metatarsal I, −3.77 for metatarsal III, −9.57 for metatarsal IV, and −17.05 for metatarsal V. Differences between both metatarsal parabola were significant.
1. Introduction
The metatarsal parabola has been the object of study by various authors [1]. Most of the studies published on the values of metatarsal protrusion refer exclusively to the relationship between metatarsals I and II, using the distance (expressed in mm) between the tangents to the two metatarsal heads as protrusion value. These works include those of Morton [2], Harris and Beath [3, 4], Hardy and Clapham [5], and LaPorta et al. [6], in which the different authors cite various systems for measuring metatarsal I-II protrusion and establish various values of normality. Valley and Reese [7] designed three different systems of measurement to evaluate the protrusion of the lesser metatarsals, although none of them independently achieved complete analysis of the metatarsal parabola.
On the other hand, anthropometric differences cited by various authors regarding the alignment of the lower extremity suggest the need to compare the mean values of the metatarsal arch in men and women. Testud and Latarjet [8] established 16 differences between the pelvis in men and women, such as differences in the cervicodiaphyseal angle of the femur. There are also references concerning the difference of angulation of femoral anteversion [9–11] and of physiological genu valgo depending on gender [12–14]. With regard to the foot, significant differences were found by Steele [15] in the size of astragalus and calcaneus, by Smith [16] in the size of metatarsals and toes, and by Ferrari et al. [17] in the orientation of the first ray in the transverse plane.
Gender-dependent differences have been described regarding the functionality of the lower extremity. Staheli et al. [18] found significant differences in the internal rotation of the hip, the internal rotator pattern [19], and the angle of gait [20–25], and even in plantar pressures during gait [26, 27].
The aims of the present study were (1) to obtain the mean values of metatarsal protrusion—with respect to metatarsal II—for all the metatarsals, using the method described by Hardy and Clapham, (2) to compare the mean values of metatarsal protrusion obtained with that system between men and women, and (3) to evaluate the reliability of the radiological measurements, made using computer programs. These values are important to understand the biomechanics of the forefoot and to know the normal shape and function of the foot on orthopedics and surgery treatments.
2. Materials and Methods
This one is an observational research, to measure metatarsal protrusion in male and female feet and state normal values.
Dorsoplantar radiographic plates, made under load with a focal inclination of 15° with respect to vertical, are used. The study consists of 169 feet (87 right feet and 82 left feet; 72 female feet and 97 male feet) of 105 volunteers (63 men and 42 women), podiatry students at Seville University. In several cases only one foot was used. All subjects provided written consent.
The criteria for inclusion were as follows: more than 20 years old, without deformities of the forefoot (HL, extension MTF I > 65°; HAV, claw toes, etc.), without degenerative osteoarticular disease or muscular imbalance, without signs of alterations in the forefoot load distribution, with absence of foot pain, without previous surgery of the foot, and without trauma to the foot in the previous 12 months.
The mean age of the subjects taking part in the study was 23.6 ± 2.7 years old, with no subject being under 20 years old (and the skeleton of the foot still developing).
The radiological plates were scanned using a radiological scanner and digitized, and radiological measurements were made with the program AUTOCAD 2006.
The metatarsal protrusion is measured using the method Hardy and Clapham [5] described to determine MTT I-II protrusion, applying it in our case to the rest of the metatarsals. This consists of determining the protrusion of MTT I, III, IV, and V relative to the length of MTT II. We use MTT II as reference for various reasons:
it is considered the longitudinal axis of the metatarsus, commonly used as a reference for different radiological measurements of the forefoot [28].
Due to the conformation of the second metatarsocuneiform joint, the fit of the metatarsal between the first and third cuneiforms, and the resulting limitation to the mobilization of this joint, it is the most stable metatarsal, with little capacity to become malaligned, affecting its protrusion.
It is not affected by brachymetatarsia usually [29]. Brachymetatarsia is an abnormal shortness of the metatarsals that can affect any of the five metatarsal, but the one most frequently involved is the 4th. The deformity is not very common, and its incidence has been determined as between 1 in 1820 and 1 in 4586 of the population [29].
Firstly, we trace the transverse axis of the tarsus, with a line joining the most posterior point of the scaphoid tubercle with the posterior surface of the proximal articular facet of the cuboid.
We use the intersection between the diaphyseal axis of MTT II and the transverse axis of the tarsus as point of rotation to project the tangent to the metatarsal heads on the axis of ray II (Figure 1).
Figure 1.
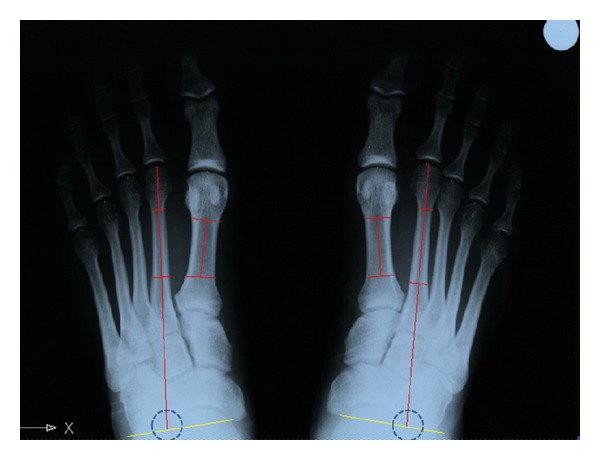
The intersection between the diaphyseal axis of MTT II and the transverse axis of the tarsus was considered as point of rotation to project the tangent to the metatarsal heads.
The distances between the arcs of circumference tangent to the most distal points of the metatarsal heads are expressed as percentage of the distance between the most distal point of the head of MTT II and the line of the transverse axis of the tarsus (ray II length) (Figure 2).
Figure 2.
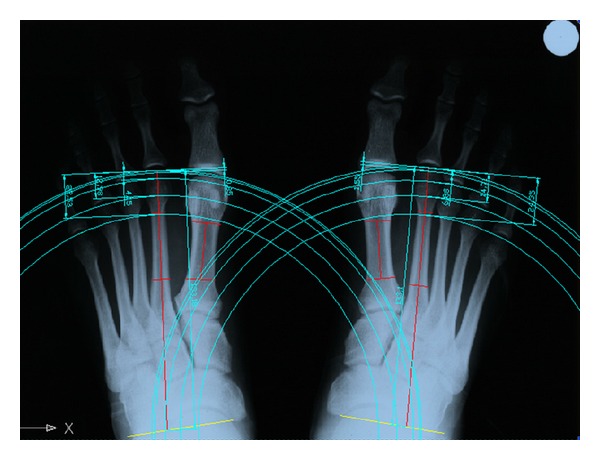
Values of metatarsal protrusion was measured as the distances between the arcs of circumference tangent to the most distal points of each metatarsal head and the most distal point of the head of MTT II.
The diaphyseal axes were traced as indicated by Coughlin et al. [30], using the midpoints of the proximal and distal metaphyseal zones, in an area between 0.5 and 1 cm from the articular surface in the case of the phalanges, and between 1 and 2 cm in that of the metatarsals.
We studied main values for all variables (metatarsal protrusion angle for I, III, IV, and V metatarsals) and the Student's t-test to compare male and female groups.
To test the reliability of the measurements, they were made three times in 8 feet selected at random, at intervals of one week between observations. In order to determine the intrareliability, we used these three observations to obtain intraclass coefficient of correlation for all variables.
All measurements were made by one evaluator. The statistical analysis of the data was performed using the program SPSS 12.0 for WINDOWS.
3. Results and Discussion
The statistical analysis established the mean value and the standard deviations for the protrusions of MTT I, III, IV, and V relative to MTT II. The results are displayed in Tables 1 and 2.
Table 1.
Mean values of metatarsal protrusion related to II ray (in millimeters). Whole specimen.
| N = 169 | II-I | II-III | II-IV | II-V |
|---|---|---|---|---|
| Mean* ± SD | 0.94 ± 2.71 | −4.44 ± 1.63 | −11.17 ± 2.21 | −20.21 ± 3.77 |
| Upper LIM | 1.35 | −4.20 | −10.75 | −19.63 |
| Lower LIM | 0.53 | −4.69 | −11.58 | −20.78 |
*IC 95%.
Positive values of metatarsal protrusion mean lengthening of the metatarsal related to II ray expressed in millimeters.
Negative values of metatarsal protrusion mean shortening of the metatarsal related to II ray expressed in millimeters.
Table 2.
Mean values of metatarsal protrusion related to II ray (in percentage terms). Whole specimen.
| N = 169 | II-I | II-III | II-IV | II-V |
|---|---|---|---|---|
| Mean* ± SD | 0.83 ± 2.19 | −3.60 ± 1.22 | −9.05 ± 1.89 | −16.40 ± 2.52 |
| Upper LIM | 1.16 | −3.41 | −8.76 | −16.02 |
| Lower LIM | 0.50 | −3.78 | −9.33 | −16.79 |
*IC 95%.
Positive values of metatarsal protrusion mean lengthening of the metatarsal related to II ray expressed in percentage terms.
Negative values of metatarsal protrusion mean shortening of the metatarsal related to II ray expressed in percentage terms.
The values of the metatarsal protrusion angle showed significant differences (P < 0.05) depending on gender (Tables 3 and 4).
Table 3.
Gender differences in metatarsal protrusion. Mean values of metatarsal protrusion expressed in millimeters related to II ray.
| Female (N = 72) | Male (N = 97) | Significance | |
|---|---|---|---|
| II-I length | 1.43 ± 2.17 | 0.58 ± 3.00 | 0.034* |
| II-III length | −3.87 ± 1.27 | −4.87 ± 1.73 | <0.0005** |
| II-IV length | −9.60 ± 2.08 | −12.33 ± 2.54 | <0.0005** |
| II-V length | −17.88 ± 2.65 | −21.93 ± 3.55 | <0.0005** |
*Significant difference (P < 0.05).
**Significant difference (P < 0.001).
Table 4.
Gender differences in metatarsal protrusion. Mean values of metatarsal protrusion expressed in percentage terms related to II ray.
| Female (N = 72) | Male (N = 97) | Significance | |
|---|---|---|---|
| II-I Length | 1.27 ± 1.88 | 0.50 ± 2.35 | 0.023* |
| II-III Length | −3.36 ± 1.04 | −3.77 ± 1.31 | 0.029* |
| II-IV Length | −8.34 ± 1.69 | −9.57 ± 1.87 | <0.0005** |
| II-V Length | −15.54 ± 2.07 | −17.05 ± 2.64 | <0.0005** |
*Significant difference (P < 0.05).
**Significant difference (P < 0.001).
The results of the test of intraclass correlation are presented in Table 5.
Table 5.
Intraclass coefficient of correlation values.
| N = 8 | CCI* | Lower LIM | Upper LIM |
|---|---|---|---|
| HV angle (°) | 0.986 | 0.952 | 0.997 |
| Inter-MTT I-II angle (°) | 0.973 | 0.908 | 0.994 |
| MTT ADD angle (°) | 0.927 | 0.765 | 0.984 |
| II RAY length (mm) | 1.000 | 0.999 | 1.000 |
| II-I length (mm) | 0.983 | 0.945 | 0.996 |
| II-III length (mm) | 0.976 | 0.922 | 0.995 |
| II-IV length (mm) | 0.977 | 0.925 | 0.995 |
| II-V length (mm) | 0.996 | 0.986 | 0.999 |
*IC 95%.
With the system of measurement of metatarsal protrusion proposed and tested in this study, the authors have found mean values of +0.83% ± 2.19 and +0.94 ± 2.71 mm of metatarsal protrusion between MTT II and I. The pattern of metatarsal protrusion reflected in the study contradicts the data from Nilsonne's study in 1930 [31] of 497 feet included in a control group, which determined that 52.2% presented a shorter MTT I, against 34.4% showing Index Plus.
Viladot [32] also refers to the Index Minus metatarsal formula, with an MTT I anatomically shorter than MTT II in 56% of the population, and 16% in the Index Plus formula.
The mean values of absolute protrusion found by the authors are in agreement with the values of normality established as ±2 mm by Weissman in 1989 [33], Palladino in 1990 [34], and Heden and Sorto Jr. in 1994 [35]. The data obtained in the present study are also similar to those cited by Hardy and Clapham in 1951 [5], Munuera-Martínez et al. in 2004 [29], and Domínguez et al. in 2006 [36].
Munuera-Martínez et al. [29] established in a control group of 252 subjects a mean value for MTT I-II protrusion of 2 mm, increasing to 4 mm in the HAV-affected group studied. The latter found a mean value of MTT II–IV relative protrusion of –13.74 mm for men and –10.24 mm for women in the control group, against the –12.33 mm for men and −9.60 mm for women found in the present study. In 2006, the authors [36] found mean values of metatarsal protrusion in a specimen of 52 feet of +1.22% for metatarsal I, −3.84% for metatarsal III, −9.66% for metatarsal IV, and –16.91% for metatarsal V (there were no differences between male and female feet). These mean values are close to data from the current study showing mean values of metatarsal protrusion of +0.94% for metatarsal I, −4.44% for metatarsal III, −11.17% for metatarsal IV, and −20.21% for metatarsal V.
The authors have found higher values of metatarsal protrusion than those reported by Valley and Reese in 1991 [7]. Due to the difference between the system for measuring metatarsal protrusion proposed here and the systems described by Valley and Reese, the results obtained in the two studies cannot be considered comparable.
The anatomical differences between the male and female skeleton are not only due to size differences that can be presented by specific osseous parts—for instance the male cranium is larger, with more-marked osseous reliefs (glabella, ciliary arches, inion, occipital condyles, mastoid and styloid apophyses, etc.) [8]—the female pelvis is broader [8], and men present larger bones of the rearfoot [15] and metatarsals and phalanges [16]. There are also intergender differences regarding the alignment of certain osteoarticular segments, as in the angle of the knee [12–14] or in the angle of femoral anteversion [9–11], both with higher values in women.
Ferrari et al. [17] demonstrated in their study on 53 male and 54 female skeletons a greater predisposition of the articular surfaces of the first ray to adduction movements in women, with an orientation of the first metatarsal in adduction.
The gender-dependent differences found by various authors regarding the rotational functionality of the lower extremity, and more specifically, the angle of gait, have been of little clinical significance according to the studies reviewed. Authors such as Murray et al. [20, 21] and Lafuente et al. [19] found a difference of between approximately 1 and 1.5°, obtaining higher values in the group of men. The studies of Seber et al. [22] and Dougan [23] on the angle of gait in men, and that carried out by Patek [24] on the angle of gait in women, independently note intergender differences of the same sense and magnitude.
There are, however, different parameters of the female skeleton that determine a functionality of the lower extremity with internal alignment, such as the greater angle of femoral anteversion [9–11] and the greater internal rotation of the hip [18]. These anthropometric differences, compared and evaluated by physical exploration, do not present a significant clinical impact regarding a reduction in the angle of gait of women with respect to that of men, so there must be other parameters within the female skeleton that determine an external alignment of the extremity. The more transverse metatarsophalangeal joint line of the female forefoot, as shown by the results of this study, could be understood as a determining element in opening the angle of gait in women. As Rueda [37] states, oblique metatarsal parabola may determine internal rotation of the hip as a compensation mechanism. This internal rotation of the hip acts closing the angle of gait. However, another type of study would be necessary to evaluate the relationship between the alignment of the forefoot in the transverse plane and the angle of gait in men and women.
Finally, the reliability of measurements using Autocad (Table 5) shows the propriety of using this software for radiographic measurements.
4. Conclusions
There are thus sufficient studies demonstrating anatomical differences in the lower extremity between men and women. The results of the present study should be confirmed with further research in a larger sample, and in which this possible difference of the metatarsal parabola between men and women is correlated with differences in the functionality of the lower extremity.
Different metatarsal parabola between men and women should be considered when designing foot orthoses and shoes. This anatomical difference could be related with lower limb function in male and female biomechanics.
Normal data of metatarsal protrusion contained in this paper are helpful in foot studies in order to set an orthopaedic or surgical treatment of forefoot deformities and pathologies.
Conflict of Interests
The authors declare that there is no conflict of interests regarding the publication of this paper.
References
- 1.Domínguez G, Munuera PV, Lafuente G, Benhamú S, Guerrero A. Revisión bibliográfica de los métodos de medición de la protusión metatarsal. Revista Española de Podología. 2005;16(2):72–77. [Google Scholar]
- 2.Morton DJ. Structural factors in static disorders of the foot. The American Journal of Surgery. 1930;9(2):315–328. [Google Scholar]
- 3.Harris RI, Beath T. Ottowa, Canada: National Research Council of Canada; 1947. Report 15th, army foot survey. [Google Scholar]
- 4.Harris RI, Beath T. The short first metatarsal; its incidence and clinical significance. The Journal of Bone and Joint Surgery. 1949;31(3):553–565. [PubMed] [Google Scholar]
- 5.Hardy RH, Clapham JCR. Observations on hallux valgus; based on a controlled series. The Journal of Bone and Joint Surgery. 1951;33(3):376–391. doi: 10.1302/0301-620X.33B3.376. [DOI] [PubMed] [Google Scholar]
- 6.LaPorta G, Melillo T, Olinsky D. X ray evaluation of hallux abducto valgus deformity. Journal of the American Podiatry Association. 1974;64(8):544–566. doi: 10.7547/87507315-64-8-544. [DOI] [PubMed] [Google Scholar]
- 7.Valley BA, Reese HW. Guidelines for reconstructing the metatarsal parabola with the shortening osteotomy. Journal of the American Podiatric Medical Association. 1991;81(8):406–413. doi: 10.7547/87507315-81-8-406. [DOI] [PubMed] [Google Scholar]
- 8.Testud L, Latarjet A. Tratado de Anatomía Humana. 9th edition. Barcelona, Spain: Salvat Editores SA; 1988. [Google Scholar]
- 9.Solano A, Brill W, Tey M, Espiga TX. Normoalineación de las extremidades inferiores en el adulto. In: Ballester J, editor. Desalineaciones Torsionales de las Extremidades Inferiores. Implicaciones Clinicopatológicas. Vol. 2. Barcelona, Spain: Masson; 2001. p. p. 11. (Monografías SECOT). [Google Scholar]
- 10.Braten M, Terjesen T, Rossvoll I. Femoral anteversion in normal adults: Ultrasound measurements in 50 men and 50 women. Acta Orthopaedica Scandinavica. 1992;63(1):29–32. doi: 10.3109/17453679209154844. [DOI] [PubMed] [Google Scholar]
- 11.Brouwer KJ, Molenaar JC, Van Linge B. Rotational deformities after femoral shaft fractures in childhood. A retrospective study 27–32 years after the accident. Acta Orthopaedica Scandinavica. 1981;52(1):81–89. doi: 10.3109/17453678108991764. [DOI] [PubMed] [Google Scholar]
- 12.Kapandji AI. Fisiología Articular. Miembro Inferior. 5th edition. Madrid, Spain: Editorial Médica Panamericana; 1999. [Google Scholar]
- 13.Palastanga N, Field D, Soames R. Anatomy and Human Movement. 4th edition. Oxford, UK: Butterworth Heinemann; 2002. [Google Scholar]
- 14.Miralles RC, Miralles I, Puig M. Rodilla. In: Miralles RC, Miralles I, editors. Biomecánica Clínica de los Tejidos y las Articulaciones del Aparato Locomotor. 2nd edition. Barcelona, Spain: Masson; 2005. p. p. 233. [Google Scholar]
- 15.Steele DG. The estimation of sex on the basis of the talus and calcaneus. American Journal of Physical Anthropology. 1976;45(3):581–588. doi: 10.1002/ajpa.1330450323. [DOI] [PubMed] [Google Scholar]
- 16.Smith SL. Attribution of foot bones to sex and population groups. Journal of Forensic Sciences. 1997;42(2):186–195. [PubMed] [Google Scholar]
- 17.Ferrari J, Hopkinson DA, Linney AD. Size and shape differences between male and female foot bones: is the female foot predisposed to hallux abducto valgus deformity? Journal of the American Podiatric Medical Association. 2004;94(5):434–452. doi: 10.7547/0940434. [DOI] [PubMed] [Google Scholar]
- 18.Staheli LT, Corbett M, Wyss C, King H. Lower-extremity rotational problems in children. Normal values to guide management. Journal of Bone and Joint Surgery. 1985;67(1):39–47. [PubMed] [Google Scholar]
- 19.Lafuente G, Domínguez G, Munuera PV, María RB. Patrón rotador de la extremidad inferior: concepto, valores normales y relación con el ángulo de la marcha y la movilidad del primer dedo. Revista Española de Podología. 2005;16(1):6–12. [Google Scholar]
- 20.Murray MP, Kory RC, Sepic SB. Walking patterns of normal women. Archives of Physical Medicine and Rehabilitation. 1970;51(11):637–650. [PubMed] [Google Scholar]
- 21.Murray MP, Drought AB, Kory RC. Walking patterns of normal men. The Journal of Bone and Joint Surgery. 1964;46:335–360. [PubMed] [Google Scholar]
- 22.Seber S, Hazer B, Köse N, Göktürk E, Günal I, Turgut A. Rotational profile of the lower extremity and foot progression angle: computerized tomographic examination of 50 male adults. Archives of Orthopaedic and Trauma Surgery. 2000;120(5-6):255–258. doi: 10.1007/s004020050459. [DOI] [PubMed] [Google Scholar]
- 23.Dougan S. The angle of gait. American Journal of Physical Anthropology. 1924;7(2):275–279. [Google Scholar]
- 24.Patek SD. The angle of gait in women. American Journal of Physical Anthropology. 1926;9(3):273–2291. [Google Scholar]
- 25.Ferrari J, Watkinson D. Foot pressure measurement differences between boys and girls with reference to hallux valgus deformity and hypermobility. Foot and Ankle International. 2005;26(9):739–747. doi: 10.1177/107110070502600912. [DOI] [PubMed] [Google Scholar]
- 26.Hennig EM, Staats A, Rosenbaum D. Plantar pressure distribution patterns of young school children in comparison to adults. Foot and Ankle International. 1994;15(1):35–40. doi: 10.1177/107110079401500107. [DOI] [PubMed] [Google Scholar]
- 27.Hennig EM, Rosenbaum D. Pressure distribution patterns under the feet of children in comparison with adults. Foot and Ankle. 1991;11(5):306–311. doi: 10.1177/107110079101100507. [DOI] [PubMed] [Google Scholar]
- 28.Montagne J, Chevrot A, Galmiche JM. Atlas de Radiología del Pie. Barcelona, Spain: Masson; 1984. [Google Scholar]
- 29.Munuera-Martínez PV, Lafuente-Sotillos G, Domínguez-Maldonado G, Salcini-Macías JL, Martínez-Camuña L. Morphofunctional study of brachymetatarsia of the fourth metatarsal. Journal of the American Podiatric Medical Association. 2004;94(4):347–352. doi: 10.7547/0940347. [DOI] [PubMed] [Google Scholar]
- 30.Coughlin MJ, Saltzman CL, Nunley JA., II Angular measurements in the evaluation of hallux valgus deformities: a report of the Ad Hoc Committee of the American Orthopædic Foot & Ankle Society on angular measurements. Foot and Ankle International. 2002;23(1):68–74. doi: 10.1177/107110070202300114. [DOI] [PubMed] [Google Scholar]
- 31.Nilsonne H. Hallux rigidus and its treatment. Acta Orthopaedica Scandinavica. 1930;1:p. 295. [Google Scholar]
- 32.Viladot A. The metatarsals. In: Jahss MH, editor. Disorders of the Foot. Vol. 1. Philadelphia, Pa, USA: Saunders; 1982. p. p. 659. [Google Scholar]
- 33.Weissman SD. Radiology of the Foot. 2nd edition. Baltimore, Md, USA: Williams & Wilkins; 1989. [Google Scholar]
- 34.Palladino SJ. Preoperative evaluation of the bunion patient: etiology, biomechanics, clinical and radiographic assessment. In: Gerbert J, editor. Text Book of Bunion Surgery. 2nd edition. New York, NY, USA: Futura Publishing Company; 1991. p. p. 1. [Google Scholar]
- 35.Heden RI, Sorto LA., Jr. The Buckle point and the metatarsal protrusion’s relationship to hallux valgus. Journal of the American Podiatry Association. 1981;71(4):200–208. doi: 10.7547/87507315-71-4-200. [DOI] [PubMed] [Google Scholar]
- 36.Domínguez G, Munuera PV, Lafuente G. Relative metatarsal protrusion in the adult: a preliminary study. Journal of the American Podiatric Medical Association. 2006;96(3):238–244. doi: 10.7547/0960238. [DOI] [PubMed] [Google Scholar]
- 37.Rueda M. Los Desequilibrios del Pie. Barcelona, Spain: Paidotribo; 2004. [Google Scholar]