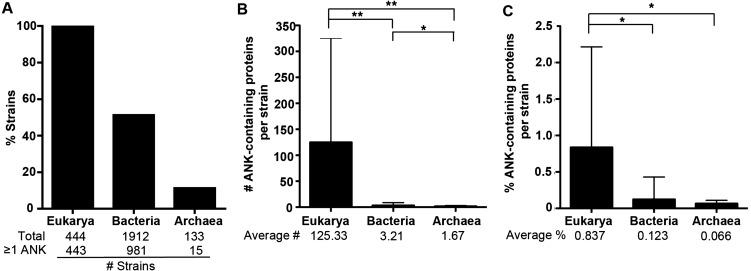
Figure 2. ANK-containing protein analysis across all domains of life.
(A) Bar graph of the average percent of the strains in each domain that have one or more ANK-containing proteins. The total number of strains analyzed and the number of strains with more than one ANK-containing protein are listed below the graph. (B) Bar graph of the average number of ANK containing proteins in strains of each domain. The average number of ANK-containing proteins in each domain is listed below the graph. Error bars represent standard deviation. (*P < 0.05, ** P < 0.000001, Two-tailed Mann-Whitney U; ANOVA P < 0.000001). (C) Bar graph showing the average percent of the proteome composed of ANK-containing proteins in each domain. Error bars represent standard deviation. (*P < 0.000001, Two-tailed Mann-Whitney U; ANOVA, P < 0.000001).

