Abstract
To better understand the molecular mechanisms behind esophageal adenocarcinoma (EAC) tumorigenesis, we used high-density single nucleotide polymorphism (SNP) arrays to profile chromosomal aberrations at each of the four sequential progression stages – Barrett’s metaplasia (BM), low-grade dysplasia (LGD), high-grade dysplasia (HGD), and EAC, in 101 patients. We observed a significant trend toward increasing loss of chromosomes with higher progression stage. For BM, LGD, HGD, and EAC, respectively, the average numbers of chromosome arms with loss per sample were 0.30, 3.21, 7.70, and 11.90 (P for trend= 4.82 × 10⁻⁷), and the mean percentages of SNPs with allele loss were 0.1%, 1.8%, 6.6%, and 17.2% (P for trend = 2.64 × 10⁻⁶). In LGD, loss of 3p14.2 (68.4%) and 16q23.1 (47.4%) was limited to narrow regions within the FHIT (3p14.2) and WWOX (16q23.1) genes, whereas loss of 9p21 (68.4%) occurred in larger regions. A significant increase in the loss of other chromosomal regions was seen in HGD and EAC; loss of 17p (47.6%) was one of the most frequent events in EAC. Many recurrent small regions of chromosomal loss disrupted single genes, including FHIT, WWOX, RUNX1, KIF26B, MGC48628, PDE4D, C20orf133, GMDS, DMD, and PARK2, most of which are common fragile site (CFS) regions in the human genome. But RUNX1 at 21q22 appeared to be a potential tumor suppressor gene in EAC. Amplifications were less frequent than losses and mostly occurred in EAC. The 8q24 (containing Myc) and 8p23.1 (containing CTSB) were the two most frequently amplified regions. In addition, a significant trend toward increasing amplification was associated with higher progression stage.
Introduction
Esophageal cancer is the eighth most common and the sixth most lethal cancer in the world (1). In the United States, an estimated 16,470 new cases and 14,530 deaths from this disease were expected in 2009 (2). Esophageal cancer tends to have a very poor prognosis because approximately two thirds of patients who are diagnosed have advanced stage disease, at which point current therapies are largely ineffective (3). The overall 5-year survival rate in the Surveillance, Epidemiology, and End Results (SEER) database is 16.8% (3). These dismal statistics highlight the need to develop methods to detect esophageal cancer in its early stages and to identify biomarkers that can predict clinical outcomes.
More than 90% of esophageal cancers are either esophageal squamous cell carcinomas (ESCC) or esophageal adenocarcinoma (EAC) (3). Once considered a rare tumor (representing less than 5% of esophageal cancers in the United States), EAC is the cancer with the fastest rising incidence in the past 3 decades and currently accounts for more than 60% of new esophageal cancer cases in this country (4,5). Most EAC cases arise from Barrett’s esophagus, or Barrett’s metaplasia (BM), a precursor lesion in which the squamous epithelium of the esophagus is replaced by a metaplastic columnar epithelium. BM is estimated to be present in 1% to 2% of the general population and confers a 30- to 125-fold increased risk of developing EAC. However, in patients with BM, the absolute risk of developing EAC is only approximately 0.5% per patient-year, which calls for more accurate and robust prediction of who may develop EAC to increase the cost-effectiveness of surveillance strategies such as routine endoscopy among high-risk BM patients (6,7). The malignant progression of BM follows a generally accepted series of stages, from metaplasia, to low-grade dysplasia (LGD), to high-grade dysplasia (HGD), and finally, to adenocarcinoma. The risk of developing EAC in patients with HGD may be higher than 10% per patient-year (7,8). However, this risk has been hard to assess because the grading of dysplasia is subjective and there is relatively high inter-observer variability in its diagnosis. Independent objective biomarkers thus may improve the assessment of EAC risk by complementing pathologic grading.
The accumulation of genetic aberrations plays a pivotal role during the malignant progression from BM to EAC. Previous studies using candidate region analysis, low-resolution conventional comparative genomic hybridization (CGH), and low-density SNP arrays have identified many of the chromosomal aberrations involved in the progression of EAC (9-15). A number of well-known tumor suppressor genes (TSGs) and oncogenes have been implicated in EAC, including p16, p53, p21, APC, Rb, SMAD4, Myc, K-ras, EGFR, cyclins, and CDKs (16-18). However, except for the most consistent deletion of 9p21 across different histologic stages and the loss of heterozygosity (LOH) of p53 in the later stages, the results for other chromosomal aberrations are highly heterogeneous in terms of stage, frequency, and size. A high-resolution genome-wide profiling of chromosomal aberrations in different stages from BM to EAC may not only elucidate the mechanisms of tumorigenesis of EAC, but also identify predictors of malignant progression, biomarkers of prognosis and treatment response, and potential targets for prevention and therapy.
Whole-genome high-density SNP array analysis is a powerful new technology for detecting both copy number variations and LOH events (19). Other notable advantages include its high resolution, its capability of profiling both physical and genetic aberrations, its low levels of required input DNA (as little as 10 ng), and its high sensitivity in the presence of normal cell contamination (allowing the detection of LOH in paired samples with ~67% normal background cells) (19). Nancarrow et al. (20) recently performed a high-density SNP array analysis of 23 primary biopsies of EAC tumors. In this study, we used Illumina’s 317K SNP array to profile and compare genome-wide chromosomal aberrations in the 4 stages of EAC tumorigenesis, BM, LGD, HGD, and EAC.
Materials and Methods
Tissue samples and DNA extraction
A total of 101 (20 BM, 19 LGD, 20 HGD, and 42 EAC) disease tissues and their paired normal tissues obtained from The University of Texas MD Anderson Cancer Center were included in this study. All tissues were snap frozen at the time of diagnostic or therapeutic endoscopic biopsies using a tissue-collection protocol approved by the Institutional Review Board. Experienced gastrointestinal pathologists at MD Anderson Cancer Center performed the histologic readings of the corresponding juxtaposed paraffin fixed specimens. The diagnoses of LGD and HGD were based on each biopsy using the criteria previously described (21). All the disease tissues in this cross-sectional study were from separate patients diagnosed with EAC. A corresponding normal squamous tissue sample was collected from a healthy appearing mucosa at least 3 cm from the edge of the apparent tumor from each patient by an expert gastroenterologist. The tumors were staged according to the American Joint Commission on Cancer Staging Manual (22). DNA was extracted using QIAamp DNeasy Blood and Tissue kit (Qiagen, Valencia, CA) according to the manufacturer’s instructions.
SNP array analysis
The SNP array analysis was performed using Illumina’s HumanHap300 BeadChip array according to the manufacturer’s protocol (Illumina, San Diego, CA). Briefly, 200 ng of genomic DNA extracted from the tissues was denatured and amplified at 37°C overnight. The amplified DNA was fragmented and precipitated at 4°C, resuspended in hybridization buffer, and hybridized to HumanHap300 chips at 48°C overnight. The unhybridized and non-specifically hybridized DNA was then washed away and the captured DNA was used as templates for one base extension of the locus-specific oligos on the BeadChips. All SNP data were analyzed and exported by BeadStudio 2.0 (Illumina), which generated whole-genome profiles for disease and normal tissues based on the Log2R ratio and allele frequency of each SNP. We used paired analysis (each disease tissue versus its own adjacent normal tissue reference) instead of a single normal reference, because paired analysis offers higher sensitivity, better quality of data, and lower variation of Log2R ratio in the case of limited input DNA (19). We tested the built-in autoscoring algorithms of BeadStudio to identify LOH, homozygous deletion, and amplification. Log2R ratio between tumor and normal samples and the absolute value of the difference between B allele frequency in tumor and normal samples (∣dAllelefreq∣) were obtained using the BeadStudio software. In paired analysis, both disease and normal samples came from the same patients, and deviations of ∣dAllelefreq∣ from zero indicated regions with chromosomal aberrations. We first performed a filtering process to select the candidate points for analysis using B allele frequency (between 0.4 and 0.6) of normal samples following the BeadStudio LOH User Guide. We then applied a circular binary segmentation algorithm (23) implemented within the R software environment to identify change points for the regions of aberration using ∣dAllelefreq∣ on the candidate points. Regions that were bound by these change points and that deviated from zero were identified as regions of chromosomal aberrations. For these regions of chromosomal aberrations, we then determined whether it represented a chromosomal loss or gain using the Log2R ratio. The resulting annotations were compared with the annotations from the built-in BeadStudio algorithms and further confirmed by manually inspecting the BeadStudio Genome Viewer plots of tumor B allele frequency, normal B allele frequency, ∣dAllelefreq∣, and log2R ratio. We grouped LOH (including copy-neural LOH) and homozygous deletion together as chromosome loss for two reasons: 1) homozygous deletion was a rare event; 2) when there were high levels of normal cells in disease tissues, it was difficult to differentiate among LOH, copy-neutral LOH, and homozygous deletion because the Log2R was ambiguous, although it was clear from the ∣dAllelefreq∣ plot that the region had one of these events. We manually inspected the X chromosome from each tissue and identified high-frequency aberrations but we only counted autochromosomes in the analyses of total number, size, and percentage of aberrations. We excluded Y chromosomes from the analysis since there are only two representing SNPs on it.
Statistical analyses
For all analyses, loss and amplification were analyzed separately. Fisher’s exact test was used to test for differences in the frequency of aberrations (loss and amplification) by each chromosome arm among BM, LGD, HGD, and EAC tissues. The Kruskal-Wallis and nonparametric trend tests were used to compare the sizes of aberration at each chromosome arm among BM, LGD, HGD, and EAC tissues. For each tissue sample, we also tallied the total number and total size of chromosome aberrations, and the percentage of SNPs with aberrations among all the analyzed SNPs (317K). The Kruskal-Wallis and nonparametric trend tests were used to compare the mean total number, mean total size, and mean percentage of SNPs with aberrations among BM, LGD, HGD, and EAC tissues. All analyses were performed using the Stata 8.0 statistical software package (Stata Co., College Station, TX). All tests were 2-sided, and P < 0.05 was considered statistically significant.
Results
Patient and tumor characteristics
A total of 101 (20 BM, 19 LGD, 20 HGD, and 42 EAC) disease tissue specimens were included in this study. Table 1 lists selected characteristics of patients from whom these tissues were obtained. BM tissues were from patients who were younger (mean age ± SD: 54.60 ± 10.34 years) and included a higher percentage (40%) of female subjects than patients with the other 3 histologic stages. The mean age was similar among patients with LGD (62.21 ± 9.82), HGD (61.70 ± 12.62), and EAC (57.62 ± 9.51). Over 90% of patients in each of these latter three stages were men and over 80% were Caucasian. The distribution of EAC patients by stage was 17 with stage II, 20 with stage III, 2 with stage IV, and 3 unspecified; 21 patients had moderately differentiated and 20 had poorly differentiated tumors.
Table 1.
Selected Host and Tumor Characteristics
| Variables | BM, N (%) | LGD, N (%) | HGD, N (%) | EAC, N (%) | P |
|---|---|---|---|---|---|
| Age, mean(SD) | 54.60 (10.34) | 62.21 (9.82) | 61.70 (12.62) | 57.62 (9.51) | 0.067* |
| Sex | |||||
| Male | 12 (60.0) | 18 (94.7) | 18 (90.0) | 39 (92.9) | 0.006** |
| Female | 8 (40.0) | 1 (5.3) | 2 (10.0) | 3 (7.1) | |
| Ethnicity | |||||
| Caucasians | 19 (95.0) | 18 (94.7) | 16 (80.0) | 34 (81.0) | 0.275** |
| Other | 1 (5.0) | 1 (5.3) | 4 (20.0) | 8 (19.0) | |
| Stage | |||||
| Stage II | 17 (40.5) | ||||
| Stage III | 20 (47.6) | ||||
| Stage IV | 2 (4.8) | ||||
| Unspecified | 3 (7.1) | ||||
| Grade | |||||
| Moderate-diff. | 21 (50.0) | ||||
| Poorly-diff. | 20 (47.6) | ||||
| Unspecified | 1 (2.4) |
P from Analysis of variance (ANOVA) test;
P from Fisher’s exact test.
Genome-wide catalogue of chromosomal aberrations
We profiled genome-wide chromosomal aberrations using Illumina’s HumanHap300 Beadchips, which contained approximately 317K haplotype tagging SNPs. SNPs on the HumanHap300 chips represent even coverage by each chromosome (except the Y chromosome) and are evenly spaced across the whole genome to ensure comprehensive coverage. On average, there is 1 SNP every 9 kb across the genome and the median spacing is 5 kb. The 90th percentile spacing between loci, indicating the largest intervals in content on the chip, is 19 kb (24). With a mean SNP spacing of 9 kb and a 10 SNP smoothing window, the effective resolution of HumanHap300 SNP array for chromosomal aberration analysis is ~90 kb (19).
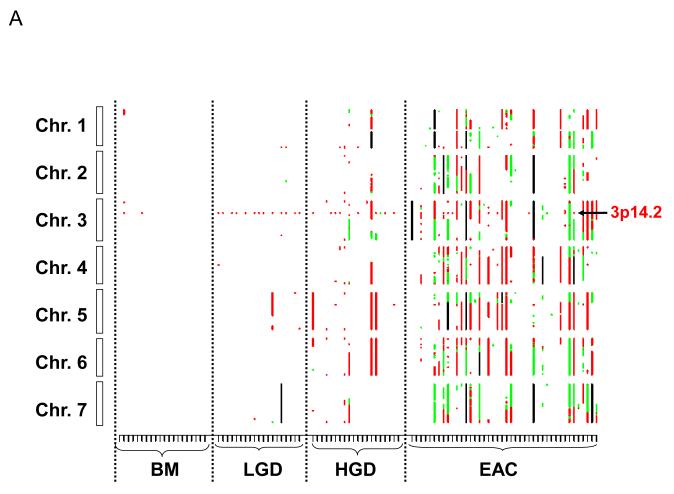
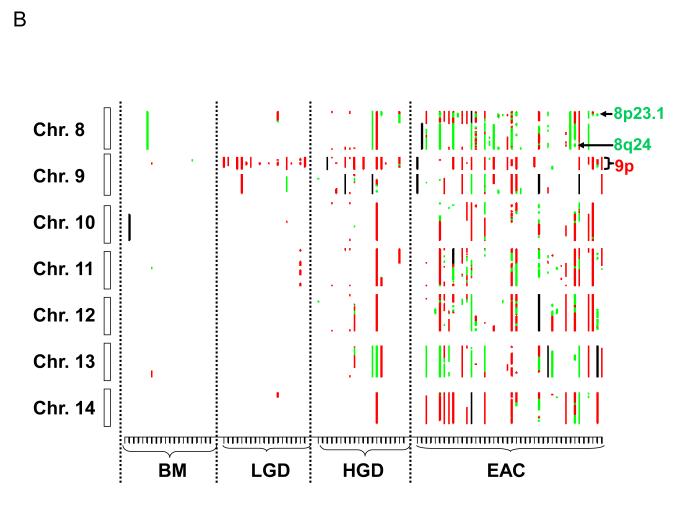
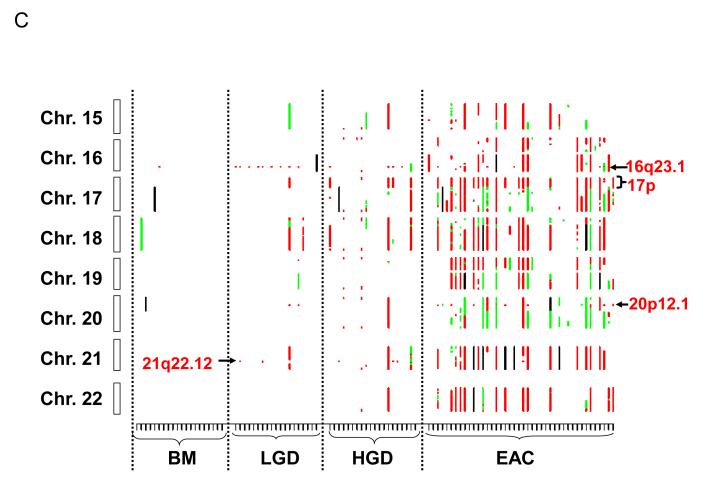
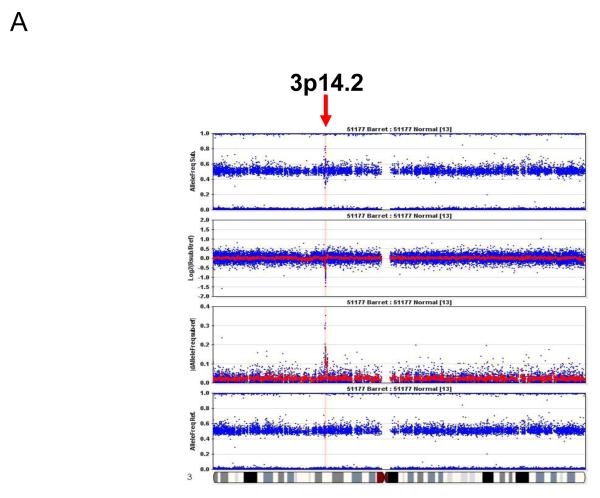
Figure 1 shows the genome-wide distribution of losses and amplifications by chromosome in each sample. A visual examination of the figure reveals that there is a gradual increase in chromosome aberrations with the increase in histologic stages. In BM samples, there were only scattered chromosome losses at 3p14.2 (10%), 9p21 (5%), and 16q23.1 (5%); these three events were the most frequent aberrations in LGD samples (68.4%, 68.4%, and 47.4%, respectively) (Table 2). There were dramatic increases in the numbers of aberrations in the HGD and EAC stages (Fig.1, Table 2). Furthermore, the 3p14.2 (68.4%) and 16q23.1 (47.4%) losses seen in the LGD stage were exclusively limited within genes FHIT (3p14.2; Fig. 2A & 3A) and WWOX (16q23.1; supplementary Fig. 1A), two of the most frequently activated CFS regions in the human genome.
Figure 1.
Genome-wide catalogue of chromosomal aberrations on each chromosome. X axis denotes tissue samples, grouped by histologic stages. Y axis denotes chromosomes, oriented with the p-arm at the top and q-arm at the bottom for each chromosome. Red color represents loss, green represents amplification, and black represents ambiguous aberrations. (A) chromosomes 1 to 7; (B) chromosomes 8 to 14; and (C) chromosomes 15 to 22. Some of the most frequent losses and amplifications are marked.
Table 2.
Frequent Loss of Individual Chromosome Arm (%)*
| Chrom. Arm | BM | LGD | HGD | EAC | P ** |
|---|---|---|---|---|---|
| 3p | 10.0 | 68.4 | 70.0 | 47.6 | 1.85E-04 |
| 4p | 0.0 | 0.0 | 10.0 | 38.1 | 5.38E-05 |
| 4q | 0.0 | 5.3 | 20.0 | 42.9 | 1.19E-04 |
| 5q | 0.0 | 10.5 | 35.0 | 38.1 | 1.09E-03 |
| 6p | 0.0 | 0.0 | 30.0 | 40.5 | 3.33E-05 |
| 8p | 0.0 | 5.0 | 20.0 | 38.1 | 6.08E-04 |
| 9p | 5.0 | 68.4 | 50.0 | 38.1 | 2.35E-04 |
| 11p | 0.0 | 5.3 | 20.0 | 38.1 | 6.08E-04 |
| 11q | 0.0 | 5.3 | 20.0 | 35.7 | 1.25E-03 |
| 12q | 0.0 | 0.0 | 20.0 | 35.7 | 2.27E-04 |
| 16q | 5.0 | 47.4 | 25.0 | 42.9 | 5.52E-03 |
| 17p | 0.0 | 5.3 | 25.0 | 47.6 | 2.14E-05 |
| 18q | 0.0 | 10.5 | 25.0 | 35.7 | 3.59E-03 |
| 19p | 0.0 | 0.0 | 15.0 | 38.1 | 5.38E-04 |
| 21q | 0.0 | 15.8 | 35.0 | 35.7 | 4.05E-03 |
| 22q | 0.0 | 0.0 | 10.0 | 35.7 | 1.37E-04 |
Only loss with >35% frequency in EAC were included.
Fisher’s exact test
Figure 2.
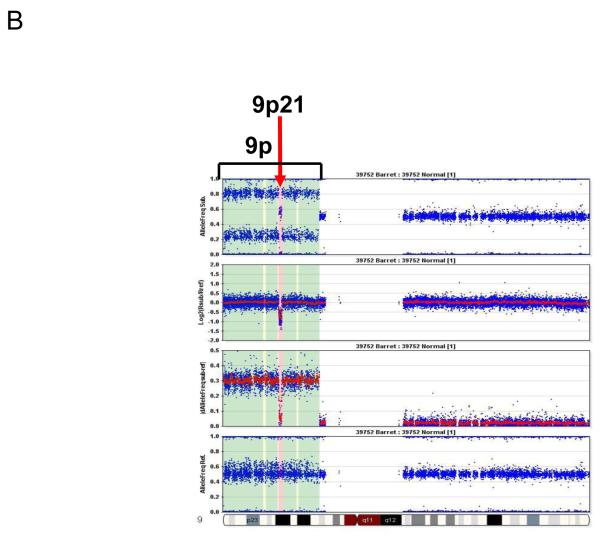
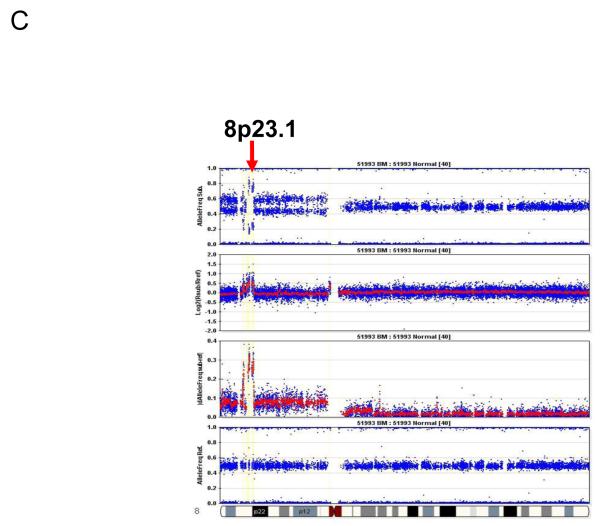
Representative pictures of chromosome loss and amplification. (A) 3p14.2 loss; (B) 9p LOH and 9p21 homozygous deletion; and (C) 8p23.1 amplification. Panel 4 shows the allele frequencies of normal DNA. Panel 1 shows the allele frequencies of disease tissue. Panel 3 shows the absolute allele frequency differences between disease (panel 1) and normal (panel 4) tissues (∣dAllelefreq∣). Regions of ∣dAllelefreq∣ > 0 indicate regions of aberrations. Panel 2 shows the log2R ratio of disease to normal tissues (measuring changes in intensity from what is expected for two copies of each locus). The regions without aberrations should have log2R values of 0. A negative log2R value indicates chromosome loss and a positive value suggests chromosome amplification.
Figure 3.
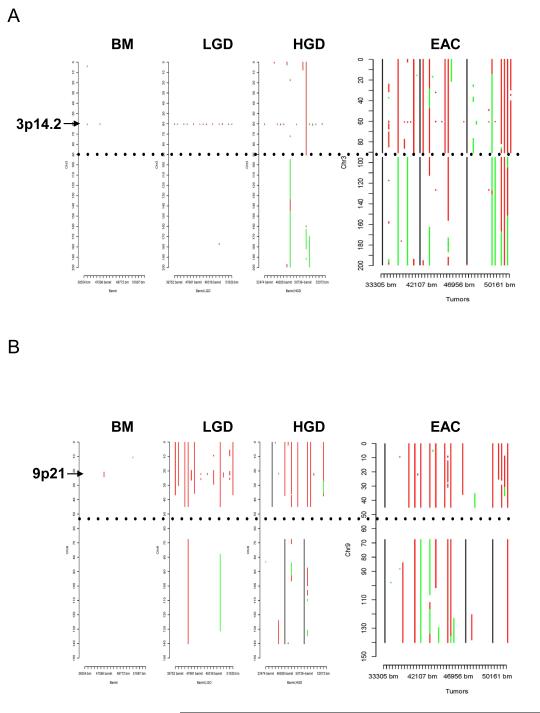
Distribution of aberrations at chromosomes 3 (A) and 9 (B) in different stages from BM to EAC. X axis denotes samples, Y axis denotes chromosome position in Mb. Red: loss, green: amplification, black: aberrations ambiguous, and dotted black: centromere position.
In the HGD and particularly EAC stages, the sizes of 3p loss (Fig. 3A) and 16q loss (supplementary Fig. 1A) increased. In contrast, the 9p loss occurred in larger regions from LGD to EAC (Fig.2B), and homozygous deletion of the 9p21 locus was observed in the context of large region of 9p LOH (Fig. 3B).
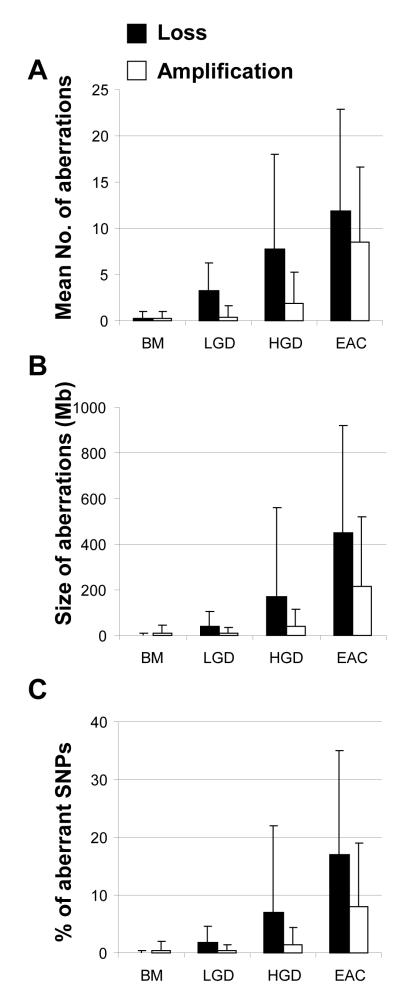
We then computed the overall levels of chromosomal aberration in each sample by three parameters (total number, total size, and percentage of SNPs with aberrations) and compared the values among the four different stages. As shown in Fig.4, there was a significant trend of increasing number and size of chromosomal aberrations and increasing percentage of SNPs with aberrations associated with increasing histologic stages. The average total numbers of chromosome arms with losses per sample were 0.30, 3.21, 7.70, and 11.90 for BM, LGD, HGD, and EAC, respectively (P for trend = 4.82 × 10⁻⁷; when analyzing BM, LGD and HGD only, P for trend = 4.44 × 10⁻⁵; Fig. 4A). The mean total sizes of chromosome losses per sample were 2.33 Mb, 39.10 Mb, 167.87 Mb, and 449.90 Mb (P for trend = 8.13 × 10⁻⁸; Fig. 4B), and the mean percentages of SNPs with allele losses were 0.1%, 1.8%, 6.6%, and 17.2% for BM, LGD, HGD, and EAC, respectively (P for trend = 2.64 × 10⁻⁶; Fig. 4C).
Figure 4.
Increased level of chromosomal aberrations (losses and amplifications) with increasing histologic stage. (A) Mean numbers of chromosome arm aberrations (P for trend = 4.82 × 10⁻⁷ for loss and P for trend = 1.35 × 10⁻⁹ for amplification); (B) Mean total sizes (Mb) of chromosome aberrations (P for trend = 8.13 × 10⁻⁸ for loss and P for trend = 1.23 × 10⁻⁸ for amplification); and (C) Mean percentage of SNPs with aberrations per tissue in each stage (P for trend = 2.64 × 10⁻⁶ for loss and P for trend = 1.26 × 10⁻⁸ for amplification).
Similar analyses were performed for amplifications, which were less frequent than losses and mostly occurred in EAC. The average numbers of chromosome arms with amplifications per sample were 0.30, 0.42, 1.90, and 8.50 for BM, LGD, HGD, and EAC, respectively (P for trend = 1.35 × 10⁻⁹), but the trend was not significant for amplification in premalignant (BM, LGD and HGD) stages (P for trend = 0.147) due to the rarity of amplifications in these stages. The mean total sizes of amplifications per sample were 11.00 Mb, 9.41 Mb, 37.70 Mb, and 215.74 Mb (P for trend = 1.23 × 10⁻⁸; Fig. 4B) and the mean percentages of SNPs with amplifications were 0.5%, 0.4%, 1.5%, and 8.0% for BM, LGD, HGD, and EAC, respectively (P for trend 1.26 × 10⁻⁸; Fig. 4C).
Individual chromosome aberrations and small overlapping regions of aberrations
Chromosome losses in LGD samples were mostly confined to three regions (3p14.2, 9p21, and 16q23.1). However, there was a significant increase in chromosome losses and gains in the HGD and EAC stages (Fig. 1, Table 2). The most frequent chromosome arm losses in the HGD stage were 3p (70%), 9p (50%), 5q (35%), 21q (35%), 6p (30%), 16q, 17p, and 18q (all 25%), and 4q, 8p, 11p, 11q, and 12q (all 20%). In EAC, the frequent (>35%) chromosome losses included 17p (47.6%), 3p (47.6%), 16q (42.9%), 4q (42.9%), 6p (40.5%), 9p (38.1%), 8p (38.1%), 5q (38.1%), 19p (38.1%), 11p (38.1%), 4p (38.1%), 11q (35.7%), 18q (35.7%), 21q (35.7%), and18q (35.7%; Table 2). All of these frequent individual chromosome losses showed significant associations with higher stages; the most significant individual associations were 17p (P = 2.14 × 10⁻⁵), 6p (P = 3.33×10⁻⁵), and 4p (P = 5.38 × 10⁻⁵; Table 2). The 17p loss (all including p53 locus) occurred predominantly in either a large portion of (>20 Mb) or the entire 17p arm, with only one exception involving a small focal LOH at 17p13.1 (323 Kb, containing p53 and 22 other genes; Supplementary Fig 1B).
There were many small recurrent regions of loss that disrupted single genes, including FHIT (3p14.2), WWOX (16q23.1), RUNX1 (21q22.12), KIF26B (1q44), MGC48628 (4q22.1), PDE4D (5q11.2), C20orf133 (20p12.1), GMDS (6p25.3), DMD (Xp21.2), and PARK2 (6q26), the majority of which were CFS regions in the human genome (Table 3). Of particular interest was RUNX1 at 21q22.12; focal loss of this gene occurred in 2 cases of LGD and 3 of HGD, and an additional HGD case lost the entire 21q arm. 21q loss was also a frequent event in EAC (occurring in 35.1% of cases), suggesting that RUNX1 is a potential TSG involved in the development of EAC.
Table 3.
Recurrent Small Overlapping Regions of Chromosome Loss*
| Chrom. | Start | End | Size (Kb) | Genes | Gene Size | Fragile Site |
|---|---|---|---|---|---|---|
| 1q44 | 243529398 | 243765708 | 236.3 | KIF26B | 548,142 | FRA1I |
| 3p14.2 | 60383444 | 60475589 | 92.1 | FHIT | 1,502,089 | FRA3B |
| 4q22.1 | 91643255 | 91880768 | 237.5 | MGC48628 | 546,974 | FRA4F |
| 5q11.2 | 58523521 | 58711295 | 187.8 | PDE4D | 1,019,680 | |
| 6p25.3 | 1206805 | 1658389 | 451.6 | GMDS | 621,806 | FRA6B |
| 6q26 | 161958628 | 162243987 | 285.4 | PARK2 | 1.380,352 | FRA6E |
| 7q31.1 | 110645504 | 111017480 | 372.0 | IMMP2L | 899,238 | FRA7G |
| 7q35 | 145302806 | 145820585 | 517.8 | CNTNAP2 | 2,304,634 | FRA7I |
| 9p21.3 | 21987872 | 22122076 | 134.2 | CDKN2B | 6,411 | |
| 10q21.3 | 68040186 | 68345373 | 305.2 | CTNNA3 | 1,776,019 | FRA10D |
| 16q23.1 | 77146033 | 77164753 | 18.7 | WWOX | 1,113,014 | FRA16D |
| 17p13.1 | 7413608 | 7736254 | 322.6 | p53 & 22 others | 19,198 (p53) | |
| 20p12.1 | 14825654 | 15018049 | 192.4 | C20orf133 | 2,057,697 | FRA20B |
| 21q22.12 | 35077882 | 35179895 | 102.0 | RUNX1 | 261,544 | |
| Xp21.1 | 31612560 | 31712320 | 99.8 | DMD | 2,214,919 | FRAXC |
Only include regions of ~500 Kb and smaller.
The small overlapping regions of amplifications contained from 4 to nearly 100 genes, among which there were many known oncogenes and proliferation genes. The high-frequency small overlapping regions of amplifications (occurring in more than 15% of samples) and candidate genes in these regions included: 8q24.21 (36.6%, MYC and 4 other genes), 8p23.1 (31.7%, CTSB and 15 others), 7q21 (30.8%, CDK6 and 4 others), 20q13.2 (28.6%, ZNF217 and 3 others), 7p11.2 (25.6%, EGFR and 33 others), 3q26 (20.5%, PIK3CA and 93 others), 12p12.1 (19.5%, KRAS and 6 others), 18q11.2 (17.5%, CTAGE1 and 3 others), and 11q13.2-q13.3 (16.7%, CCND1 and 10 others; Table 4). Of particular interest, the majority of amplifications at 8p23.1 were focal amplifications encompassing the CTSB gene (Fig. 1B and Fig. 3C).
Table 4.
Recurrent Small Overlapping Regions of Amplification*
| Chrom | Start | End | Size (Kb) |
Frequency (%) |
Genes | |
|---|---|---|---|---|---|---|
| HGD | EAC | |||||
| 3q26 | 173230050 | 186580274 | 13350 | 15.0 | 20.5 | PIK3CA & 93 genes |
| 5p13.2-p12 | 36348269 | 44184542 | 7836 | 0.0 | 20.0 | 53 genes |
| 6p21.33 | 30559883 | 31040288 | 480 | 0.0 | 16.7 | 24 genes |
| 6p21.1 | 41746737 | 44753714 | 3007 | 0.0 | 16.7 | VEGF & 69 genes |
| 7p22.2 | 795019 | 2280133 | 1485 | 0.0 | 25.6 | 25 genes |
| 7p11.2 | 54471518 | 56699692 | 2228 | 0.0 | 25.6 | EGFR & 33 |
| 7q21.2-q21.3 | 92102346 | 92744573 | 642 | 0.0 | 30.8 | CDK6 & 4 |
| 8p23.1 | 11194870 | 11897260 | 702 | 15.0 | 31.7 | CTSB & 15 |
| 8q24.21 | 127660810 | 129220171 | 1559 | 5.0 | 36.6 | MYC & 4 |
| 11q13.2-q13.3 | 69152144 | 69957414 | 805 | 0.0 | 16.7 | CCND1 & 10 |
| 12p12.1 | 25029283 | 25546789 | 518 | 5.0 | 19.5 | KRAS & 6 |
| 12q14.3 | 65978417 | 67060279 | 1082 | 5.0 | 19.5 | MDM1 & 8 |
| 13q14.3-q21.32 | 53356272 | 65178858 | 11823 | 10.0 | 22.5 | 30 genes |
| 17q21.2 | 36045007 | 36600822 | 556 | 10.0 | 19.5 | 38 genes |
| 18q11.2 | 17931784 | 18382880 | 451 | 15.0 | 17.5 | CTAGE1 & 3 |
| 20q13.2 | 50951694 | 51913648 | 962 | 0.0 | 28.6 | ZNF217 & 3 |
Only include regions with frequency>15% in EAC.
Discussion
Many previous studies have shown an increasing accumulation of chromosomal aberrations during the metaplasia-dysplasia-carcinoma sequence of EAC development (9-14) and the pathogenesis of other malignancies (25-27). The distribution and frequency spectrum of each chromosomal aberration in the literature has been inconsistent (17, 20) for a number of reasons, including assay technology, normal tissue contamination, small sample sizes, tumor heterogeneity, different environmental exposures, gene/environment interactions, and population stratifications. Using a large series of premalignant and malignant tissues, the current study applied high-density SNP array technology to produce the highest-resolution genome-wide catalogue of chromosomal alterations in BM through EAC to date. The clear advantage of our high resolution arrays was demonstrated when the losses of the 3p14.2 and 16q23.1 regions in samples from the BM and LGD stages were observed exclusively within the two most frequently activated CFS regions in the human genome. In contrast, 9p deletions in both dysplastic (LGD and HGD) and malignant (EAC) biopsies often involved large regions surrounding the p15 and p16 loci. The predominant occurrence of these 3 chromosomal losses in the LGD stage supports the notion that p15 and/or p16 genes and genetic instability are early driving forces in the development of dysplasia. With further malignant progression to the HGD and EAC stages, the spectrum and size of chromosomal aberrations gradually increased. By the EAC stage, approximately a quarter (17%, losses and 8%, amplifications) of the whole genome exhibited aberrations.
CFS regions are large, unstable genomic regions that exhibit increased chromosomal gaps and breaks when DNA replication is partially inhibited (28-31). The single genes identified from this study (Table 3) were mostly large genes (from ~500 Kb to over 2 Mb) that included the majority of previously confirmed CFS genes (FHIT, PARK2, IMMP2L, CNTNAP2, CTNNA3, WWOX, and DMD) (30,31). In addition, our data indicated several potential new CFS genes, including KIF26B at 1q44, MGC48628 at 4q22.1, GMDS at 6p25.3, and C20orf133 at 20p12.1. Others have previously hypothesized MGC48628 to be a CFS gene (28). Homozygous deletion of ~500 Kb within MGC48628 was recently reported to be found in EAC (20). We confirmed the same deletion in both dysplastic and EAC tissues. Whether these CFS genes are specifically involved in the development of a subset of EACs or are only “hitchhikers” (32) remains to be studied. To our knowledge, the occurrence of CFS regions in BM and EAC is more extensive than in other cancers, which biologically may be attributable to the constant bile acid exposure during gastrointestinal reflux. Previous studies have shown that bile acid induces inflammation and oxidative stress, which in turn activates CFS regions (33,34).
Chromosomal loss at 5q occurs frequently in EAC (10-16). The APC gene at 5q21 has been hypothesized to be the candidate TSG in EAC (35); however, we found that most of the 5q losses were around the PDE4D gene (encoding a cyclic AMP phosphodiesterase) at 5q11.2, including focal losses within PDE4D in two LGD samples and five EAC samples. Nancarrow et al. (20) reported similar deletions in EAC samples. Interestingly, Weir et al. (36) found homozygous focal deletions within PDE4D in lung adenocarcinoma. The underlying biologic mechanism of this homozygous deletion, its functional consequence, and its pathologic impact on esophageal and lung adenocarcinoma warrant further investigation.
The second potential candidate TSG in EAC is RUNX1 at 21q22.12. Focal loss of RUNX1 occurred in two LGD and three HGD samples, and 21q loss was frequent in EAC (Table 2). RUNX1 belongs to the Runt domain family of transcription factors consisting of three DNA binding α subunits (RUNX1, 2, and 3), each of which forms heterodimers with the common β subunit CBFβ and plays pivotal roles in neoplastic progression (37). RUNX1 (AML1) is a well-established TSG in leukemia (37,38) and RUNX3 is an established TSG in gastric, esophageal, and other solid tumors (37,39). A previous report showed a dramatic downregulation of RUNX1 and RUNX3 in gastric tumors compared with adjacent normal tissues (40). Taken together, these data suggest that RUNX1 may have tumor suppressor functions in solid tumors, including gastric and esophageal cancers.
We found loss of the 9p21 region to occur in the early stages (BM and LGD), whereas loss of the p53 locus at 17p13 occurred in the later stages and was one of the most frequent events in the EAC stage. These data are consistent with previous reports that p16 drives the early progression of metaplasia and that p53 inactivation is a late event that permits further genomic instability and promotes aneuploidy (41).
The sizes of the small overlapping regions of amplification ranged from <500 kb to >10 Mb. These regions contained some well-characterized oncogenes or proliferation genes, such as Myc, CDK6, ZNF217, KRAS, CCND1, EGFR, PIK3CA, and VEGF. The most frequent regions of amplification in EAC were 8q24 (containing Myc) and 8p23.1 (containing CTSB; Table 4). Myc is the most overexpressed oncogene in human cancers, whereas CTSB encodes a lysosomal cysteine proteinase. CTSB-deficient mice have been shown to have reduced tumor cell proliferation and cancer cells lacking CTSB have been shown to exhibit resistance to apoptosis (42). Furthermore, the overexpression of CTSB mRNA and protein has been previously observed in EAC compared with normal tissues (43). Therefore, CTSB is a candidate oncogene for EAC.
We found a gradual increase in chromosomal aberrations during the metaplasia-dysplasia-carcinoma sequence, consistent with reports in the literature (9-16). However, there were large inter-sample variations in chromosomal aberrations among tissues with the same histologic stage (Fig. 1), with some samples having no or very few aberrations and some with large numbers of aberrations. For example, among 42 EAC samples, 3 samples did not have any aberrations and 1 sample had only one aberration on chromosome 8q (Fig. 1). Akagi et al (15) recently also reported that some of the EAC samples did not have any chromosome aberrations and suggested that low tumor content in these samples was a possible reason for the lack of detectable aberrations. In our study, most EAC samples have abundant tumor cells (>50% tumor cells in the specimen). We believe that the lack of chromosomal aberrations in some EAC samples are likely due to inherent tumor heterogeneity; however, we cannot rule out that low tumor content in occasional tumor samples may have resulted in no detectable aberrations.
There are a few limitations to this study. This is a cross-sectional study in which all the disease samples were from separate individuals; therefore, we could not test the hypothesis that chromosomal aberrations may be useful biomarkers for predicting the development of EAC in patients with dysplasia. Another, related limitation is that all the premalignant tissues (BM, LGD, and HGD) in this study were obtained from patients who had EAC. Other cross-sectional biomarker studies (e.g., employing SNP-array analysis and gene-expression array) have been conducted in the esophagus and other organ sites (15, 44, 45); like ours, some involved assessments of various tissues of cancer patients. It can be argued that this approach increases the potential to identify high-risk markers because it detects molecular changes (including frequency of a change) in premalignancy that accompanies cancer (versus premalignant molecular changes in noncancer patients). Thus, the approach can complement cross-sectional studies of premalignancy biomarkers (in premalignancy-only patients) versus cancer biomarkers and can complement prospective studies of cancer risk in Barrett’s or other premalignancy patients by identifying candidate high-risk markers for such studies (46).
An additional limitation is that we grouped genetic events that may be biologically distinct into two categories, losses and amplifications, because we did not have an estimate of the fraction of normal tissues present in each sample and it is difficult to separate different aberration types (e.g., copy neutral LOH, LOH, or homozygous deletion) based on log2R ratio when there is substantial normal cell contamination. However, it is not likely that the increasing trend of overall chromosomal aberrations was due to higher percentages of normal tissues in the lower histological stages, because the specific losses of 3p, 9p, and 16q were actually higher in LGD than EAC tissues in this study. Nevertheless, biologically, it would be important to differentiate different types of aberrations to determine the molecular mechanism behind the development of EAC. Future studies are needed to distinguish each specific chromosomal aberration.
In conclusion, the present study provided a high-resolution genome-wide catalogue of chromosomal aberrations at different stages of histological progression from BM to EAC. This study also provided strong evidence that genetic instability, as evidenced by the early and extensive occurrence of microdeletions in CFS regions, and 9p21 loss drive the early progression from metaplasia to dysplasia and that p53 is critical in carcinoma development. Additionally, we identified RUNX1 as a potential TSG for EAC. Finally, we showed that overall chromosomal instability index and specific chromosome aberrations may be associated with neoplastic progression in BM patients.
Supplementary Material
Acknowledgments
Supported by NCI grants CA111922, CA127672, CA129906, a Multidisciplinary Research Program (MRP) grant from The University of Texas MD Anderson Cancer Center, the Premalignant Genome Atlas Program of the Duncan Family Institute for Cancer Prevention and Risk Assessment at MD Anderson Cancer Center, and the Caporella, Park, Smith, Dallas, and Cantu Families and Rivercreet Foundation
References
- 1.Garcia M, Jemal A, Ward EM, et al. Global Cancer Facts & Figures 2007. American Cancer Society; Atlanta, GA: 2007. [Google Scholar]
- 2.Jemal A, Siegel R, Ward E, Hao Y, Xu J, Thun MJ. Cancer statistics, 2009. CA Cancer J Clin. 2009;59:225–49. doi: 10.3322/caac.20006. [DOI] [PubMed] [Google Scholar]
- 3.Horner MJ, Ries LAG, Krapcho M, et al. National Cancer Institute; Bethesda, MD: [based on November 2008]. SEER Cancer Statistics Review, 1975-2006. http://seer.cancer.gov/csr/1975_2006/ SEER data submission, posted to the SEER web site, 2009. [Google Scholar]
- 4.Lagergren J. Adenocarcinoma of oesophagus: what exactly is the size of the problem and who is at risk? Gut. 2005;54(Suppl 1):i1–5. doi: 10.1136/gut.2004.041517. [DOI] [PMC free article] [PubMed] [Google Scholar]
- 5.Enzinger PC, Mayer RJ. Esophageal cancer. N Engl J Med. 2003;349:2241–52. doi: 10.1056/NEJMra035010. [DOI] [PubMed] [Google Scholar]
- 6.Reid BJ, Li X, Galipeau PC, Vaughan TL. Barrett’s oesophagus and oesophageal adenocarcinoma: time for a new synthesis. Nat Rev Cancer. 2010;10:87–101. doi: 10.1038/nrc2773. [DOI] [PMC free article] [PubMed] [Google Scholar]
- 7.Shaheen NJ, Richter JE. Barrett’s oesophagus. Lancet. 2009;373:850–61. doi: 10.1016/S0140-6736(09)60487-6. [DOI] [PubMed] [Google Scholar]
- 8.Schnell TG, Sontag SJ, Chejfec G, et al. Long-term nonsurgical management of Barrett’s esophagus with high-grade dysplasia. Gastroenterology. 2001;120:1607–19. doi: 10.1053/gast.2001.25065. [DOI] [PubMed] [Google Scholar]
- 9.Wu TT, Watanabe T, Heitmiller R, Zahurak M, Forastiere AA, Hamilton SR. Genetic alterations in Barrett esophagus and adenocarcinomas of the esophagus and esophagogastric junction region. Am J Pathol. 1998;153:287–94. doi: 10.1016/S0002-9440(10)65570-8. [DOI] [PMC free article] [PubMed] [Google Scholar]
- 10.Riegman PH, Vissers KJ, Alers JC, et al. Genomic alterations in malignant transformation of Barrett’s esophagus. Cancer Res. 2001;61:3164–70. [PubMed] [Google Scholar]
- 11.Walch AK, Zitzelsberger HF, Bruch J, et al. Chromosomal imbalances in Barrett’s adenocarcinoma and the metaplasia-dysplasia-carcinoma sequence. Am J Pathol. 2000;156:555–66. doi: 10.1016/S0002-9440(10)64760-8. [DOI] [PMC free article] [PubMed] [Google Scholar]
- 12.Li X, Galipeau PC, Sanchez CA, et al. Single nucleotide polymorphism-based genome-wide chromosome copy change, loss of heterozygosity, and aneuploidy in Barrett’s esophagus neoplastic progression. Cancer Prev Res (Phila Pa) 2008;1:413–23. doi: 10.1158/1940-6207.CAPR-08-0121. [DOI] [PMC free article] [PubMed] [Google Scholar]
- 13.Lai LA, Paulson TG, Li X, et al. Increasing genomic instability during premalignant neoplastic progression revealed through high resolution array-CGH. Genes Chromosomes Cancer. 2007;46:532–42. doi: 10.1002/gcc.20435. [DOI] [PubMed] [Google Scholar]
- 14.Paulson TG, Maley CC, Li X, et al. Chromosomal instability and copy number alterations in Barrett’s esophagus and esophageal adenocarcinoma. Clin Cancer Res. 2009;15:3305–14. doi: 10.1158/1078-0432.CCR-08-2494. [DOI] [PMC free article] [PubMed] [Google Scholar]
- 15.Akagi T, Ito T, Kato M, et al. Chromosomal abnormalities and novel disease-related regions in progression from Barrett’s esophagus to esophageal adenocarcinoma. Int J Cancer. 2009;125:2349–59. doi: 10.1002/ijc.24620. [DOI] [PMC free article] [PubMed] [Google Scholar]
- 16.Paulson TG, Reid BJ. Focus on Barrett’s esophagus and esophageal adenocarcinoma. Cancer Cell. 2004;6:11–6. doi: 10.1016/j.ccr.2004.06.021. [DOI] [PubMed] [Google Scholar]
- 17.Koppert LB, Wijnhoven BP, van Dekken H, Tilanus HW, Dinjens WN. The molecular biology of esophageal adenocarcinoma. J Surg Oncol. 2005;92:169–90. doi: 10.1002/jso.20359. [DOI] [PubMed] [Google Scholar]
- 18.Fitzgerald RC. Molecular basis of Barrett’s oesophagus and oesophageal adenocarcinoma. Gut. 2006;55:1810–20. doi: 10.1136/gut.2005.089144. [DOI] [PMC free article] [PubMed] [Google Scholar]
- 19.Peiffer DA, Le JM, Steemers FJ, et al. High-resolution genomic profiling of chromosomal aberrations using Infinium whole-genome genotyping. Genome Res. 2006;16:1136–48. doi: 10.1101/gr.5402306. [DOI] [PMC free article] [PubMed] [Google Scholar]
- 20.Nancarrow DJ, Handoko HY, Smithers BM, et al. Genome-wide copy number analysis in esophageal adenocarcinoma using high-density single-nucleotide polymorphism arrays. Cancer Res. 2008;68:4163–72. doi: 10.1158/0008-5472.CAN-07-6710. [DOI] [PubMed] [Google Scholar]
- 21.Montgomery E, Bronner MP, Goldblum JR, et al. Reproducibility of the diagnosis of dysplasia in Barrett esophagus: a reaffirmation. Hum Pathol. 2001;32:368–78. doi: 10.1053/hupa.2001.23510. [DOI] [PubMed] [Google Scholar]
- 22.Singletary SE, Greene FL, Sobin LH. Classification of isolated tumor cells: clarification of the 6th edition of the American Joint Committee on Cancer Staging Manual. Cancer. 2003;98:2740–1. doi: 10.1002/cncr.11865. [DOI] [PubMed] [Google Scholar]
- 23.Olshen AB, Venkatraman ES, Lucito R, Wigler M. Circular binary segmentation for the analysis of array-based DNA copy number data. Biostatistics. 2004;5:557–572. doi: 10.1093/biostatistics/kxh008. [DOI] [PubMed] [Google Scholar]
- 24.Ilumina Technical Bulletin Whole-Genome Genotyping with the Sentrix® HumanHap300 Genotyping BeadChip and the Infinium™ II Assay. www.illumina.com/technology/publications.
- 25.Rajagopalan H, Nowak MA, Vogelstein B, Lengauer C. The significance of unstable chromosomes in colorectal cancer. Nat Rev Cancer. 2003;3:695–701. doi: 10.1038/nrc1165. [DOI] [PubMed] [Google Scholar]
- 26.Weir B, Zhao X, Meyerson M. Somatic alterations in the human cancer genome. Cancer Cell. 2004;6:433–8. doi: 10.1016/j.ccr.2004.11.004. [DOI] [PubMed] [Google Scholar]
- 27.Bell DW. Our changing view of the genomic landscape of cancer. J Pathol. 2010;220:231–43. doi: 10.1002/path.2645. [DOI] [PMC free article] [PubMed] [Google Scholar]
- 28.Durkin SG, Glover TW. Chromosome fragile sites. Annu Rev Genet. 2007;41:169–92. doi: 10.1146/annurev.genet.41.042007.165900. [DOI] [PubMed] [Google Scholar]
- 29.Lukusa T, Fryns JP. Human chromosome fragility. Biochimica et Biophysica Acta. 2008;1779:3–16. doi: 10.1016/j.bbagrm.2007.10.005. [DOI] [PubMed] [Google Scholar]
- 30.McAvoy S, Ganapathiraju SC, Ducharme-Smith AL, et al. Non-random inactivation of large common fragile site genes in different cancers. Cytogenet Genome Res. 2007;118:260–9. doi: 10.1159/000108309. [DOI] [PubMed] [Google Scholar]
- 31.Smith DI, Zhu Y, McAvoy S, Kuhn R. Common fragile sites, extremely large genes, neural development and cancer. Cancer Lett. 2006;232:48–57. doi: 10.1016/j.canlet.2005.06.049. [DOI] [PubMed] [Google Scholar]
- 32.Maley CC, Galipeau PC, Li X, Sanchez CA, Paulson TG, Reid BJ. Selectively advantageous mutations and hitchhikers in neoplasms: p16 lesions are selected in Barrett’s esophagus. Cancer Res. 2004;64:3414–27. doi: 10.1158/0008-5472.CAN-03-3249. [DOI] [PubMed] [Google Scholar]
- 33.Zhu Y, McAvoy S, Kuhn R, Smith DI. RORA, a large common fragile site gene, is involved in cellular stress response. Oncogene. 2006;25:2901–8. doi: 10.1038/sj.onc.1209314. [DOI] [PubMed] [Google Scholar]
- 34.Coquelle A, Toledo F, Stern S, Bieth A, Debatisse M. A new role for hypoxia in tumor progression: induction of fragile site triggering genomic rearrangements and formation of complex DMs and HSRs. Mol Cell. 1998;2:259–65. doi: 10.1016/s1097-2765(00)80137-9. [DOI] [PubMed] [Google Scholar]
- 35.Huang Y, Boynton RF, Blount PL, et al. Loss of heterozygosity involves multiple tumor suppressor genes in human esophageal cancers. Cancer Res. 1992;52:6525–6530. [PubMed] [Google Scholar]
- 36.Weir BA, Woo MS, Getz G. Characterizing the cancer genome in lung adenocarcinoma. Nature. 2007;450:893–8. doi: 10.1038/nature06358. [DOI] [PMC free article] [PubMed] [Google Scholar]
- 37.Ito Y. RUNX genes in development and cancer: regulation of viral gene expression and the discovery of RUNX family genes. Adv Cancer Res. 2008;99:33–76. doi: 10.1016/S0065-230X(07)99002-8. [DOI] [PubMed] [Google Scholar]
- 38.Perry C, Eldor A, Soreq H. Runx1/AML1 in leukemia: disrupted association with diverse protein partners. Leuk Res. 2002;26:221–8. doi: 10.1016/s0145-2126(01)00128-x. [DOI] [PubMed] [Google Scholar]
- 39.Li QL, Ito K, Sakakura C, et al. Causal relationship between the loss of RUNX3 expression and gastric cancer. Cell. 2002;109:113–24. doi: 10.1016/s0092-8674(02)00690-6. [DOI] [PubMed] [Google Scholar]
- 40.Sakakura C, Hagiwara A, Miyagawa K, et al. Frequent downregulation of the runt domain transcription factors RUNX1, RUNX3 and their cofactor CBFB in gastric cancer. Int J Cancer. 2005;113:221–228. doi: 10.1002/ijc.20551. [DOI] [PubMed] [Google Scholar]
- 41.Barrett MT, Sanchez CA, Prevo LJ, et al. Evolution of neoplastic cell lineages in Barrett oesophagus. Nat Genet. 1999;22:106–9. doi: 10.1038/8816. [DOI] [PMC free article] [PubMed] [Google Scholar]
- 42.Vasiljeva O, Korovin M, Gajda M, et al. Reduced tumour cell proliferation and delayed development of high-grade mammary carcinomas in cathepsin B-deficient mice. Oncogene. 2008;27:4191–9. doi: 10.1038/onc.2008.59. [DOI] [PubMed] [Google Scholar]
- 43.Hughes SJ, Glover TW, Zhu XX, et al. A novel amplicon at 8p22-23 results in overexpression of cathepsin B in esophageal adenocarcinoma. Proc Natl Acad Sci U S A. 1998;95:12410–5. doi: 10.1073/pnas.95.21.12410. [DOI] [PMC free article] [PubMed] [Google Scholar]
- 44.Wang S, Zhan M, Yin J, et al. Transcriptional profiling suggests that Barrett’s metaplasia is an early intermediate stage in esophageal adenocarcinogenesis. Oncogene. 2006;25:3346–56. doi: 10.1038/sj.onc.1209357. [DOI] [PubMed] [Google Scholar]
- 45.Tsafrir D, Bacolod M, Selvanayagam Z, et al. Relationship of gene expression and chromosomal abnormalities in colorectal cancer. Cancer Res. 2006;66:2129–37. doi: 10.1158/0008-5472.CAN-05-2569. [DOI] [PubMed] [Google Scholar]
- 46.Maley CC, Galipeau PC, Finley JC, et al. Genetic clonal diversity predicts progression to esophageal adenocarcinoma. Nat Genet. 2006;38:468–73. doi: 10.1038/ng1768. [DOI] [PubMed] [Google Scholar]
Associated Data
This section collects any data citations, data availability statements, or supplementary materials included in this article.


