

Abstract
Monosodium urate (MSU) and calcium pyrophosphate dihydrate (CPPD) are the most frequently observed crystals in joint space, leading to painful arthropathies. Correct diagnosis of the crystal identity is critical for the appropriate course of treatment. In this work, a custom Raman device in combination with a practical and efficient sample preparation method is used for chemically selective diagnosis of MSU and CPPD crystals in an automated fashion. The samples were prepared by a brief enzymatic digestion treatment of synovial fluid followed by a customized filtration process which was able to congregate crystals over a submillimeter sized spot. The data acquisition and collection was automated to collect multiple spectra distributed over the filtration spot. The performance of the cost-efficient Raman system was compared to a research-grade high fidelity Raman instrument. The custom-designed Raman device could detect MSU crystals at sub-clinical concentration of 0.1 μg/mL, and 1 μg/mL for CPPD crystals. This practical sample preparation approach in tandem with the low-cost customized Raman device has a potential to be a novel tool for point-and-shoot Raman diagnosis of arthritic crystals in synovial fluid at the point of care.
Introduction
Painful arthropathies are often induced by accumulation of crystals in the joint space. Monosodium urate (MSU, leading to gout) and calcium pyrophosphate dihydrate (CPPD, leading to pseudogout) are the most frequently observed crystals types. Gout affects 1%–2% of the adult population and its incidence increases to 7% in men over the age 65 and to 3% females over the age 851, 2. According to the American College of Rheumatology, pseudogout afflicts ~3% of population in their 60s, and as many as 50% of population in their 90s.
Accurate identification of crystal identity is essential in pursuing the appropriate treatment3, 4. Observation of synovial aspirates by polarized light microscopy is the gold standard for diagnosis of gout; however, a noteworthy but unknown fraction of clinicians reach presumptive diagnosis based on clinical symptoms (swelling, redness, pain, presence of tophi, serum urate level, x-rays etc.)5, 6. In this approach, 6 out of 12 criteria should be present to conclude gout (known as the American Rheumatology Association criteria). However, diagnosis by clinical symptoms results in a 30% false negative rate7. While microscopic analysis of fluid aspirates for crystals is feasible in metropolitan hospital settings with operators trained for crystal identification based on compensated birefringence patterns; most gout patients are diagnosed in the primary-care setting which lack trained operators on staff. Therefore, physicians resort to symptom-based diagnosis of gout7. Unlike gout, there are no well-established guidelines for diagnosis of pseudo-gout. Other approaches such as radiographs8, serum urate analysis9, 10 suffer from low sensitivity and/or specificity. Techniques such as electron microscopy11, atomic force microscopy12 and X-ray diffraction12 can provide reliable information on crystals; however, these are technically demanding, expensive methods and they are beyond the reach of most clinical facilities. Therefore, there is a need for an automated and cost-efficient modality that can diagnose crystal species in the synovial fluid.
Raman spectroscopy has been used as a research tool for analysis of synovial aspirates for MSU13, CPPD14 and cholesterol crystals15. In these studies, crystals had to be visually identified and spectral data were collected from individual crystals using high magnification objectives. Previous work from our lab demonstrated that Raman spectroscopy can identify crystals concentrated from synovial aspirates at clinically relevant concentrations16, and showed that the diagnostic performance of Raman analysis compared favorably over polarized microscopic diagnosis in a limited number of clinical samples. Past studies utilized costly research-grade Raman microscopes which occupy considerable bench space.
While Raman spectroscopic diagnosis is unequivocal based on identification of chemical signature; the size, cost and complexity issues need to be addressed so that it is applicable clinically by the non-specialist. The major aim of the current study was to improve the feasibility of using Raman analysis at the point of care by addressing the cost and size issues associated with the method. This aim was attained by: a) developing a disposable syringe-filtration technique for isolating and concentrating crystals at a well-defined submillimeter spot for point-and-shoot Raman analysis; b) integrating a custom Raman system using lower cost components within a shoe-box sized footprint; c) developing a spectral data processing protocol for identification of species. The limit of detection attained by the customized Raman system by using samples prepared by the syringe-filtration method was presented both for MSU and CPPD crystals.
Material and Methods
As an overview, the sample preparation method involved brief digestion of synovial fluid, and microfiltration by a custom-designed syringe mounted cartridge in preparation of samples for point-and-shoot Raman spectroscopy (Fig. 1).
Fig. 1.

Flow chart for isolation and point-of-care detection of arthropathic crystals.
Crystal Synthesis
MSU and CPPD were synthesized following earlier protocols17, 18 which yield crystals with similar size, morphology and birefringence to those found in gout and pseudogout16, 19, as confirmed by compensated polarized imaging and X-ray diffraction earlier.
Synthetic MSU and CPPD crystals were mixed in two different solutions: a) uric acid supplemented phosphate buffer saline (PBS) to determine the limit of detection and to establish calibration curves to estimate crystal concentration; b) non-symptomatic synovial fluid without any history of joint diseases (post-mortem donor, Anatomy Gifts Registry, Hanover, MD) added with known amount of crystals to determine the limit of detection in the presence of synovial matter.
The clinical samples were analyzed in a preliminary capacity to determine whether the developed approach can detect the naturally occurring crystals. Synovial fluids from patients with confirmed presence of crystals were collected from the Metro Health Hospital (Cleveland, OH) under the approval of Institutional Review Board. There were two gout samples with confirmed presence of MSU crystals included in this study.
Digestion of Synovial Fluid
Brief digestion of the hyaluronic acid phase and the inflammatory debris in synovial fluid facilitated the ensuing microfiltration process, and also, improved isolation of native crystals from the protein debris for Raman analysis. Uric acid (Sigma, U2625) was dissolved into x1 PBS at the concentration of 60 μg/mL as the buffer for diluting the synovial fluid. Uric acid supplementation minimized the risk of dissolution of MSU crystals. The buffer was also supplemented with calcium (at 0.14 mg/mL) to prevent dissolution of CPPD20. One mL synovial fluid was added with lyophilized hyaluronidase powder (Sigma, H3506, at 0.5 mg/mL). After 15 minutes digestion by hyaluronidase at room temperature, the fluid was added with Proteinase K powder (Sigma, P2308, at 1 mg/mL), and kept at 37 °C for 45 minutes. The final fluid was diluted with 2 mL uric acid supplemented buffer. The dilution improved the filtration by thinning the synovial sample.
The number of synthetic crystals in fixed sample volumes was counted before and after the digestion to assess whether the digestion process affects crystal integrity. Solution including crystals was applied as 5 μL aqueous droplets on glass slides, and images were acquired at 10 fields of view which were selected randomly. Crystals were counted in each field of view. The average and standard deviation of 10 counts were reported before and after the digestion. Student’s t-test was applied to assess the difference between the crystal number counts before and after digestion.
Crystal Isolation and Concentration by Microfiltration
Isolating and concentrating crystals at a well-defined spot increases the signal from the analyte. Further, positioning the spot at the focal point of a Raman system allows for analyte detection using lower-cost optical components. To this effect, we designed and fabricated a microfilter cartridge. The cartridge is mounted at the tip of a syringe holding the digested synovial fluid (Fig. 2a). The cartridge was custom-made by modifying a 13 mm standard filter holder (Swinnex, Millipore) (Fig. 2b). An epoxy piece was cast (resin, Buehler, 20-8136-128; hardener, Buehler, 20-8138-032) into the inner cavity of the Millipore holder via its outlet port. Following overnight curing, a pocket was milled (~4 mm diameter; ~4 mm in depth) in the epoxy piece to house an aluminum foil disc, a polypropylene (PP) filter membrane (30μm, EMD Millipore, Billerica, MA) and an o-ring (McMaster, 9775K113). The oring guided the incoming fluid flow through a ~0.9 mm diameter spot on the filter where the crystals are retained. The aluminium foil blocked interfering Raman signals from the epoxy. A ~0.9 mm hole was drilled at the center of the epoxy piece, serving as a channel to guide the outlet flow. The digested synovial fluid was pushed through the filter cartridge in less than 1 minute to collect the crystals. Following the filtration, the filter cartridge was inserted to position the spot containing crystals at the focal point of a custom-made cost-efficient automated Raman device (Fig. 3).
Fig. 2.
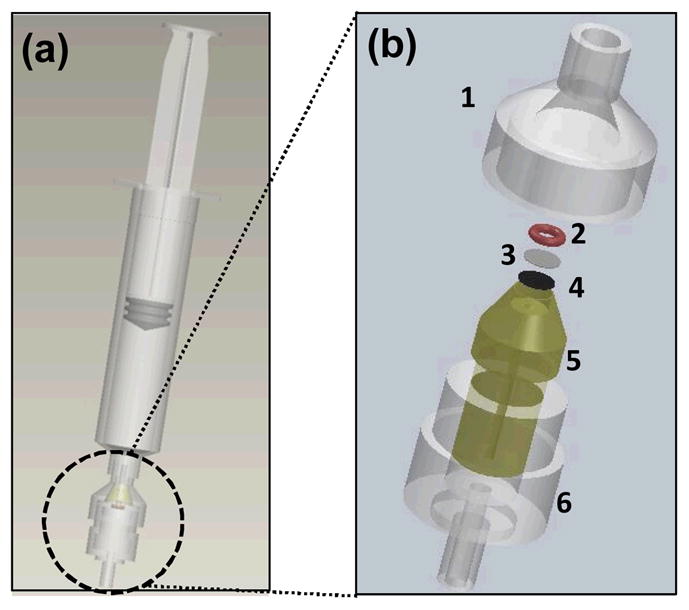
(a) Digested synovial fluid is transferred into a regular syringe mounted with a customized microfiltration cartridge; (b) Components and integration of the microfiltration cartridge: a standard filter holder (1 and 6), an o-ring (2), a filter membrane (3), an aluminium foil disc (4), and an epoxy-cast piece (5).
Fig. 3.

(a) Customized microfilter cartridge inserted in the cost-efficient Raman device (CARD); (b) CARD is mainly composed of an OEM Raman module (1), a receptacle mounted on a translation stage to receive the cartridge (2), a servo motor to move the translation stage (3), and a microcontroller to control the servo motor (4); (c) Laser was directly delivered to the cartridge to illuminate the crystal deposit without having to take the membrane out.
Cost-efficient Automated Raman Device (CARD)
CARD included four major subunits (Fig. 3b): an OEM-Raman system (785L, Wasatch Photonics, NC); a receptacle for insertion of the filter cartridge that was mounted on a translation stage; a servo motor (Hitec, HS-785HB) to move the translation stage; a micro-controller (Arduino Nano) to control the servo motor. The OEM-Raman system included a 100 mW 785 nm laser (Innovative Photonics Solutions, NJ), a f/1.3 thermo-cooled spectrometer integrated with a high sensitive back-thinned low etaloning CCD sensor (Hamamatsu S10420-1006, Bridgewater, NJ) and a gelatin-based volume phase holographic transmission grating (Wasatch Photonics, NC). The spectral resolution was 10 cm−1 with a spectral dispersion of 1.7 cm−1/pixel at 50 mm slit width. Approximately 50 mW laser power was delivered over a ~70 μm spot on the sample via a single lens with 25 mm focal length. Both the Raman system and the servo motor were controlled by a LabVIEW program via USB connection to a laptop computer. The laser was delivered to the crystal deposition through the inlet of the cartridge, without having to take the polypropylene membrane out of the cartridge (Fig. 3c). The mechanical design ensured that the crystal deposited spot was positioned at the focal plane. The device was programmed to acquire spectra from 30 sampling points at ~30 μm step size along an equatorial line on the spot to increase the area surveyed for crystal presence (Fig. 4). For each point, the spectrum was taken by 0.5 second exposure with an average of 60 times at each step. The Labview program synchronized the spectral data acquisition and kinematic movement of the cartridge by controlling the spectrometer and the servo motor differentially.
Fig. 4.
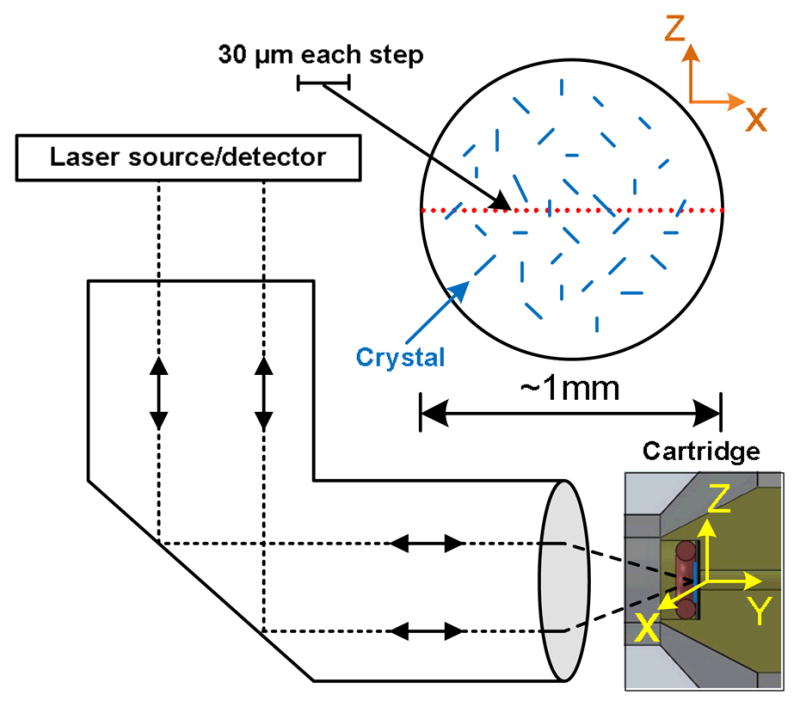
Schema of the 30-point Raman scan along the diameter of the crystals deposit in cartridge. The cartridge was motorized to move along the X direction, while spectra were recorded at 30 sampling points. The overall scan distance was ~ 1mm, and the step size between neighboring points was ~30 μm.
The Raman spectrum acquired at each point was processed to: 1) remove fluorescence background, 2) Raman difference spectroscopy to subtract Raman peaks of the PP membrane filter, 3) correlate the detected peaks with Raman fingerprints of associated crystals to identify crystal species (MSU at 590 and 631 cm−1; CPPD at 1050 cm−1). The fluorescence background was fitted using a 2nd order polynomial. The fluorescence background spectra were removed by subtracting the fitted fluorescence baseline from the raw spectra. The intensities of background corrected spectra were then normalized by the peak intensity at 809 cm−1 originating from the polypropylene membrane only. The peaks originating from the polypropylene were removed by subtracting the normalized spectrum of a pure polypropylene membrane from the normalized spectra of the analyte. Raman difference spectra were analyzed using built-in peak detection algorithms of LabVIEW program. Gout detection was assumed if two major peaks (590 and 631 cm−1) were identified, while pseudogout was determined by the presence of 1050 cm−1 peak. If these peaks were absent then gout/pseudogout was assumed to be absent. For a typical gout sample, the signal to noise ratio of CARD was ~60.
Raman mapping
Raman mapping of sample deposits was conducted using a commercial system (Xplora, Horiba Jobin Yvon, Edison, NJ) to investigate the distribution of clinical crystal deposits on the polypropylene filter-membrane. The system is composed of a laser source at 785 nm, and measurements were performed using a 1200 lines/mm grating, which provided a spectral dispersion of 1.25 pixels/cm−1. The Raman shift measured by the system was calibrated using the 520.7 cm−1 peak of a silicon wafer.
The chemical image map was recorded from the deposit obtained from a patient with confirmed presence of gout crystals following the elucidated digestion and filtration processes. The mapping covered ~1 mm diameter region using a X10 objective (Olympus). The laser power at the objective aperture was set at 30 mW. The 2D map had 25 μm step size along both axes, resulting in collection of 1444 spectra. Each spectrum was obtained as the average of 3 consecutive spectra each collected for 4 seconds each. Chemical image was reconstructed based on the intensity of the 631 cm−1 peak of MSU. Raw spectra were filtered and background subtraction was performed using a commercial software (Labspec v5, Horiba Jobin-Yvon, Edison, NJ).
Scanning Electron Microscopy (SEM)
SEM was used to visually confirm the presence of patient isolated crystals on the polypropylene membrane. The deposit on the membrane was coated with palladium, and the SEM image of the crystal deposit was obtained by FEI Nova Nanolab 200 system.
Limit of Detection (LOD) of CARD
Synthetic MSU crystals were suspended in uric acid supplemented PBS buffer at concentrations of 0.05, 0.1, 1, 2.5, 5, 10, 20, and 50 μg/mL by serial dilution. One millilitre of each solution was pushed through the filter cartridge to retain crystals for analysis by CARD as described earlier. CPPD crystals were prepared using a similar procedure at concentrations of 0.1, 1, 2.5, 5, 10, 20, 50, and 100 μg/mL. The LOD studies started with higher concentrations and samples were serially diluted until the level at which no analyte signal was obtained at any of the 30 observation points at the lower concentration. The concentration value at which at least one observation point provided identifiable analyte signal was reported as the LOD.
MSU crystals were identified by their 631 cm−1 characteristic Raman peak, which originates from the vibration of purine ring21, whereas, CPPD crystals were identified by the peak at 1050 cm−1 originating from the P-O stretch22. To obtain a Raman-based measurement of the amount of crystals, the Raman intensities at these peaks were summed over the thirty points. Samples with greater amount of crystals generated greater summation values. Three samples were examined at each level of concentration. Furthermore, each sample was measured three times after rotating the cartridge about its axis of symmetry randomly. The average value for the summation score (SM) for each specimen was obtained from the three replicate measurement (representing the mean and variation within a given specimen). SM values were further averaged over the three samples at each concentration to determine the mean and variation of the summation over the three samples per concentration point. The summation value for each concentration was plotted against the known crystal concentration to find out the relationship between the crystal amount and summation value of the Raman intensity.
Non-symptomatic synovial fluid was mixed with synthetic MSU/CPPD crystals and digested by the approach explained in digestion treatment section, to prepare the final samples at five different concentrations (0.1, 1, 2.5, 5, 10 μg/mL for MSU, and 1, 10, 25, 50, 100 μg/mL for CPPD). The relationship of Raman intensity versus crystal concentration was also examined for these samples by the same method discussed above. Linear regression was used to evaluate the relationship between the Raman intensity and the crystal concentration.
Results
Synovial samples from symptomatic patients contained organic debris which was observed to be dissolved following the enzymatic digestion (Fig. 5a-5c). Polarized light microscopy demonstrated that clinical MSU crystals were aggregated within the organic debris (Fig. 5d). Following digestion, the debris was released uniformly into the synovial fluid (Fig. 5e), which made the following filtration stage feasible. The overall time of digestion treatment was 60 minutes. The crystal counts before and after digestion were not significantly different (P = 0.41, Fig. 5f).
Fig. 5.

(a–c) Organic debris was gradually dissolved by digestion; (d) before digestion, organic debris including clinical crystals was visible in symptomatic samples; (e) after the digestion, the debris and clinical crystals were uniformly released into synovial fluid. (f) Enzymatic digestion process did not harm synthetic MSU crystals as confirming by crystal counts.
Light and scanning microscopic analysis of clinical sample deposits in the filter cartridge showed a spot with the diameter of ~900 μm (Fig. 6a). The presence of clinical MSU crystals extracted from the patient by filtration was also confirmed by SEM (Fig. 6b and 6c). Chemical image-map of clinical MSU crystals extracted from the patient were generated by the research-grade Raman system (Fig. 6d and 6e), demonstrating that MSU crystals were dispersed across the deposition area at various intensities.
Fig. 6.

(a) Microscopic image of the analyte retained on the microfilter following the processing of the clinical sample collected from a symptomatic joint; (b) SEM image of clinical MSU crystals retained on the polypropylene filter membrane; (c) SEM image of individual clinical MSU crystals (needle shape); (d) the chemical image of clinical MSU crystal distribution over the spot generated by Raman mapping. The step size was 25μm in both directions and there were overall 1444 points sampled to generate the mapping; (e) Representative Raman spectra (background corrected) from three different locations with low, medium and high Raman signal intensities. Colors of spectra are matched to reflect the colormap shown in ‘d’.
Background fluorescence was evident in the raw spectra; however, not to the extent to necessitate photo-bleaching (Fig. 7a). The execution of data processing to remove background fluorescence (Fig. 7b, red trace) and interfering polypropylene filter-membrane related peaks (Fig. 7b, black trace) was successful to the extent that all of the clinical MSU related peaks were recovered following the Raman difference scheme (Fig. 7, green trace).
Fig. 7.

Raman difference spectral analysis of captured data to eliminate peak contributions from the polypropylene (PP) membrane. (a) The raw spectrum of the clinical sample acquired by CARD. (b) Representative Raman spectra of clinical MSU crystals filtered from a patient’s synovial fluid (red). Crystal associated peaks are highlighted by asterisks and the remaining peaks are contributions from the underlying polypropylene filter. Raman spectrum of the pure polypropylene filter is shown in black trace. The difference between the previous two traces is performed to recover the crystal peaks from the original spectrum as shown by the green trace. Synthetic pure MSU spectrum (blue) is included as the reference. Fluorescence background is removed from these spectra, and the spectra were shifted vertically for the sake of clarity.
The coefficient of variation of signal intensity over the three replicate measurements of a given cartridge ranged from 2% to 8%. CARD was able to detect MSU and CPPD crystals at concentrations as low as 0.1 μg/mL and 1 μg/mL, respectively (Fig. 8a and 8b). The summation of Raman signal intensities was linearly related to the known crystal concentrations below 20 μg/mL for MSU (R2=0.998, Fig. 8a), and up to 100 μg/mL for CPPD (R2=0.999, Fig. 8b). Synthetic MSU crystals isolated from PBS buffer exhibited significantly greater Raman intensities than those isolated from non-symptomatic synovial fluid at the concentration from 1 to 10 μg/mL (Fig. 8c), based on Mann-Whitney U test (P = 0.01), while two groups of synthetic CPPD crystals (extracted from PBS vs. non-symptomatic synovial fluid) performed comparable Raman intensities with each other (Fig. 8d).
Fig. 8.

The relationships between the Raman intensity obtained by CARD and crystal concentration are calibrated by mixing known amount of synthetic crystals in aqueous buffer (a,b) as well as non-symptomatic synovial fluid (c,d).
Discussion
This study demonstrated the design and the feasibility of a cost-efficient automated Raman device (CARD) to detect arthritic crystals in synovial fluid. A novel digestion and filtration method was developed to isolate crystals from clinical synovial aspirates and collect them over a submillimeter spot, helping to locate the crystals and improve efficiency of detection of crystals by Raman spectroscopy. The process and instrumentation that is demonstrated at this study has the potential for unbiased and unsupervised diagnosis of crystal species at the point of care, and within one hour of fluid collection. This would eliminate the need for fluid collection, storage and shipment to a certified operator for crystal detection. Such logistics may extend over days and introduce additional time and costs.
The need for practical and reliable methods to detect gout has been raised in authoritative reviews9. At the present, compensated polarized light microscopy (CPLM) is the standard method for diagnosis of crystals in synovial aspirates in clinical settings. CPLM has the perceived advantage of “availability”. An existing microscope in the clinic lab is able to diagnose crystals with an upgrade of polarization optics and a rotatable stage at an extra investment of ~$6,000 and indirect costs of training the operators for crystal identification. Sample preparation includes spreading small droplets of the aspirate on a glass slide, applying a cover-slip, surveying the area in dark-field for birefringent crystals and identifying crystals using compensated polarization based on positive (CPPD) or negative (MSU) birefringence. However, compensated polarized light microscopy has inherent limitations and carries an average false negative rate (FNR) of ~30% (greater FNR rates are possible depending on the operator)9, 23, 24. Analysis of the same set of samples in different labs or by different individuals in the same lab varies substantially9. It takes extensive training and experience to conduct CPLM diagnosis reliably. Such dependence on skill and experience of the operator makes CPLM subjective and not every lab has an experienced operator in staff. Crystals which are weakly birefringent can be missed, a particular limitation for CPPD only 18% of which can be appreciated as birefringent25. In addition, those crystals which are not birefringent such as basic calcium phosphate (BCP), cannot be diagnosed by CPLM. Furthermore, some crystallites are small in size evading the optical microscopic magnifications26, 27. Diagnosis by CPLM is a form of art amenable to human error and it can improve by extensive training and by strict quality control, all of which have high indirect costs. Despite these limitations and unacceptably high misdiagnosis rates, CPLM is falsely perceived to be convenient and reliable. Therefore, the need exists for alternative diagnostic tools.
The primary care settings staffed with trained operators will resort to synovial aspirate collection which is accepted as the preferred method for diagnosis of gout/pseudogout. Community health centers without trained operators will reach a presumptive diagnosis based on the presence of symptoms6 (so called ARA criteria) without collecting synovial fluid. ARA criteria based diagnosis carries a false negative rate of 30%7. If such centers had a technology that reached the diagnosis without significant training, they would have considered synovial fluid collection. It is at this juncture the technologies such as the ones we are reporting may change the current practice.
The training associated with the implementation of the current approach is minimal and would pertain almost entirely to sample preparation. In the clinical setting, the synovial fluid would be mixed with pre-packaged digestive enzyme solutions in a sequential fashion to streamline and facilitate the execution of sample preparation. Otherwise, no training (or judgment of the operator) is required in the decision process. The conclusion of detection is reached by the software based on the absence or presence of peaks.
Synovial fluid could not be pushed through the filter membrane without digestion. However, the filtration and successful isolation of crystals becomes possible following the digestion. Hyaluronidase and proteinase K were applied in sequence to digest different phases of synovial fluid. Hyaluronidase was used to cleave hyaluronic acid to reduce the viscosity of synovial fluid, and proteinase K dissolved organic debris to release intracellularly aggregated crystals. The burden of organic debris varies from individual to individual sample, due to the various intensities of inflammation. Additional 30 min digestion by proteinase K is recommended for heavily burdened samples.
A potential concern was whether the digestion steps affect crystal integrity. This risk was mitigated by using a solution that is buffered with uric acid and calcium. Crystal counts before and after digestion confirmed that the supplementation process was effective. The concentrations of uric acid and calcium are below the nucleation thresholds20; therefore, artifactual initiation of crystal growth was unlikely and was not observed in our samples. Another benefit of the digestion process was to solubilize excess proteins which otherwise would accumulate at the collection spot. Such accumulations would not only hinder crystal related information, but also would have presented background fluorescent interference.
The custom designed filtration cartridge was able to guide and constrict the flow of the synovial fluid through a submillimetric region, retaining crystals over a 0.9 mm diameter spot. Congregating crystals within a small and defined area increased the likelihood of identification by Raman spectroscopy rapidly. While the PP membrane did not have any peaks interfering with the analyte-related peaks, the peaks from the epoxy cast were observed to overlap with the peaks of interest at the early stages of the investigation. Utilization of an aluminium foil layer eliminated the epoxy interference. At the present, custom machining and component integration is needed to fabricate the filter cartridge. In a commercial application, the entire filter cartridge can be produced on a large scale by injection molding.
Raman mapping indicated that crystals were distributed across the entire deposit at different intensities. The method of scanning along the equatorial axis of the spot increased the detection limit of point-and-shoot Raman spectroscopy in the crystal detection. A controlled servomotor was used to motorize the custom filter cartridge, while the spectrometer was able to be synchronized with the motorization of the cartridge, making the data acquisition fully automated. The step size was set at the radius of the laser spot size. Smaller step sizes than what we employed would have prolonged data collection unduly.
The rotational cartridge receptacle (Fig. 3a) on the translation stage was designed to position the sample deposit at the focal plane of laser. All components of CARD were fit within a footprint of 10″ × 12″, a size that is suitable for clinical environment. The process eliminates subjectivity in the diagnosis of gout, an advantage over the PLM-based diagnosis which is operator dependent28. Previously we reported that the fluorescence spectra of raw and digested synovial samples to be comparable, indicating that digestion did not increase the background fluorescence29. Although filtration had discarded the organic material from the synovial fluid and digestive enzymes, there was residual organic matter in the crystals deposit, leading to background fluorescence in the Raman spectra. The fluorescence varied from sample to sample. However, the existing fluorescence was addressed by using short integration time (0.5 s) and high number of averages over a total duration of ~1 min (Fig. 7a), such that the fluorescence did not saturate the readings. Fluorescence background and filter background (interfering filter related peaks) had to be removed from the raw spectra to recover Raman signal of crystal associated peaks. The agreement between the processed spectrum of clinical MSU crystals (Fig. 7b, green trace) and the reference spectrum of synthetic MSU crystals (Fig. 7b, blue trace) indicated that for highly concentrated samples, most peaks (491, 590, 631cm−1, etc.) were able to be recovered after the background correction. For samples with low crystal concentrations, several minor peaks cannot be retained after the correction. However, the main MSU associated peaks at 590 and 631 cm−1 and CPPD associated peaks at 1050 cm−1 were sufficient for confirming the existence of crystals in this application.
Clinically, the crystals are reported to be in the range of 10~100 μg/mL30; however, this range is reported anecdotally. The limit of detection by CARD (0.1 μg/mL for MSU and 1 μg/mL for CPPD) is substantially below the range of the clinically reported crystal concentration. Therefore, CARD holds the potential to improve the sensitivity of gout detection and provide an earlier diagnosis of crystals related arthritis. At higher concentrations, all of the 30 spectra displayed crystal peaks. With further dilution, the fraction of spectra demonstrating the analyte signal declined gradually. There were ~5 out of 30 spectra in which crystals associated peaks could be observed at the lowest detectable concentrations. Concentrations below the LOD did not provide any spectra with detectable intensities from the analytes.
The morphology of CPPD crystals is more compact than MSU crystals31. For the same mass, the quantity of individual MSU crystal is significantly higher than CPPD crystals, indicating that it is easier for point-and-shoot Raman spectroscopy to capture MSU than CPPD at the same concentration in this application. As a result, the LOD for MSU was lower than that of the CPPD crystals. MSU crystals isolated from PBS buffer presented greater Raman signal intensities than those isolated from synovial fluid (Fig. 8a and 8c), since the thin shape of MSU crystals made their Raman signal more easily be attenuated by residual organic phase on the membrane when isolated from synovial fluid. This did not happen to CPPD crystals due to their thicker brick-like shape.
The Raman intensity was linearly related to the concentration under 10 μg/mL for MSU crystals. Therefore, the developed method allows for estimating the amount crystals in the liquid, something that has not been achieved in the literature by other methods to the best of our knowledge. Beyond 10 μg/mL, the thickness of the crystal deposit layer exceeded the focal volume. Therefore, the Raman intensity beyond 10 μg/mL gradually reached a steady state value. Only linear ranges were reported in Fig. 7a and 7b. For samples with greater concentrations of crystals, the existing cartridge system can be modified to increase the spot size, or, a smaller amount of liquid can be filtered to limit the amount of crystal deposition.
Conclusions
The current research demonstrated a rapid, cost-efficient, and automated method for detection of crystals leading to joint arthropathies by Raman spectroscopy. The cost-efficient and automated Raman device (CARD) including a practical sample preparation approach allows detection of clinically relevant concentration of arthritic crystals in synovial fluid using a low-cost Raman system ($15k). Clinically, samples are retrieved with a syringe by aspiration from joint space. Therefore, the utilization of syringe filter is convenient. The filter holder and filter are available commercially (e.g. Millipore) and our method requires the addition of a simple insert that restrains the flow to a smaller area, thereby, concentrating the analyte. Filtration concept developed in this work can be executed clinically in a disposable manner and at a minimal cost. Studies are currently under way to assess CARD on a large clinical sample set to derive a refined estimate of its sensitivity and specificity relative to the current clinical standard of polarized light microscopy.
Acknowledgments
The authors thank Dr. Nora Singer, Emma Barnboym and Dianne Morus (at MetroHealth Medical Center) for coordination of the collection of the clinical sample. This study was funded by the research grant R01AR057812 (OA) from the NIAMS institute of NIH. Its contents are solely the responsibility of the authors and do not necessarily represent the official views of the NIH.
References
- 1.Lawrence RC, Helmick CG, Arnett FC, Deyo RA, Felson DT, Giannini EH, Heyse SP, Hirsch R, Hochberg MC, Hunder GG, Liang MH, Pillemer SR, Steen VD, Wolfe F. Arthritis Rheum. 1998;41:778–99. doi: 10.1002/1529-0131(199805)41:5<778::AID-ART4>3.0.CO;2-V. [DOI] [PubMed] [Google Scholar]
- 2.Mikuls TR, Farrar JT, Bilker WB, Fernandes S, Schumacher HR, Jr, Saag KG. Ann Rheum Dis. 2005;64:267–72. doi: 10.1136/ard.2004.024091. [DOI] [PMC free article] [PubMed] [Google Scholar]
- 3.Radcliffe K, Pattrick M, Doherty M. Br Med J (Clin Res Ed) 1986;293:440–1. doi: 10.1136/bmj.293.6544.440. [DOI] [PMC free article] [PubMed] [Google Scholar]
- 4.Beutler A, Schumacher HR., Jr Postgrad Med. 1994;95:103-6, 109. 113-6 passim. [PubMed] [Google Scholar]
- 5.Mandell BF, Edwards NL, Sundy JS, Simkin PA, Pile JC. Cleve Clin J Med. 2010;77:S2–S25. doi: 10.3949/ccjm.77.s2.01. [DOI] [PubMed] [Google Scholar]
- 6.Schlesinger N. American Journal of Managed Care. 2005;11:S443–S450. [PubMed] [Google Scholar]
- 7.Malik A, Schumacher HR, Dinnella JE, Clayburne GM. Jcr-Journal of Clinical Rheumatology. 2009;15:22–24. doi: 10.1097/RHU.0b013e3181945b79. [DOI] [PubMed] [Google Scholar]
- 8.Devauchelle-Pensec V, Berthelot JM, Jousse S, Samjee I, Josseaume T, Colin D, Chales G, Thorel JB, Hoang S, Martin A, Youinou P, Le Goff P, Saraux A. J Rheumatol. 2006;33:1511–5. [PubMed] [Google Scholar]
- 9.Swan A, Amer H, Dieppe P. Annals of the Rheumatic Diseases. 2002;61:493–498. doi: 10.1136/ard.61.6.493. [DOI] [PMC free article] [PubMed] [Google Scholar]
- 10.Zhang W, Doherty M, Pascual E, Bardin T, Barskova V, Conaghan P, Gerster J, Jacobs J, Leeb B, Liote F, McCarthy G, Netter P, Nuki G, Perez-Ruiz F, Pignone A, Pimentao J, Punzi L, Roddy E, Uhlig T, Zimmermann-Gorska I. Ann Rheum Dis. 2006;65:1301–11. doi: 10.1136/ard.2006.055251. [DOI] [PMC free article] [PubMed] [Google Scholar]
- 11.Gatter RA, Owen DS. Crystal Identification and Joint Fluid Analysis. In: Smyth CJ, Holers VM, editors. Gout, Hyperuricemia, and Other Crystal-Associated Arthropathies. New York: Marcel Dekker; 1999. pp. 15–28. [Google Scholar]
- 12.Gathercole L, Swan A, Price G, Dieppe P. Journal of Materials Science, Materials in Medicine. 1996;7:511–516. [Google Scholar]
- 13.McGill N, Dieppe PA, Bowden M, Gardiner DJ, Hall M. Lancet. 1991;337:77–78. doi: 10.1016/0140-6736(91)90738-b. [DOI] [PubMed] [Google Scholar]
- 14.Maugars YM, Peru LF, el Messaoudi B, Michaud GO, Berthelot JM, Prost AM, Daculsi G. J Rheumatol. 1994;21:573–576. [PubMed] [Google Scholar]
- 15.Hawi SR, Nithipatikom K, Wohlfeil ER, Adar F, Campbell WB. J Lipid Res. 1997;38:1591–1597. [PubMed] [Google Scholar]
- 16.Cheng X, Haggins DG, York RH, Yeni YN, Akkus O. Appl Spectrosc. 2009;63:381–386. doi: 10.1366/000370209787944280. [DOI] [PubMed] [Google Scholar]
- 17.McCarty DJ, Faires JS. Curr Ther Res Clin Exp. 1963;5:284–290. [PubMed] [Google Scholar]
- 18.Pouliot M, James MJ, McColl SR, Naccache PH, Cleland LG. Blood. 1998;91:1769–1776. [PubMed] [Google Scholar]
- 19.Fam AG, Schumacher HR, Clayburne G, Sieck M, Mandel NS, Cheng PT, Pritzker KPH. Journal of Rheumatology. 1992;19:780–787. [PubMed] [Google Scholar]
- 20.Bennett RM, Lehr JR, McCarty DJ. J Clin Inves. 1975;56:1571–1579. doi: 10.1172/JCI108239. [DOI] [PMC free article] [PubMed] [Google Scholar]
- 21.Kodati VR, Tu AT, Turumin JL. Appl Spectrosc. 1990;44:1134–1136. [Google Scholar]
- 22.Miura K, Fukuda H, Mineta H, Yamaguchi K, Harada H, Yusa H, Tsutsui Y. Pathology International. 2000;50:992–998. doi: 10.1046/j.1440-1827.2000.01138.x. [DOI] [PubMed] [Google Scholar]
- 23.Dieppe P, Swan A. Ann Rheum Dis. 1999;58:261–263. doi: 10.1136/ard.58.5.261. [DOI] [PMC free article] [PubMed] [Google Scholar]
- 24.Segal JB, Albert D. Arthritis Care Res. 1999;12:376–380. doi: 10.1002/1529-0131(199912)12:6<376::aid-art5>3.0.co;2-5. [DOI] [PubMed] [Google Scholar]
- 25.Ivorra J, Rosas J, Pascual E. Ann Rheum Dis. 1999;58:582–584. doi: 10.1136/ard.58.9.582. [DOI] [PMC free article] [PubMed] [Google Scholar]
- 26.Swan A, Chapman B, Heap P, Seward H, Dieppe P. Ann Rheum Dis. 1994;53:467–470. doi: 10.1136/ard.53.7.467. [DOI] [PMC free article] [PubMed] [Google Scholar]
- 27.Bjelle A, Crocker P, Willoughby D. Acta Med Scand. 1980;207:89–92. [PubMed] [Google Scholar]
- 28.Rosenthal AK, Mandel N. Curr Rheumatol Rep. 2001;3:11–16. doi: 10.1007/s11926-001-0045-y. [DOI] [PubMed] [Google Scholar]
- 29.Yang S, Li B, Slipchenko MN, Akkus A, Singer NG, Yeni YN, Akkus O. J Raman Spectrosc. 2013;44:1089–1095. doi: 10.1002/jrs.4338. [DOI] [PMC free article] [PubMed] [Google Scholar]
- 30.Gordon C, Swan A, Dieppe P. Annals of the Rheumatic Diseases. 1989;48:737–742. doi: 10.1136/ard.48.9.737. [DOI] [PMC free article] [PubMed] [Google Scholar]
- 31.Pascual Eliseo, Jovani Vega. Best Practice Research Clinical Rheumatology. 2005;19:371–386. doi: 10.1016/j.berh.2005.01.004. [DOI] [PubMed] [Google Scholar]