Significance
Stroke is a devastating illness second only to cardiac ischemia as a cause of death worldwide. Long-time attempts to salvage dying neurons and preserve neurological functions via various neuroprotective agents have failed, owing at least in part to medical science’s limited knowledge of ischemia-induced elements that participate in irreversible neurovascular damage. The present study was performed to understand the role of natural killer (NK) cells, a key member of the innate immune system, in stroke. We discovered that NK cells infiltrated the brains of stroke patients and mice with induced stroke. Multiple pathways by which NK cells exacerbate brain infarction are discovered. This study revealed the role of NK cells in the pathogenesis of stroke.
Keywords: innate immunity, middle cerebral artery occlusion, ischemic stroke
Abstract
Brain ischemia and reperfusion activate the immune system. The abrupt development of brain ischemic lesions suggests that innate immune cells may shape the outcome of stroke. Natural killer (NK) cells are innate lymphocytes that can be swiftly mobilized during the earliest phases of immune responses, but their role during stroke remains unknown. Herein, we found that NK cells infiltrated the ischemic lesions of the human brain. In a mouse model of cerebral ischemia, ischemic neuron-derived fractalkine recruited NK cells, which subsequently determined the size of brain lesions in a T and B cell-independent manner. NK cell-mediated exacerbation of brain infarction occurred rapidly after ischemia via the disruption of NK cell tolerance, augmenting local inflammation and neuronal hyperactivity. Therefore, NK cells catalyzed neuronal death in the ischemic brain.
Brain hypoxia during stroke activates innate and adaptive immune responses via induction of a transcriptional reprogramming of genes that encode oxygen-sensing prolyl-hydroxylase enzymes (1), which in turn promote posttranscriptional activation of inflammatory signaling pathways that control the stability of hypoxia-induced factor 1 and nuclear factor-κB (1). At the cellular level, ischemia, reperfusion, and cell death trigger a cascade of events that include the release of acute inflammatory mediators, such as TNF, IL-1β, arachidonic acid metabolites, reactive oxygen species (ROS), nitric oxide, and matrix metalloproteinases, up-regulation of adhesion molecules E- and P-selectin on endothelial cells, and breakdown of the blood–brain barrier (1–3). These events lead to leukocyte extravasation, the engagement of pattern-recognition molecules such as Toll-like receptors, activation of the complement system, and recruitment and activation of lymphocytes (1). In this context it has recently been shown that adaptive immune T and B cells exacerbate stroke lesions (4–6), whereas regulatory T cells seem to confer a protective role in late stages of stroke (7).
Ischemia-triggered brain tissue damage occurs rapidly (i.e., within hours after the cessation of blood and oxygen supply), well before the activation of antigen-specific T and B cells. It is therefore challenging to understand how adaptive lymphocytes contribute to stroke in acute stages, before becoming primed with brain antigens. It is also not clear how regulatory T cells provide protection in late stages of stroke, when lesions have become stable (5, 8). IL-17–producing γδ T cells have been shown to play a pivotal role in the delayed phase of ischemic brain injury, but not in the early stages (8). Natural killer (NK) T cells, a subpopulation of T cells with an invariant T-cell receptor, seem not to impact stroke (5). Notably, the abrupt development of brain lesions suggests that innate immune cells may shape infarct formation in the early stages of stroke. However, little is known to date about the roles of specific innate lymphocyte subsets early in a stroke’s inception. NK cells are CD3– innate lymphocytes and among the first immune cells that respond to a pathogen insult. NK cells orchestrate both the innate and adaptive immune responses via their cytolytic activity without prior sensitization and produce an early burst of cytokines. Moreover, NK cells readily home to the central nervous system (CNS) in numerous neurological conditions (9). Given the prompt nature of the NK cell response and rapid evolution of stroke lesions, we postulated that NK cells would play a major role in stroke.
Results
Accumulation of NK Cells in the Cerebral Infarct in Stroke.
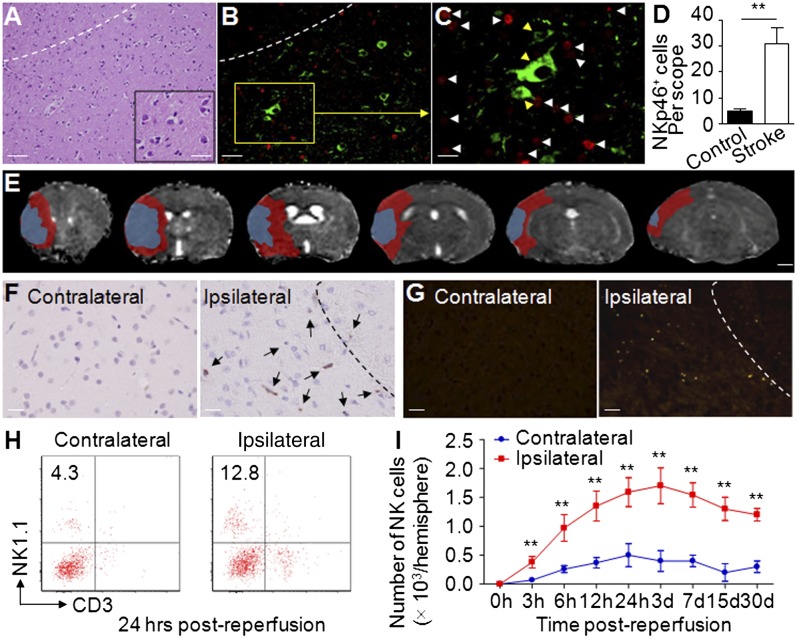
To address the possible function of NK cells during strokes, we stained NKp46+ NK cells in brain slices from patients with acute middle cerebral artery ischemic stroke. NKp46 (NCR1, CD335) is a specific NK cell marker both in humans and in mice (10). By using immunofluorescence staining, we found that NKp46+ cells infiltrated the infarct and periinfarct areas (Fig. 1 A, B, and D), accumulating in close proximity to ischemic neurons (Fig. 1C). In mice, we induced a standard 90-min reversible ischemia (occlusion–reperfusion) via transient middle cerebral artery occlusion (MCAO) (7, 8, 11). Seven-Tesla (7T) rodent MRI was used in conjunction with 2,3,5-triphenyltetrazolium chloride (TTC) staining (Fig. S1) to measure infarct size. The diffusion and perfusion deficit detected 24 h after MCAO by apparent diffusion coefficient and the cerebral blood flow maps of 7T MRI showed a mismatch (approximates ischemic penumbra) at sites where most cells infiltrated (Fig. 1E). Immunostaining revealed accumulations of NKp46+ cells in the periinfarct areas (Fig. 1F, Right).
Fig. 1.
Accumulation of NK cells in brain infarct. (A) A brain section from patient with acute middle cerebral artery ischemic stroke shows infiltrating inflammatory cells, predominantly located in the infarct and periinfarct area. (B) Infiltrating NKp46+ cells (red) in the infarct and periinfarct areas on brain slices from a patient with middle cerebral artery ischemic stroke. (C) NK cells (white arrowheads) are in close proximity to ischemic neurons (yellow arrowheads) in the periinfarct area (green, βIII-tubulin; red, NKp46; blue, DAPI). For A–C, representative sections of a patient with MCAO. (D) Quantification of NK cells infiltrating in brain sections from patients with MCAO. n = 8 for stroke patients; n = 6 for nonneurological disease controls. (E) Representative perfusion–diffusion mismatch in a WT MCAO mouse. Blue indicates abnormal diffusion area, whereas red indicates the ischemic penumbra as defined by perfusion–diffusion mismatch. (Scale bar, 1.5 mm.) (F) Immunohistochemical staining of NKp46+ NK cells in MCAO brain paraffin sections. NK cells (arrows) were predominantly located in periinfarct areas (areas separated by dashed line). Data were acquired from 12 WT mice, 24 h after MCAO. (G) Accumulation of NKp46+ NK cells in MCAO brain was confirmed in NK1.1-tdTomato transgenic mice by immunostaining. NK cells are labeled with the red chromophore tdTomato in this strain. Infiltration of NK cells (red) was further confirmed by immunofluorescent staining with antibody to NKp46 (green). The yellow (merged) dots indicate that NK cells were primarily in periinfarct areas (separated by dashed line) at 24 h after MCAO. Data are from 12 mice. (H and I) Time courses of NK cells infiltrating the ipsilateral hemisphere. Cell infiltrates were isolated from brain homogenates. Kinetics of NK cell infiltration over the course of stroke were quantified by FACS. Experiments were repeated five times; n = 12 mice per group per time point. [Scale bars, 40 μm (A, Left), 10 μm (A, Inset), 40 μm (B), 20 μm (C), 1 mm (E), 50 μm (F and G).] **P < 0.01.
To further confirm the infiltration of NK cell, we induced MCAO in NK1.1-tdTomato transgenic mice, in which a red fluorescent protein (tdTomato) reporter gene was knocked into the NK1.1 allele (Fig. S2 A and B). NK1.1 (NKR-P1C) is a marker of NK cells in C57BL/6 mice (12). First, flow cytometry analysis confirmed that NK1.1-tdTomato+ cells from the transgenic mouse were also NKp46+ (Fig. S2C). Next, MCAO induction in NK1.1-tdTomato mice resulted in NK1.1-tdTomato+ NK cells infiltration throughout the infarct hemisphere, principally localized in periinfarct areas (Fig. 1G). Kinetic experiments showed that NK cells accumulated as early as 3 h after MCAO, peaked at day 3 after MCAO, then moderately declined (Fig. 1 H and I). Of note, NK cells were still detectable as late as 30 d after MCAO (Fig. 1I). These results indicate that NK cells rapidly accumulate in the ischemic brain.
Ischemic Neuron-Derived CX3CL1 Recruits NK Cells to the Infarct Site.
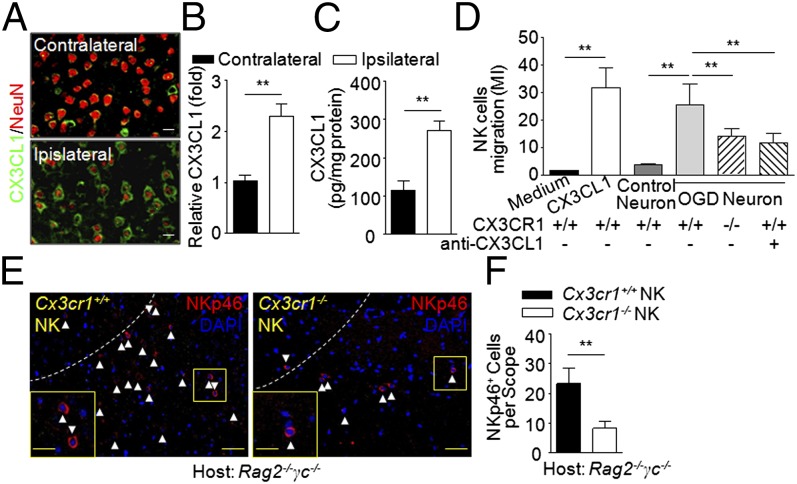
CX3CL1 is the main chemokine attracting CX3CL1 receptor (CX3CR1)-expressing NK cells to the CNS (13, 14). In line with previous reports that neurons are the major source of CX3CL1 in the brain (15), we found that the infarcted hemisphere contained a significantly larger amount of CX3CL1 than the contralateral hemisphere in brain sections (Fig. 2 A and B) and in brain homogenates (Fig. 2C) of MCAO mice. Next, NK cell chemotaxis to CX3CL1 was confirmed in vitro by coculture of cortical neurons and NK cells in a transwell migration assay (16). Cultured cortical neurons were subjected to hypoxic conditions by combined oxygen–glucose deprivation (OGD) for 60 min, a condition that mimics ischemia in vivo. The results from transwell migration assays showed that OGD neuron-conditioned medium attracted CX3CR1-bearing (Cx3cr1+/+) but not CX3CR1-deficient (Cx3cr1−/−) NK cells. Moreover, the migration of Cx3cr1+/+ NK cells toward OGD neurons was inhibited by anti-CX3CL1 mAb (Fig. 2D). In addition, we adoptively transferred Cx3cr1+/+ or Cx3cr1−/− NK cells from WT or Cx3cr1−/− mice (Fig. S3) into Rag2−/−γc−/− mice (lacking NK cells) and then induced MCAO. As a result, the ischemic brains of Rag2−/−γc−/− mice given Cx3cr1+/+ NK cell transfers contained more NKp46+ cells than those of Rag2−/−γc−/− recipients of Cx3cr1−/− NK cells (Fig. 2 E and F). These transferred NK cells survived throughout the experiment (up to 30 d; Fig. S4). Thus, enhanced production of CX3CL1 by ischemic neurons attracts NK cells into brain lesions through the presence of CX3CR1 in acute stroke.
Fig. 2.
Ischemic brain-derived fractalkine attracts NK cells. (A and B) Immunostaining (A) and quantification (B) of CX3CL1 in MCAO brain slices tracked in 12 mice 24 h after MCAO. (Scale bars, 7 μm.) (C) Quantification of CX3CL1 in MCAO brain homogenates (pg/mg protein) by ELISA. Tissues were obtained 24 h after MCAO. n = 8. (D) Transwell assays show that NK cell migration was driven by ischemic neuron-derived CX3CL1. Cx3cr1+/+ (WT) or Cx3cr1−/− NK cells (2 × 10⁵) seeded on transwell inserts. The lower chambers of the transwells received soluble CX3CL1 (10 nM), control neurons, ischemic neurons, ischemic neuron plus anti-CX3CL1 antibody, or no stimulus. Subsequently, cell migration index (MI) was assayed: number of cells migrating toward chemoattractants/number of cells migrating toward medium in the absence of any stimulant. Bars represent means of triplicate wells from three independent experiments. **P < 0.01. (E and F) Deficiency of CX3CR1 impaired NK cell-homing into the ischemic brain. NK cells were sorted from pooled splenocytes of Cx3cr1+/+ or Cx3cr1−/− mice. Purified Cx3cr1+/+ or Cx3cr1−/− NK cells (>99%; Fig. S3) were passively transferred (i.v. 5 × 10⁵ per mouse) into Rag2−/−γc−/− recipients before MCAO. (E) Representative images show more NKp46+ cells in brains of Rag2−/−γc−/− MCAO mice given Cx3cr1+/+ NK cell transfers compared with recipients of Cx3cr1−/− NK cell transfers 24 h after MCAO. Dotted lines indicate border of infarct. [Scale bars, 40 μm; 20 μm (Inset).] (F) The quantification of transferred NK cells infiltrating into the ipsilateral hemispheres 24 h after MCAO was graphed. **P < 0.01.
NK Cells Determine the Size of Brain Infarct.
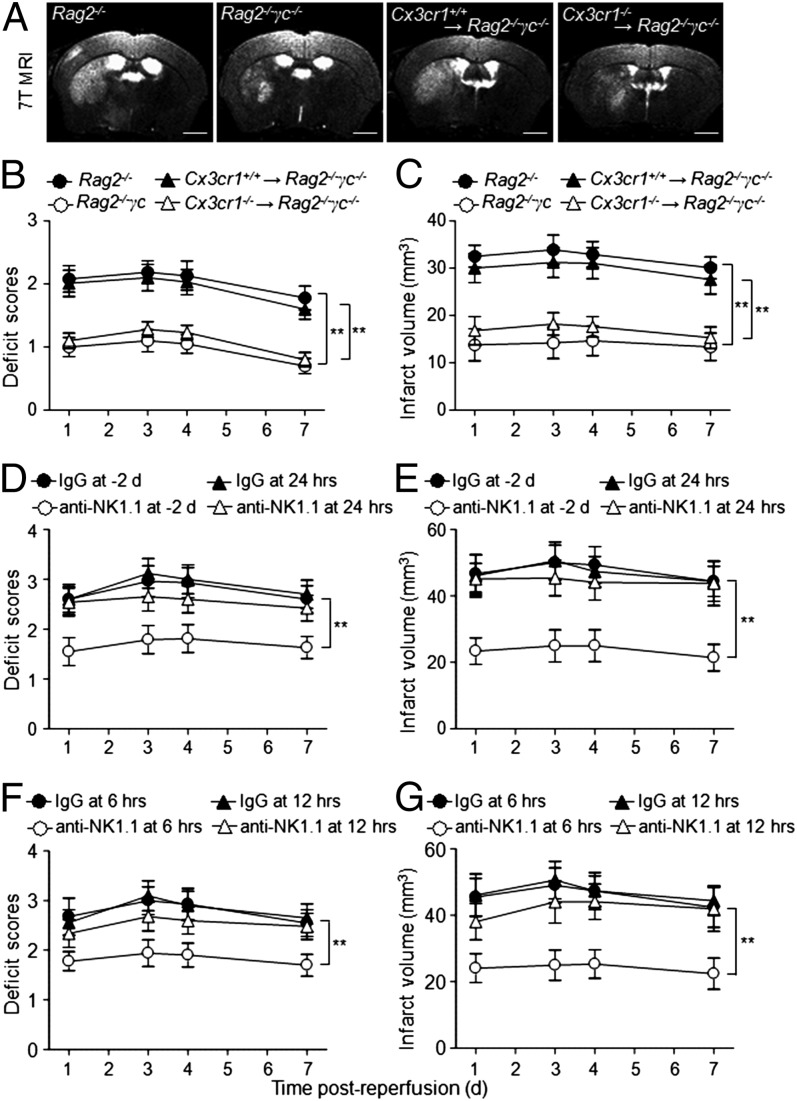
To understand whether NK cells contribute to the neurological outcome and size of cerebral lesions, we compared the ischemic lesion volume in Rag2−/− (lacking T, NKT, and B cells) and Rag2−/−γc−/− (lacking T, NKT, B, and NK cells) mice after MCAO. We found that Rag2−/−γc−/− mice, when devoid of NK cells, had smaller infarct areas (Fig. 3 A and C) and less neurological deficits (Fig. 3B) than Rag2−/− mice, suggesting that NK cells might favor cerebral infarction independently of T, NKT, and B cells. The observed effects on infarct lesions persisted for at least 7 d after MCAO (Fig. 3C). This result suggests that the detrimental effects of NK cells in stroke are independent of T, NKT, and B cells.
Fig. 3.
NK cells are associated with brain infarct volume. (A–C) Representative 7T MRI images (A) and quantification of neurological deficits (B) and infarct volumes (C) in MCAO mice with NK cells (Rag2−/−) vs. without NK cells (Rag2−/−γc−/−), as well as more (Cx3cr1+/+ NK→Rag2−/−γc−/−) vs. less (Cx3cr1−/− NK→Rag2−/−γc−/−) NK cells in the brain. Rag2−/−γc−/− MCAO mice had relatively mild neurological deficits and smaller infarct volumes than Rag2−/− MCAO mice. Reconstitution of Cx3cr1+/+ but not Cx3cr1−/− NK cells restored the ischemic lesions in Rag2−/−γc−/− mice. Data generated from 15 mice per group. **P < 0.01. (Scale bars, 1 mm.) (D–G) Determination of the time window in which NK cells exert detrimental effects in stroke. WT mice were treated with anti-NK1.1 mAb or isotype control IgG Ab 2 d before MCAO or at 6, 12, and 24 h after reperfusion, respectively. Treatment regimen and efficiency of cell depletion are described elsewhere (16, 30). Neurological deficits (D and F) were assessed, and infarct volumes (E and G) were determined by MRI in conjunction with TTC staining. Attenuation was more pronounced when NK cells were depleted preceding MCAO or within the first 12 h after MCAO. n = 8 per group. **P < 0.01.
Having determined that NK cell-homing to the ischemic brain is mediated by CX3CR1 (Fig. 2), we further pursued the role of NK cells in stroke by passively transferring Cx3cr1+/+ NK cells into Rag2−/−γc−/− mice and then inducing MCAO. Notably, the adoptive transfer of Cx3cr1+/+, but not Cx3cr1−/− NK cells, significantly increased brain infarct size in Rag2−/−γc−/− MCAO mice (Fig. 3 A and C), further supporting the concept that the extent of homing of NK cells to the brain in stroke affects infarct size.
To confirm that NK cells determine infarct size in stroke, we induced ischemia in WT mice given anti-NK1.1 mAb 2 d before the induction of MCAO. NK1.1+ cells (NK and NKT cells) can be efficiently depleted with anti-NK1.1 mAb, as previously reported (16). WT mice treated with isotype IgG served as controls. In MCAO mice treated with anti-NK1.1 mAb, we found smaller infarcts and milder neurological deficits than in the IgG controls (Fig. 3 D and E). Because NKT cells do not influence stroke significantly (5), the observed effects of anti-NK1.1 mAb treatment can be attributed to NK cell depletion. Taken together, these data demonstrate that NK cells are a key lymphocyte determinant of brain infarct size in stroke.
Detrimental Effect of NK Cells on Stroke Has a ∼12-h Limit.
To define the time window during which NK cells exert their impact on stroke, we administered anti-NK1.1 mAb to deplete NK cells (16) or isotype control IgG to groups of mice at 6, 12, and 24 h after MCAO. We found that NK cell depletion at 6 h after MCAO attenuated neurological deficits and infarct volume (Fig. 3 D–G), similarly to the NK cells depletion 2 d before MCAO shown above. Hence, attenuation was pronounced within the first 12 h after MCAO (Fig. 3 D–G).
Ischemic Neurons Ablate NK Cell Tolerance.
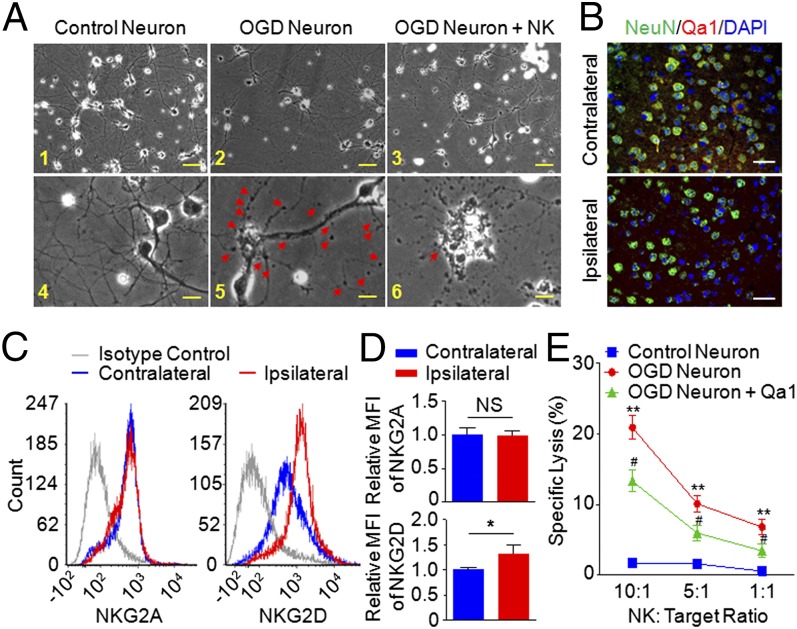
To define the mechanisms governing NK cell-mediated detrimental effects, we first assessed whether NK cells could augment stroke through cytolytic effects on neurons. For that purpose, cortical neurons exposed to OGD were cocultured with NK cells. Morphologically the formation of NK cell–neuron complexes resembled the immune synapse, and the presence of NK cells promoted damage to cell bodies and axons (Fig. 4A).
Fig. 4.
NK cell-mediated killing of ischemic neurons. (A, 1–6) Morphological changes of neurons induced by coculture with NK cells. Cultured healthy control neurons extended several dendritic trunks, and the dendrites had numerous protrusions (1 and 4). The ischemic neurons induced the formation of bead-like structures (arrowheads) and a decrease of fine protrusions (2 and 5). IL-2–activated NK cells caused severe neuronal destruction and loss (3 and 6). A remaining neuron showed fragmented axons and dendrites. The arrow indicates an NK cell in contact with the cell body of an ischemic neuron (6). Images are representative of five fields acquired from each group in triplicates of four separate experiments. [Scale bars, 50 µm (1–3), 10 µm (4–6).] (B) Loss of Qa1 expression on ischemic neurons. Brain slices from MCAO mice were stained with anti-Qa1 (red) and NeuN (green) mAb, which detected the MHC class Ib molecule Qa1 and neuron, respectively. n = 6. (Scale bars, 50 µm.) (C and D) Expression of NKG2A and NKG2D on NK cells from contralateral and ischemic hemisphere. Single-cell suspensions were prepared 24 h after stroke induction from the brains of the indicated groups. The expressions of NKG2A and NKG2D on NK cells were determined by FACS (C), and the quantification was graphed (D). The histograms are from one representative of 12 WT MCAO mice analyzed. MFI, mean fluorescent intensity. (E) Killing of ischemic neurons was measured by 51Cr release assay. Target cells (cultured control neurons, ischemic neurons, or Qa1 overexpressing ischemic neurons) were labeled with 51Cr. Effector cells were the IL-2 (10 μg/mL), IL-15 (10 μg/mL), and LPS (5 μg/mL) activated NK cells. Cytotoxicity was measured at 10:1; 5:1 and 1:1 (effector:target) ratio. Each value represents the mean ± SEM of the response of NK cells from three individual cell culture wells. Data represent four separate experiments. **P < 0.01 vs. control neuron. #P < 0.05 vs. ischemic neuron.
Because cortical neurons are relatively resistant to NK cell-mediated killing (17), the neural death observed in the cultures of NK cell-ischemic neurons prompted us to investigate a possible loss of NK cell tolerance, by analyzing the expression of inhibitory or stimulatory receptors on NK cells and their ligands on neurons. Of note, expression of the self MHC class Ib molecule Qa1, the ligand for natural-killer group 2A (NKG2A) receptor, decreased significantly on ischemic neurons (Fig. 4B). NKG2A, an inhibitory receptor coupled to CD94, was similar on NK cells from the contralateral and ischemic hemispheres, whereas natural-killer group 2D protein (NKG2D), an activation receptor, increased on NK cells in the ischemic hemisphere (Fig. 4 C and D). The NK cell-mediated cytolytic killing of ischemic neurons was then confirmed by 51Cr release assay (Fig. 4E), and overexpression of Qa1 using lentiviral transfection (Fig. S5) abrogated NK cell-mediated killing of neurons (Fig. 4E). Therefore, NK cell-mediated neuronal damage is associated with the loss of self-identity for ischemic neuron-modulated NK cell tolerance and the activation of NK cells (i.e., up-regulated NKG2D expression).
To confirm the cytolytic effects of NK cells on ischemic neurons in vivo, we again took advantage of the adoptive transfer model using Rag2−/−γc−/− mice as recipients. To this end, we focused on perforin, a cytolytic protein found in the granules of NK cells and an important player in NK cell-mediated cytolysis (18). Rag2−/−γc−/− mice manipulated to develop MCAO were given perforin−/− NK (Pfr−/− NK) cells and 24 h later developed brain lesions that were obviously smaller than those in their counterparts given WT NK cells (Fig. 5).
Fig. 5.
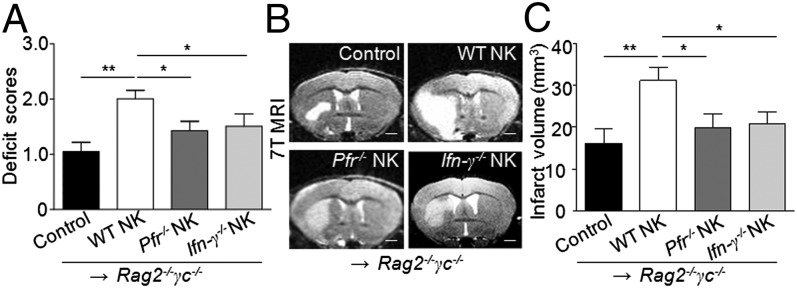
Perforin and INF-γ are required for NK cell-mediated detrimental effects in stroke. NK cells (5 x10⁵) were sorted from pooled splenocytes of WT, perforin-deficient (Pfr−/−), or IFN-γ–deficient (Ifn-γ−/−) mice and i.v. injected into Rag2−/−γc−/− mice, followed by the MCAO procedure. (A) Quantification of neurological deficits in Rag2−/−γc−/− recipients of NK cells with or without perforin or IFN-γ. Mice devoid of NK cells (Rag2−/−γc−/−), after receiving perforin-deficient NK cells (Pfr−/− NK) or IFN-γ–deficient NK cells (Ifn-γ−/− NK), had relatively mild neurological deficits compared with Rag2−/−γc−/− mice receiving the same number of functionally competent NK cells (WT NK). (B) 7T MRI images depict the size of brain infarction in mice from each group. Rag2−/−γc−/− MCAO mice receiving Pfr−/− NK or Ifn-γ−/− NK mice had smaller infarct volumes than those receiving competent NK cells. (Scale bars, 1 mm.) (C) Quantification of infarct volume by ImageJ analysis of MRI images. Rag2−/−γc−/− MCAO mice without NK cell transfer served as controls. (A–C) n = 8 mice per group, 24 h after MCAO. *P < 0.05; **P < 0.01.
NK Cell-Derived IFN-γ Contributes to Brain Infarction.
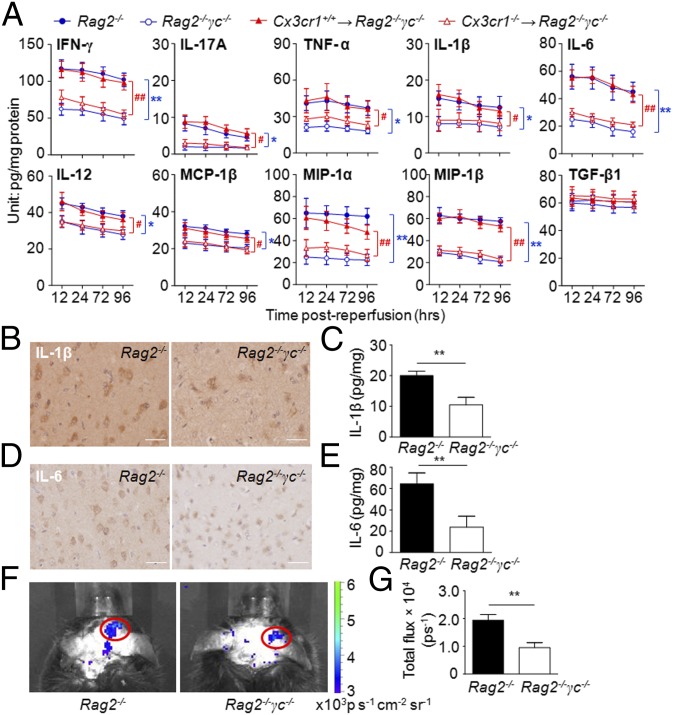
In addition to the cytolytic effects on neurons, NK cells could augment local inflammation through release of proinflammatory cytokines. We quantified inflammatory molecules in MCAO brain with (Rag2−/−) or without (Rag2−/−γc−/−) NK cells, as well as more (Cx3cr1+/+ NK→Rag2−/−γc−/−) or less (Cx3cr1−/− NK→Rag2−/−γc−/−) NK cells in the CNS. Rag2−/−γc−/− and Cx3cr1−/− NK→Rag2−/−γc−/− MCAO mice had lower levels of IFN-γ, IL-17A, TNF-α, IL-1β, IL-6, IL-12, macrophage inflammatory protein 1α and 1β (MIP-1α, -1β), and monocyte chemotactic protein 1β (MCP-1β) than the corresponding controls, and these alterations persisted to later stages of stroke (Fig. 6A). However, the levels of tumor growth factor β (TGF-β) were not significantly altered. Reductions of IL-1β and IL-6 were also verified by immunohistochemical staining in brain sections from Rag2−/− and Rag2−/−γc−/− MCAO mice (Fig. 6 B–E). Generation of ROS, a key factor that activates cell death pathways, was also reduced in MCAO mice by a lack of NK cells (Fig. 6 F and G).
Fig. 6.
Absence of NK cells is associated with reduced poststroke inflammatory response in the brain. (A) Absence of NK cells reduces brain inflammation during stroke. Brain homogenates were prepared from mice of the indicated groups 12, 24, 72, and 96 h after MCAO. Cytokine concentrations were measured by a Multi-Analyte ELISArray Kit (SABiosciences). Results shown are from three independent experiments with a pool of n = 4 mice per group per time point. *P < 0.05, **P < 0.01, Rag2−/−γc−/− vs. Rag2−/−; #P < 0.05, ##P < 0.01, Cx3cr1+/+ NK→Rag2−/−γc−/− vs. Cx3cr1−/− NK→Rag2−/−γc−/−. (B–E) Lack of NK cells is associated with reduced expression of inflammatory mediators in the ischemic brain. Representative images of immunostaining for IL-1β and IL-6 from brain sections of an infarct hemisphere from mice with (Rag2−/−) or without (Rag2−/−γc−/−) NK cells (B and D) and quantification of cytokines (C and E) at 24 h after the MCAO procedure by ELISA. (Scale bars, 20 µm.) n = 8 per group. **P < 0.01. (F and G) Lack of NK cells reduced ROS generation in stroke. (F) Imaging ROS activity in vivo. Bioluminescent images were captured for 1 min using the cooled IVIS imaging system (Xenogen IVIS-200) after luminol i.p. injection, as recently described (16, 23, 33), to monitor the ROS generation in Rag2−/− and Rag2−/−γc−/− MCAO brains. (G) Quantification and statistical analysis of the images. Rag2−/− and Rag2−/−γc−/− mice had significant differences in ROS levels after MCAO. Data were generated 12 h after MCAO, with seven mice per group. **P < 0.01.
Previous studies have asserted that IFN-γ augments lesion size in mice with MCAO (6). We reasoned that NK cell is a major source of IFN-γ that may boost local inflammation, as demonstrated above. We therefore reconstituted Rag2−/−γc−/− mice with IFN-γ–deficient (Ifn-γ−/−) or -sufficient (WT) NK cells. As a result, Ifn-γ−/− NK cells lost their ability to significantly augment lesions in the recipient mice (Fig. 5).
NK Cells Enhance Ischemic Neuronal Excitability and Synaptic Excitatory Transmission.
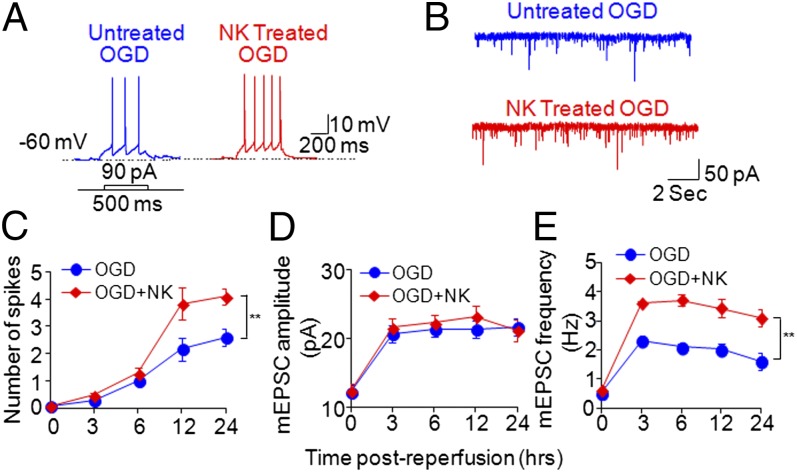
We also examined the intrinsic neuronal membrane excitability that could be associated with hyperactivity and neuronal death by using somatic whole-cell current-clamp recording. Interestingly, we found that coculture with NK cells after OGD exposure significantly increased the excitability of cortical neurons in response to injected currents relative to that of OGD neurons cultured alone without NK cells (Fig. 7 A and C).
Fig. 7.
NK cells increase ischemic neuronal excitability and synaptic excitatory transmission. Cultured cortical neurons underwent transient OGD (15 min), then recovered for 3, 6, 12, and 24 h with or without NK cells in the culture. Neuronal membrane excitability was assessed by counting action potential numbers in response to injection of 90-pA current for 500 ms. (A) Typical traces of action potential generation in response to 90-pA current injection show that treatment with NK cells enhanced neuronal excitability in OGD neurons followed by reperfusion. (B) Treatment with NK cells enhanced mEPSCs recorded from OGD neurons followed by reperfusion. (C) Time course for action potential spike activity (ordinate) as a function of currents injected (90 pA) at various time points after OGD in cultured cortical neurons. Results show that treatment with NK cells increased action potential numbers starting at 12 h after OGD. (D and E) Treatment with NK cells increased mEPSC frequency, starting at 3 h after OGD, but not mEPSC amplitude. Electrophysiology data were collected from eight cells in each group. **P < 0.01.
To test the effects of NK cells on synaptic excitatory activities, we next examined AMPA [2-amino-3-(5-methyl-3-oxo-1,2-oxazol-4-yl)propanoic acid] receptor-mediated miniature excitatory postsynaptic currents (mEPSCs). A significant increase in mEPSC frequency was observed in OGD-exposed cortical neurons cocultured with NK cells compared with OGD-exposed neurons without NK cells in culture (Fig. 7 B and E). However, mEPSC amplitude was not changed (Fig. 7 B and D). In addition, we found that NK cell-mediated effects on neuronal hyperactivities were independent of perforin (Fig. S6). This marked increase of mEPSC frequency in OGD neurons that were cocultured with NK cells could result from the enhanced release of presynaptic vesicular glutamate, thereby potentiating glutamate-mediated excitotoxicity and contributing to NK cell-mediated neuronal death (19).
Discussion
This study provides previously unidentified evidence that NK cells exert a detrimental impact that results in neuronal death, ischemic brain lesions, and the neurological deficit typical of stroke. As documented here, ischemic neuron-derived CX3CL1 played a major role in recruiting NK cells to its close proximity. Loss of NK cell tolerance was promoted by local inflammatory foci, following a reduced expression of MHC class Ib molecules on the ischemic neurons, as well as up-regulation of the activating receptor NKG2D on NK cells. All together, the above events led to NK cell-mediated cytotoxicity and increased neuronal death (20), a process also seen in viral encephalitis (9, 21). Additionally, NK cells orchestrated local inflammatory responses that could, in turn, further aggravate edema and hypoxia in the ischemic penumbra. Last but not least, NK cells increased neuronal excitability and synaptic excitatory transmission in the ischemic brain—a finding that is reminiscent of seizure disorder in some stroke patients, together with an increased oxygen demand of dying neurons, which hastened their demise. This aspect is important because neuronal cell hyperactivity has been implicated in brain ischemia-induced neuronal death (19).
The initiation and progression of the cellular and biochemical events that lead to inflammatory responses and irreversible cell death are swift processes that occur within minutes to hours after the onset of ischemic brain stroke (22). Temporal considerations suggest that only the immune cells that can be activated without the requirement of antigen priming could respond rapidly to the ischemic events during the acute phases of the process. NK cells have these characteristics. T cells that do not need classic antigen presentation for activation, such as NKT and γδ T cells, are also capable of responding in the acute phase of stroke. However, CD1d-deficient mice lacking NKT cells were not protected from ischemic injury 24 h after MCAO, suggesting that NKT cells were not involved in the early phases of injury (5). Conversely, the involvement of γδ T cells occurred on day 4, which is a late stage of cerebral infarction (8). Interestingly, the data presented here suggest that NK cells contribute to the genesis of brain lesions at the very initiation of stroke.
In addition to a direct killing of hypoxic neurons, NK cells might directly or indirectly cooperate with immigrant cells or brain-resident cells during hypoxia and cell death. For examples, NK cells might act in synergy with monocytes and platelets to propagate thrombosis and activate the complement system in response to brain ischemia and reperfusion (3). Additionally, the release of IFN-γ by NK cells might activate other fractalkine-guided homing of cells to the brain, including inflammatory macrophages (23); IFN-γ could also augment MHC class II molecules on dendritic cells, which might influence the adaptive immune response (24). Whether and how NK cells interact with microglia or other brain-intrinsic cells to impact infarct development is of interest and warrants further investigation.
The present finding that NK cells promoted inflammation and neuronal damage in stroke indicated distinctive activity of NK cells during experimental autoimmune encephalomyelitis (EAE) (16, 25), a mouse model of human multiple sclerosis. In EAE, NK cells, together with myelin-reactive T cells, are activated in the periphery before they migrate to the brain. Autoreactive T and B cells, as well as other lymphocytes (including NK cells and regulatory T lymphocytes) that directly or indirectly modify the magnitude of autoimmunity, ultimately determine the extent of demyelination. By contrast, the cellular and biochemical cascade triggered by ischemia leading to neuronal death begins within the brain, and NK cells are recruited with a timing and inflammatory microenvironment that differ from those in EAE. These aspects may modify NK cell phenotype and function (24). Additionally, the different role played by NK cells in the two diseases can relate to the target tissue, primary disease-initiating factors, timing of the immune responses, and the overall autoimmune process (24).
To conclude, as presented here, the extensive infiltration of NK cells in periinfarct areas of the brain during acute ischemic stroke, together with these cells’ physical proximity to damaged neurons, suggests a detrimental role for NK cells in ischemic brain. However, for clinical translation, several critical issues need consideration. First, would the targeting of NK cells be sufficient to attenuate disease? This could become clearer by knowing to what extent NK cells act alone or in concert with other cells (i.e., microglia, astrocytes, T cells, B cells, etc.). Second, what time window is appropriate for targeting NK cell activities in stroke? NK cells exert their detrimental effects in stroke largely within the initial 12 h. Presumably, manipulating NK cells during the relevant time interval, once defined in patients with stroke, might extend the currently suggested 4.5-h therapeutic window for activity of the tissue plasminogen activator. Notwithstanding these considerations, this study establishes the previously unidentified detrimental effect of NK cells in stroke.
Materials and Methods
Human Brain Tissue.
Human brain sections were acquired from the Department of Pathology, Ohio State University and Sun Health Research Institute. Among the 14 cases studied, 8 were from patients who died within 7 d after acute stroke following MCAO, and the other 6 cases were from individuals who died from nonneurological diseases and who were used as controls. The nonneurological disease patients in present study had no history of neurological or neuropsychiatric disease. In addition, histopathological examination confirmed no pathological changes in brain sections beyond those expected in “control” nonneurological disease. Stroke patients and control subjects did not differ significantly in terms of their mean age at death (stroke patients, 79.4 ± 8.5 y; controls, 83.2 ± 9.1 y, mean ± SEM; P > 0.05, Student t test). Brain tissues were collected within 4 h after death.
Mice.
Male C57BL/6 (B6) mice and Rag2−/−, Rag2−/−γc−/− mice were purchased from Taconic. Cx3cr1−/− (Cx3cr1GFP/GFP) (26), Cx3cr1+/− (Cx3cr1+/GFP), perforin−/− (Pfr−/−), and Ifn-γ−/− mice were purchased from The Jackson Laboratory. All mutant mice were back-crossed to the B6 background for 8–12 generations. Details of mice used in this study are given in SI Materials and Methods.
MCAO Procedure, Neuroimaging, and Clinical and Neuropathological Assessment.
Adult male mice (age 2–3 mo) were subjected to a 90-min transient ischemia (occlusion–reperfusion) by MCAO using the filament method, as previously described (7, 8, 11, 27). Details of the MCAO procedures, TTC staining, MRI scan, ROS measurement, neurological deficit assessment, and immunohistochemistry staining are provided in SI Materials and Methods.
In Vivo Cell Depletion and Cell Passive Transfer, in Vitro NK Cell-Mediated Cytotoxicity, ELISA, and Flow Cytometry.
NK cell depletion and NK cell, microglia passive transfer were performed in vivo (16, 28–30). Detailed protocols for 51Cr release assay (16), electrophysiology (31, 32), ELISA, and flow cytometry are given in SI Materials and Methods.
Statistics.
Details of statistical analyses are given in SI Materials and Methods. Significance was set at P < 0.05. Data are shown as means ± SEM.
Supplementary Material
Acknowledgments
We thank Drs. G. Turner, Q. Liu, R. Liu, and Z. Tang for technical support, Ms. P. Minick for editorial assistance, and the Transgenic and Knockout Facility supported by the Rheumatic Diseases Core Center at Washington University. This study was supported in part by National Basic Research Program of China Grant 2013CB966900 (to F.-D.S.), National Key-Project of Clinical Neurology (to F.-D.S.), National Science Foundation of China Grant 81230028 (to F.-D.S.), American Heart Association Grant GRNT18970031 (to F.-D.S.), National Institutes of Health Grants R01AI083294 (to F.-D.S.), R01AG031811, and R01NS047682 (to J.C.), and the Howard Hughes Medical Institute (W.Y.).
Footnotes
The authors declare no conflict of interest.
This article is a PNAS Direct Submission.
This article contains supporting information online at www.pnas.org/lookup/suppl/doi:10.1073/pnas.1315943111/-/DCSupplemental.
References
- 1.Eltzschig HK, Carmeliet P. Hypoxia and inflammation. N Engl J Med. 2011;364(7):656–665. doi: 10.1056/NEJMra0910283. [DOI] [PMC free article] [PubMed] [Google Scholar]
- 2.Iadecola C, Anrather J. The immunology of stroke: From mechanisms to translation. Nat Med. 2011;17(7):796–808. doi: 10.1038/nm.2399. [DOI] [PMC free article] [PubMed] [Google Scholar]
- 3.Eltzschig HK, Eckle T. Ischemia and reperfusion—from mechanism to translation. Nat Med. 2011;17(11):1391–1401. doi: 10.1038/nm.2507. [DOI] [PMC free article] [PubMed] [Google Scholar]
- 4.Hurn PD, et al. T- and B-cell-deficient mice with experimental stroke have reduced lesion size and inflammation. J Cereb Blood Flow Metab. 2007;27(11):1798–1805. doi: 10.1038/sj.jcbfm.9600482. [DOI] [PMC free article] [PubMed] [Google Scholar]
- 5.Kleinschnitz C, et al. Early detrimental T-cell effects in experimental cerebral ischemia are neither related to adaptive immunity nor thrombus formation. Blood. 2010;115(18):3835–3842. doi: 10.1182/blood-2009-10-249078. [DOI] [PubMed] [Google Scholar]
- 6.Yilmaz G, Arumugam TV, Stokes KY, Granger DN. Role of T lymphocytes and interferon-gamma in ischemic stroke. Circulation. 2006;113(17):2105–2112. doi: 10.1161/CIRCULATIONAHA.105.593046. [DOI] [PubMed] [Google Scholar]
- 7.Liesz A, et al. Regulatory T cells are key cerebroprotective immunomodulators in acute experimental stroke. Nat Med. 2009;15(2):192–199. doi: 10.1038/nm.1927. [DOI] [PubMed] [Google Scholar]
- 8.Shichita T, et al. Pivotal role of cerebral interleukin-17-producing gammadeltaT cells in the delayed phase of ischemic brain injury. Nat Med. 2009;15(8):946–950. doi: 10.1038/nm.1999. [DOI] [PubMed] [Google Scholar]
- 9.Shi FD, Ransohoff RM. Natural killer cells in the central nervous system. In: Lotze MT, Thomson AW, editors. Natural Killer Cells. Maryland Heights, MO: Academic; 2010. pp. 373–383. [Google Scholar]
- 10.Walzer T, et al. Identification, activation, and selective in vivo ablation of mouse NK cells via NKp46. Proc Natl Acad Sci USA. 2007;104(9):3384–3389. doi: 10.1073/pnas.0609692104. [DOI] [PMC free article] [PubMed] [Google Scholar]
- 11.Chen J, et al. Endothelial nitric oxide synthase regulates brain-derived neurotrophic factor expression and neurogenesis after stroke in mice. J Neurosci. 2005;25(9):2366–2375. doi: 10.1523/JNEUROSCI.5071-04.2005. [DOI] [PMC free article] [PubMed] [Google Scholar]
- 12.Hackett J, Jr, et al. Origin and differentiation of natural killer cells. II. Functional and morphologic studies of purified NK-1.1+ cells. J Immunol. 1986;136(8):3124–3131. [PubMed] [Google Scholar]
- 13.Campbell JJ, et al. Unique subpopulations of CD56+ NK and NK-T peripheral blood lymphocytes identified by chemokine receptor expression repertoire. J Immunol. 2001;166(11):6477–6482. doi: 10.4049/jimmunol.166.11.6477. [DOI] [PubMed] [Google Scholar]
- 14.Imai T, et al. Identification and molecular characterization of fractalkine receptor CX3CR1, which mediates both leukocyte migration and adhesion. Cell. 1997;91(4):521–530. doi: 10.1016/s0092-8674(00)80438-9. [DOI] [PubMed] [Google Scholar]
- 15.Tarozzo G, Campanella M, Ghiani M, Bulfone A, Beltramo M. Expression of fractalkine and its receptor, CX3CR1, in response to ischaemia-reperfusion brain injury in the rat. Eur J Neurosci. 2002;15(10):1663–1668. doi: 10.1046/j.1460-9568.2002.02007.x. [DOI] [PubMed] [Google Scholar]
- 16.Hao J, et al. Central nervous system (CNS)-resident natural killer cells suppress Th17 responses and CNS autoimmune pathology. J Exp Med. 2010;207(9):1907–1921. doi: 10.1084/jem.20092749. [DOI] [PMC free article] [PubMed] [Google Scholar]
- 17.Backström E, et al. Natural killer cell-mediated lysis of dorsal root ganglia neurons via RAE1/NKG2D interactions. Eur J Immunol. 2003;33(1):92–100. doi: 10.1002/immu.200390012. [DOI] [PubMed] [Google Scholar]
- 18.Young JD, Hengartner H, Podack ER, Cohn ZA. Purification and characterization of a cytolytic pore-forming protein from granules of cloned lymphocytes with natural killer activity. Cell. 1986;44(6):849–859. doi: 10.1016/0092-8674(86)90007-3. [DOI] [PubMed] [Google Scholar]
- 19.Fan Y, et al. Transient cerebral ischemia increases CA1 pyramidal neuron excitability. Exp Neurol. 2008;212(2):415–421. doi: 10.1016/j.expneurol.2008.04.032. [DOI] [PubMed] [Google Scholar]
- 20.Backström E, Chambers BJ, Kristensson K, Ljunggren HG. Direct NK cell-mediated lysis of syngenic dorsal root ganglia neurons in vitro. J Immunol. 2000;165(9):4895–4900. doi: 10.4049/jimmunol.165.9.4895. [DOI] [PubMed] [Google Scholar]
- 21.Shieh TM, et al. Functional analyses of natural killer cells in macaques infected with neurovirulent simian immunodeficiency virus. J Neurovirol. 2001;7(1):11–24. doi: 10.1080/135502801300069593. [DOI] [PubMed] [Google Scholar]
- 22.Yenari MA, Han HS. Neuroprotective mechanisms of hypothermia in brain ischaemia. Nat Rev Neurosci. 2012;13(4):267–278. doi: 10.1038/nrn3174. [DOI] [PubMed] [Google Scholar]
- 23.Wardman P. Fluorescent and luminescent probes for measurement of oxidative and nitrosative species in cells and tissues: Progress, pitfalls, and prospects. Free Radic Biol Med. 2007;43(7):995–1022. doi: 10.1016/j.freeradbiomed.2007.06.026. [DOI] [PubMed] [Google Scholar]
- 24.Shi FD, Ljunggren HG, La Cava A, Van Kaer L. Organ-specific features of natural killer cells. Nat Rev Immunol. 2011;11(10):658–671. doi: 10.1038/nri3065. [DOI] [PMC free article] [PubMed] [Google Scholar]
- 25.Hao J, et al. Interleukin-2/interleukin-2 antibody therapy induces target organ natural killer cells that inhibit central nervous system inflammation. Ann Neurol. 2011;69(4):721–734. doi: 10.1002/ana.22339. [DOI] [PMC free article] [PubMed] [Google Scholar]
- 26.Jung S, et al. Analysis of fractalkine receptor CX(3)CR1 function by targeted deletion and green fluorescent protein reporter gene insertion. Mol Cell Biol. 2000;20(11):4106–4114. doi: 10.1128/mcb.20.11.4106-4114.2000. [DOI] [PMC free article] [PubMed] [Google Scholar]
- 27.Gibson CL, Coomber B, Murphy SP. Progesterone is neuroprotective following cerebral ischaemia in reproductively ageing female mice. Brain. 2011;134(Pt 7):2125–2133. doi: 10.1093/brain/awr132. [DOI] [PubMed] [Google Scholar]
- 28.Pineau I, Lacroix S. Proinflammatory cytokine synthesis in the injured mouse spinal cord: Multiphasic expression pattern and identification of the cell types involved. J Comp Neurol. 2007;500(2):267–285. doi: 10.1002/cne.21149. [DOI] [PubMed] [Google Scholar]
- 29.Cardona AE, et al. Control of microglial neurotoxicity by the fractalkine receptor. Nat Neurosci. 2006;9(7):917–924. doi: 10.1038/nn1715. [DOI] [PubMed] [Google Scholar]
- 30.Shi FD, et al. Natural killer cells determine the outcome of B cell-mediated autoimmunity. Nat Immunol. 2000;1(3):245–251. doi: 10.1038/79792. [DOI] [PubMed] [Google Scholar]
- 31.Desai NS, Rutherford LC, Turrigiano GG. Plasticity in the intrinsic excitability of cortical pyramidal neurons. Nat Neurosci. 1999;2(6):515–520. doi: 10.1038/9165. [DOI] [PubMed] [Google Scholar]
- 32.Karmarkar UR, Buonomano DV. Different forms of homeostatic plasticity are engaged with distinct temporal profiles. Eur J Neurosci. 2006;23(6):1575–1584. doi: 10.1111/j.1460-9568.2006.04692.x. [DOI] [PubMed] [Google Scholar]
- 33.Hao J, et al. Attenuation of CNS inflammatory responses by nicotine involves α7 and non-α7 nicotinic receptors. Exp Neurol. 2011;227(1):110–119. doi: 10.1016/j.expneurol.2010.09.020. [DOI] [PMC free article] [PubMed] [Google Scholar]
Associated Data
This section collects any data citations, data availability statements, or supplementary materials included in this article.


