Abstract
Genetic variations in blood cell parameters can impact clinical traits. We report here the mapping of blood cell traits in a panel of 100 inbred strains of mice of the Hybrid Mouse Diversity Panel (HMDP) using genome-wide association (GWA). We replicated a locus previously identified using linkage analysis in several genetic crosses for mean corpuscular volume 1 and a number of other red blood cell traits on distal chromosome 7. Our peak for SNP association to MCV occurred in a linkage disequilibrium (LD) block spanning from 109.38 to 111.75 Mb that includes Hbb-b1, the likely causal gene. Altogether, we identified 5 loci controlling red blood cell traits (on chromosomes 1, 7, 11, 12, and 16), and four of these correspond to loci for red blood cell traits reported in a recent human GWA study. For white blood cells, including granulocytes, monocytes, and lymphocytes, a total of six significant loci were identified on chromosomes 1, 6, 8, 11, 12 and 15. An average of ten candidate genes were found at each locus and those were prioritized by examining functional variants in the HMDP such as missense and expression variants. These new results provide intermediate phenotypes and candidate loci for genetic studies of atherosclerosis and cancer as well as inflammatory and immune disorders in mice.
Keywords: blood cell traits, genetics, association, linkage, red cell, white cell, mice
INTRODUCTION
Blood cell traits have been linked to risk of cancer, coronary artery disease, total mortality as well as other clinically relevant disorders2–4. Moreover, hematological parameters are under strong genetic control being both tightly controlled and highly heritable5,6. Thus, an understanding of the genetic factors that regulate the production and properties of blood cells could contribute substantially to our ability to predict, treat or prevent a variety of diseases. Such considerations have led to a number of large genome-wide association studies (GWAS) of blood cell parameters, such as leukocyte count and hemoglobin concentration7–10. And, these studies have resulted in the identification of an impressive number of loci and associated candidate genes. However, while highly precise hematological data is relatively easy to collect in large human population studies, it is difficult to further characterize the role of any identified candidate genes and associated metabolic pathways in the same subjects, particularly when the likely tissue for such studies is not blood itself but tissues such as bone marrow or spleen.
Animal models are the logical alternative for investigating these candidate genes and pathways, and our laboratory has been using systems-genetics approach in mice to understand cardiometabolic traits such as atherosclerosis, obesity, diabetes, osteoporosis and heart failure11. Inflammation is an important component of these traits, therefore we resolved to investigate the potential impact of blood cell variations by using association mapping to identify underlying genetic loci. Two previous studies have examined blood cell traits in mice using quantitative trait locus (QTL) analysis of genetic crosses12,13. It is difficult to identify the causal genes in such linkage analyses because such analyses typically have excellent power but poor mapping resolution14. Both of these prior studies used additional strategies to improve resolution and to suggest candidate genes. Peters et al.,12 carried out a dozen classical crosses involving a total of about 4000 mice. By combining data from multiple crosses and by using haplotype association mapping, they identified candidate genes for about a dozen loci, including the identification of Hbb as the causal gene for several red cell traits on chromosome 7. Kelada et al.,13 provided a demonstration of the potential power of the collaborative cross by mapping hematological parameters in 131 incipient strains to identify five loci. The QTL confidence intervals were from 3.8 to 14.0 Mb and in several cases they were able to narrow substantially by using a shared ancestry approach. Our approach for improving resolution in mouse genetic studies is a recently-developed association-based mapping strategy 15. An essential aspect of this approach is the correction for population structure using an Efficient Mixed Model Algorithm (EMMA)16. Based on power calculations and strain diversity, we chose 100 inbred strains of mice for a panel which we term the Hybrid Mouse Diversity Panel (HMDP). Using transcript levels as a model phenotype, we have shown that the panel has sufficient power to map several thousand expression QTL (eQTL) with excellent resolution. In the current study, we identify six loci for red blood cell phenotypes and eight loci for white blood cell phenotypes. For each locus, we identified a linkage disequilibrium (LD) block that contains the peak-association SNP as a region most likely to contain the underlying genetic variation. These LD blocks were typically 1.5 to 2 Mb but ranged from 0.8 Mb to 4 Mb. We identified a set of candidate genes within the LD blocks based on the presence of a local (cis-acting) eQTL or genes carrying non-synonymous SNPs within the coding region or splice site sequence variations. In several cases it was possible to validate these loci based on published mapping results from other groups. Most strikingly, four of five loci that we identified for red blood cell traits corresponded to loci that were identified in a recent human GWA study10 including several cases where the mouse and human studies identified the same candidate gene.
METHODS
C57BL/6J x DBA/2J F2 intercross
We previously carried out an F2 intercross between the inbred strains DBA/2 and C57BL/617. These parental mice were obtained from The Jackson Laboratory (Bar Harbor, ME). The male C57BL/6 parents carried heterozygous deficiency in the leptin receptor (db +/−) and F1 progeny were selected for the presence of the mutant allele. Among F2 progeny, only those with homozygous deficiency in leptin receptor (db/db) were selected for further phenotype and genotype analysis.
Genomic DNA was isolated by standard procedures. Genotyping for the db mutation was carried out essentially as described by Horvat and Bünger 18 except that the AccI digestion was carried out at 55°C for 1.5 h to increase efficiency of cutting. Genome-wide analysis of single nucleotide polymorphism (SNP) genotypes for quantitative trait locus (QTL) mapping was carried out using the AffymetrixGeneChip Mouse Mapping 5K SNP panel19. This panel carries >2,800 informative makers between C57BL/6 and DBA/2 (average spacing: 0.5–0.6 cM)
Phenotypic traits were log transformed to normalize the trait distribution. Logarithm of the odds (LOD) score distributions were calculated using the scanone function in R/qtl (http://www.rqtl.org) (http://www.cran.r-project.org) 20. Sex and age were treated as interactive covariates as needed21. In most cases, we carried out separate analysis of the 5 wk and 12 wk cohorts using sex as an interactive covariate. Permutations of n = 1,000 were carried out to determine thresholds for significance at P < 0.05 as a means to account for the multiple testing of many markers for association with each trait.
Animals were housed in vivaria accredited by the Association for Assessment and Accreditation of Laboratory Animal Care, and all procedures were approved by the UCLA Institutional Animal Care and Use Committee. The breeding colony was maintained on a 12 h light-dark cycle with lights on from 6 AM to 6 PM, and animals were fed a chow diet with 6% fat by weight. Male mice from the hybrid HMDP panel were purchased from the Jackson Labs. Mice were between 6 and 10 wk of age and to ensure adequate acclimatization to a common environment the mice were aged until 16 wk of age. All mice were maintained on a chow diet (Ralston-Purina Co.) until sacrifice at 16 wk of age. Following a 16-h fast, mice were bled retro-orbitally under isoflurane anesthesia and plasma lipids determined as previously described 22, 23.
HMDP strains and genotypes
The HMDP strains have been described in detail15. Genotypes for theses inbred strains were obtained from the Broad Institute (http://www.broadinstitute.org/mouse/hapmap), and combined with the genotypes from Wellcome Trust Center for Human Genetics (WTCHG). Genotypes of RI strains at the Broad SNPs were inferred from WTCHG genotypes by imputing alleles at polymorphic SNPs among parental strains, calling ambiguous genotypes missing. Of the 140,000 SNPs available, 107,145 were informative with an allele frequency greater than 5% and were used for GWAS in the HMDP. For phenotyping, we used 2 to 18 animals of each strain (Nave = 7.06, Nmedian = 6, Nmodal = 6). The exact numbers for each strain are as previously published15.
Blood Cell Traits
Blood for hematology analysis and for plasma was collected from mice that were fasted for 4–5 h and bled 2–3 h after the beginning of the light cycle from the retro-orbital plexus under isoflurane anesthesia. Complete blood cell profiling was carried out using the Heska (Loveland, CO) HemaTrue(TM) Veterinary Hematology Analyzer. Blood was collected in 20ul EDTA- coated glass capillaries and processed using standard procedures as per instructions from Heska. Three male adult mice were studied per strain.
Genome-wide association mapping of the HMDP
We applied the following linear mixed model to account for the population structure and genetic relatedness among strains in the genome-wide association mapping 16 y = μ + xβ + u + e: where μ represents mean, x represents SNP effect, u represents random effects due to genetic relatedness with Var(u) = σ g2K and Var(e) = σ e2, where K represents IBS (identity-by-state) matrix across all genotypes. A restricted maximum likelihood (REML) estimate of σ g2 and σ e2 are computed using EMMA, and the association mapping is performed based on the estimated variance component with a standard F-test to test β ≠ 0.
Genome-wide significance threshold
Genome-wide significance threshold in genome-wide association mapping is determined by the family-wise error rate (FWER) as the probability of observing one or more false positives across all SNPs per phenotype. We ran 100 different sets of permutation tests and parametric bootstrapping of size 1000, and observed that the mean and standard error of the genome-wide significance threshold at FWER of 0.05 were 3.9 × 10⁻⁶ ± 0.3 × 10⁻⁶ and 4.0 × 10⁻⁶ ± 0.3 × 10⁻⁶, respectively. This is approximately an order of magnitude larger than the significance threshold obtained by Bonferroni correction (4.6 × 10⁻⁷). We also performed parametric bootstrapping under simulated genetic background effect from population structure using EMMA. With 50% and 100% of variance explained by genetic background, the thresholds were determined to be 1.6 × 10⁻⁶ ± 0.2 × 10⁻⁶ and 1.7 × 10⁻⁶ ± 0.2 × 10⁻⁶. The reduction in the significance threshold compared to no genetic background effect is due to the fact that inter-SNP correlation due to long-range LD reduces when conditioning on the population structure.
Linkage Disequilibrium and candidate mutations
Linkage disequilibrium was determined based on same SNP database used in EMMA analyses. Correlations between each SNP on a chromosome was determined and plotted in a heatmap using MATLAB. Significant correlation of R^2> 0.8 between blocks of SNPs were determined to be indicative of LD. LD blocks for each significant locus were determined by visual approximation of the decay in LD. The Wellcome Trust Mouse Genomes Project Query Server was used to identify potentially causal mutations in genes of interest. The query was limited to mice contained within the HMDP, and for mutations affecting splice sites and mutations resulting in either frame shifts or non-synonymous mutations.
RESULTS
Analysis of blood cell parameters across a panel of inbred mouse strains
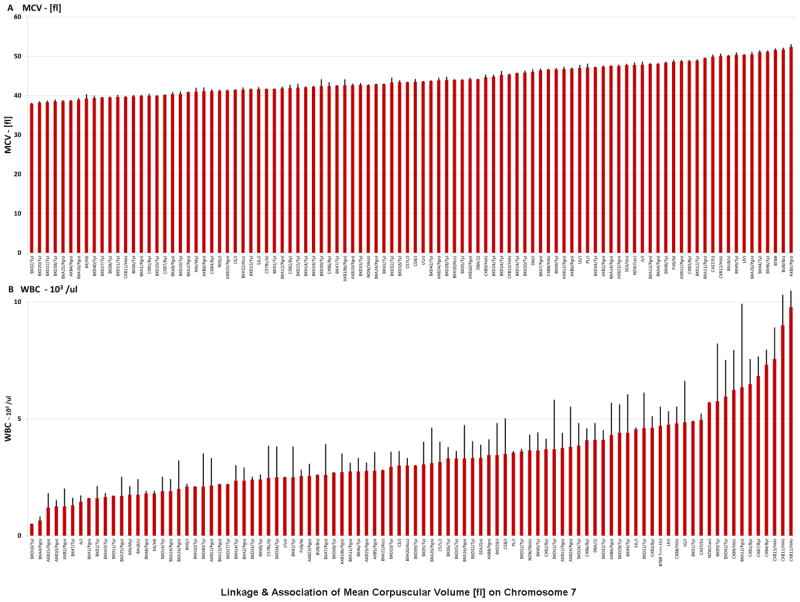
Analysis of hematological parameters in the HMDP was carried on a panel of 100 classical and recombinant inbred strains. Blood cell profiling was performed using the Heska Hematrue Veterinary Hematology Analyzer on 3 male mice per strain. Figure 1 shows the results for mean corpuscular volume [fl] (MCV) and for total white blood cell counts [10^3/μl] (WBC). The traits show wide strain-dependent variation suggesting complex underlying genetics. Strain averages for each hematological trait are shown in Supplemental Table 1. Trait-trait correlations are shown in Supplemental Table 2.
Figure 1. Blood cell traits among the HMDP strains rank-ordered by strain average.
A. MCV mean corpuscular volume [fl], B. WBC - white blood cell counts [10^3/μl]. Red bars reflect strain average for the trait and black bars indicate standard error.
Genetic control of red blood cell traits
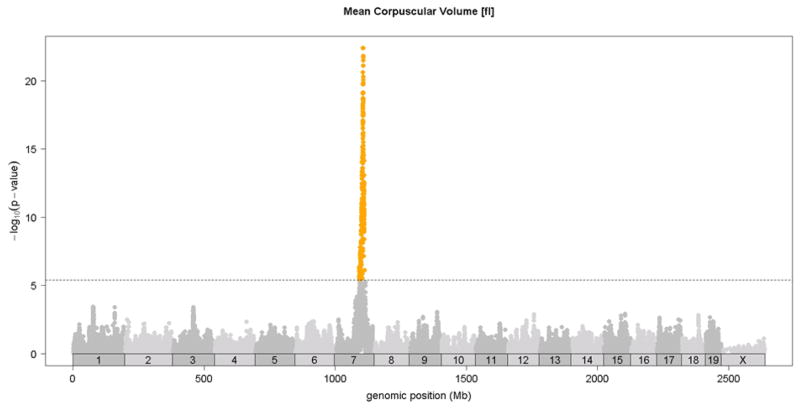
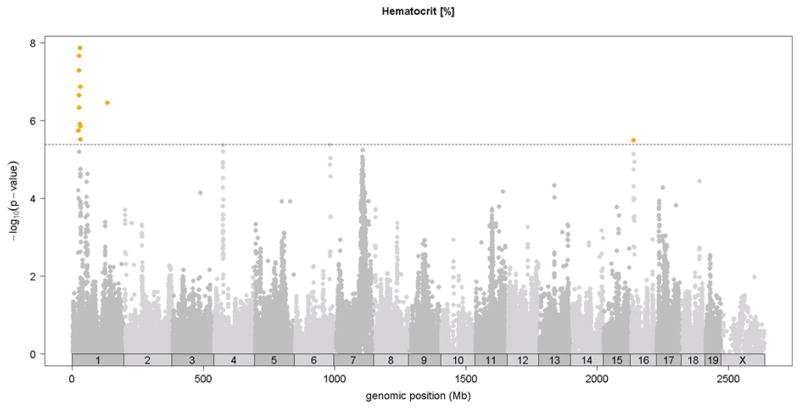
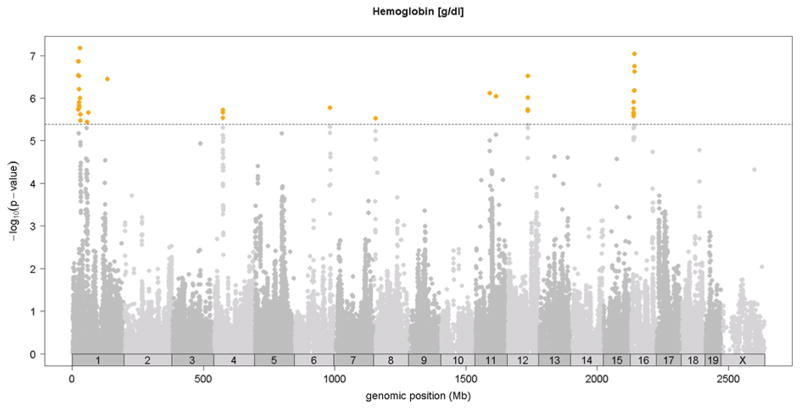
Previous linkage mapping studies12,13 identified a strong QTL peak on distal chromosome 7 at about 110 Mb for mean corpuscular volume (MCV)13 and for CHCM12, an alternate measure of mean corpuscular hemoglobin concentration (MCHC). In the HMDP, we observed the same QTL on chromosome 7 QTL for MCV (Figure 2 and Table 1) and for the related traits of mean corpuscular hemoglobin (MCH) and red cell distribution width (RDWa) (Table 1) along with a suggestive QTL for hematocrit (HCT). For comparison, in Figure 2, we also show the MCV QTL determined by linkage in a previous F2 cross between C57BL/6 and DBA 17. Typical of linkage studies, the QTL peak was broad and the hemoglobin Hbb-b1 gene variant that is postulated to underlie this QTL 12 is encoded at 110.96 Mb, more than 15 Mb and hundreds of genes from the linkage QTL peak at 94Mb. By contrast, the association peak in the HMDP is quite sharp and the peak SNP is less than 1 Mb from Hbb-b1 (Figure 2). Additional novel association loci for red blood cell phenotypes of hematocrit (HCT), hemoglobin concentration (HGB) and red blood cell counts (RBC)) were observed on chromosomes 1, 11, 12 and 16 (Figure 3 and Table 1).
Figure 2. Comparison of linkage and association analysis of red cell MCV locus on chromosome 7.
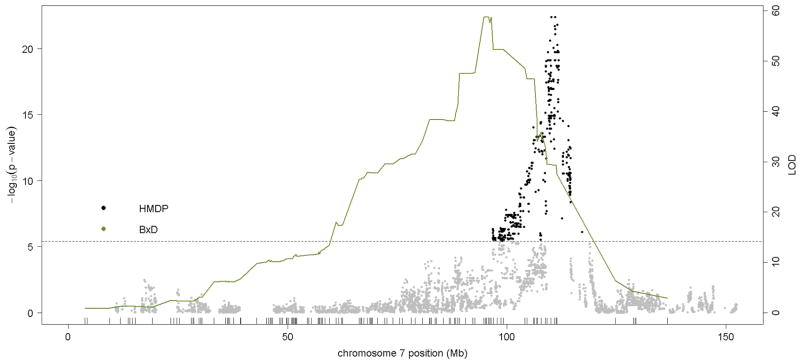
Linkage analysis for MCV in C57BL/6J x DBA/2J F2 mouse cross, shown in the solid green line, is plotted on chromosome 7 with peak LOD = 58.72. Association analysis of MCV is shown as a series of dots indicating the position and significance of association (−log10 p-value) for each SNP. The threshold for genome-wide significance (p=4.1E-6) is shown as a dashed line.
Table 1.
SNPs Associated with Hemoglobin and Red Blood Cell Phenotypes in the HMDP*
| chromosome | MCV | MCHC | RDW% | HCT | HGB | RBC | ||||||
|---|---|---|---|---|---|---|---|---|---|---|---|---|
| position | p-value | position | p-value | position | p-value | position | p-value | position | p-value | position | p-value | |
| 1 | 30,609,106 | 1.37E-08 | 29,056,427 | 6.80E-08 | 23,872,35 | 1.02E-07 | ||||||
| 1 | 134,905,722 | 3.51E-07 | 134,905,722 | 3.60E-07 | 134,905,722 | 1.62E-06 | ||||||
| 7 | 110,098,213 | 4.23E-23 | 110,098,213 | 7.83E-24 | 111,015,676 | 5.75E-14 | 110,618,166 | 5.80E-06 | ||||
| 11 | 56,841,408 | 7.72E-07 | 56,841,408 | 4.49E-06 | ||||||||
| 12 | 80,028,884 | 3.06E-07 | 80,028,884 | 9.80E-06 | ||||||||
| 16 | 15,916,062 | 9.21E-08 | 15,916,052 | 2.78E-07 | ||||||||
Abbreviations:
MCV Mean Corpuscular Volume [fl]
MCHC Mean Carpuscular Hemoglobin Cancentration [g/dl]
RDW% Red Cell Distribution Width [%]
HCT Hematocrit [%]
HGB Hemoglobin [g/dl]
RBC Red Blood Cell Count [10^6/μl]
Figure 3. SNP association analysis of red blood cell traits in HMDP population.
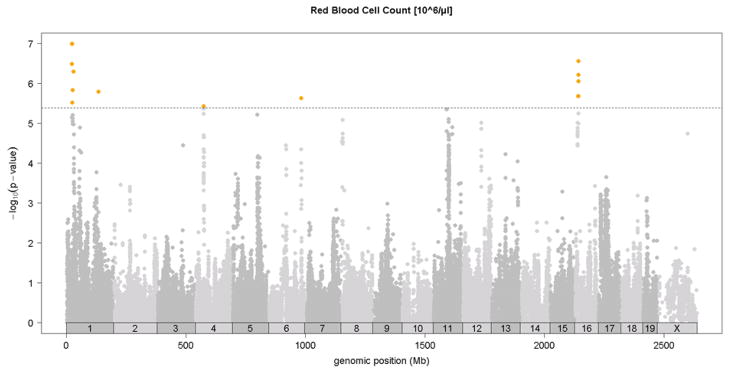
Shown are the associations for about 107,000 SNPs with genomic position on the x-axis and significance of association (−log10 p-value) on the y-axis. Dashed horizontal line at p= 4.1 E-6 is threshold for genome-wide significance. A. MCV [fl], B. HCT [%], C. hemoglobin content (HGB) [g/dl], D. red blood cell count (RBC)[10^6/μl]. Absolute genomic position (Mb) for each SNP is indicated below the X-axis while chromosome number is shown immediately above.
We examined the significant loci for red blood cell traits for long range LD, previously described25 as a potential confounding factor in GWAS analysis. We see no evidence of significant (R^2 > 0.8) LD between any of the red blood cell trait loci, and only one suggestive (R^2 > 0.5) LD between the chromosome 1 and 11 peaks (Table S3). This peak may be due to population substructure, which was not taken into account when computing LD values.
Genetic control of white blood cell traits
Association analysis in the HMDP identified 6 loci for total white blood cells, granulocytes, monocytes, and lymphocytes shown in Figures 4A-4D and in Table 2. Two of these loci, on chromosomes 6 and 12, exhibited significant associations for all classes of white cells, suggesting that they likely influence early stem cell progenitors or some inflammatory process common to all. The chromosome 8 locus which appears to be specific for monocytes (monocyte levels) exhibited the strongest association for all loci. Five out of the six loci were shared by monocytes and granulocytes, likely reflecting their similar developmental origins (Table 2). None of the loci overlapped with those for red cell parameters.
Figure 4. SNP association analysis of white blood cell counts in HMDP population.
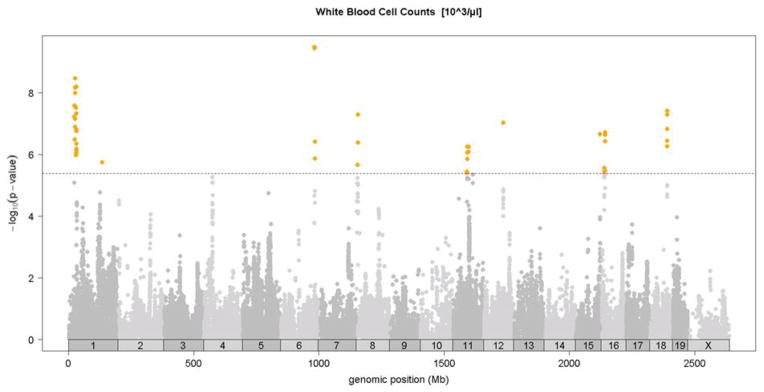
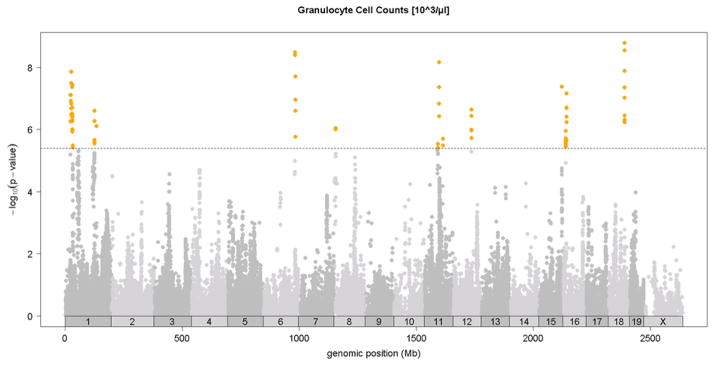
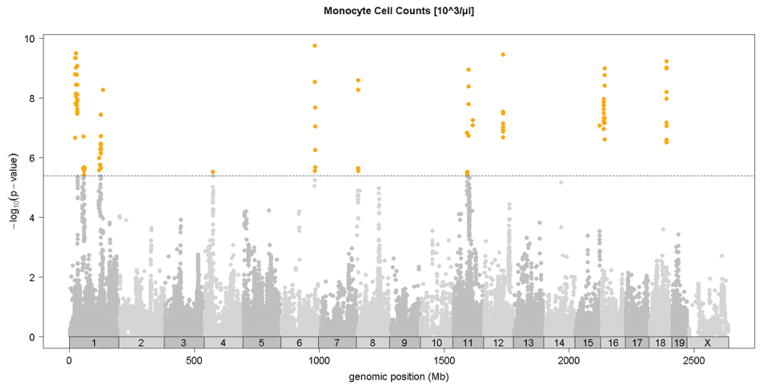
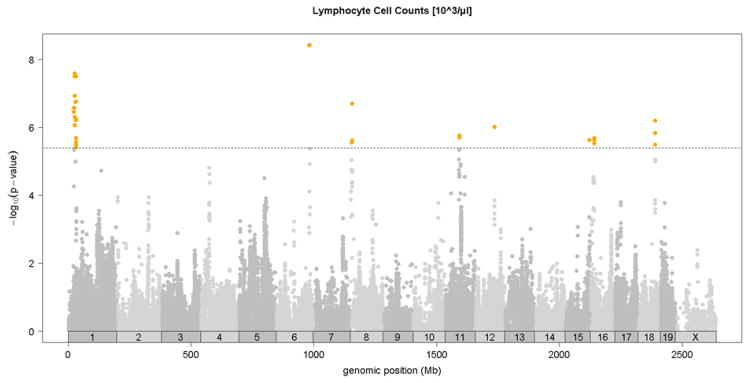
Shown are the associations for about 107,000 SNPs with genomic position on the x-axis and significance of association (−log10 p-value) on the y-axis. Dashed horizontal line at p= 4.1 E-6 is threshold for genome-wide significance. Cell counts (103/ul) for A. total white blood cells (WBC), B. granulocytes (GRAN), C. monocytes (MONO) and, D. lymphocytes (LYMP). Absolute genomic position (Mb) for each SNP is indicated below the X-axis while chromosome number is shown immediately above.
Table 2.
SNPs Associated with White Blood Cell Phenotypes in the HMDP
| chromosome | WBC | GRAN | MONO | LYMPH | ||||
|---|---|---|---|---|---|---|---|---|
| position | p-value | position | p-value | position | p-value | position | p-value | |
| 1 | 26,971,726 | 3.46E-09 | 26,294,215 | 1.39E-08 | 25,754,577 | 3.27E-10 | ||
| 6 | 135,927,582 | 3.33E-10 | 136,211,567 | 3.27E-09 | 136,211,567 | 1.84E-10 | 136,211,567 | 3.79E-09 |
| 8 | 8,119,195 | 5.19E-08 | 8,119,195 | 2.57E-09 | ||||
| 11 | 63,825,134 | 5.63E-07 | 63,825,134 | 6.83E-09 | 63,825,134 | 1.15E-09 | ||
| 12 | 79,259,640 | 9.35E-08 | 79,259,640 | 2.27E-07 | 79,259,640 | 3.55E-10 | 79,259,640 | 9.70E-07 |
| 15 | 99,555,171 | 2.20E-07 | 99,555,171 | 4.27E-08 | 99,555,171 | 8.48E-08 | 99,555,171 | 2.40E-06 |
| 16 | 15,916,062 | 1.96E-07 | 15,916,062 | 1.03E-09 | ||||
| 18 | 70,410,404 | 3.83E-08 | 70,197,956 | 1.66E-09 | 70,197,956 | 5.93E-10 | 70,410,404 | 6.38E-07 |
Abbreviations:
WBC White Blood Cell Counts [10^3/μl]
GRAN Granulocyte Cell Counts [10^3/μl]
MONO Monocyte Cell Counts [10^3/μl]
LYMPH Lymphocyte Cell Counts [10^3/μl]
The white cell loci were also examined for long range LD. As in the red cell loci, we observe no significant (R^2 > 0.8) LD between any loci, but do observe two suggestive (R^2 > 0.5) LDs between the chromosome 1 and 6 peaks, and the 15 and 18 peaks (Table S4).
Candidate Genes in Associated Loci
In order to identify candidate genes for these associated loci, we first calculated the boundaries of the linkage disequilibrium (LD) blocks that encompassed the peak SNPs for each locus based on the correlation of SNPs among the HMDP strains (see Methods). For example, Figure 5 shows LD blocks along chromosome 8. The peak SNP for monocyte and overall white blood cell counts lies at 8.1 Mb in a 700 kb LD block that spans from 7.9 to 8.6 Mb. Boundaries for LD blocks associated with the other blood-trait QTLs are listed in Table 3. The median LD block-size was about 1.5 Mb although the LD block on chromosome 7 determined in this manner was unusually large, spanning nearly 12 Mb. However, the p-values for SNPs associated with MCV on Chr.7 fell sharply (by > 2 logs) outside the region from 109.38 to 111.75Mb, providing a core LD block for this trait spanning only 2.4 Mb (Supplemental Figure 1).
Figure 5. Linkage disequilibrium (LD) structure (visualized as R^2>.8) on chromosome 8 encompassing the locus for monocyte and white blood cell counts.
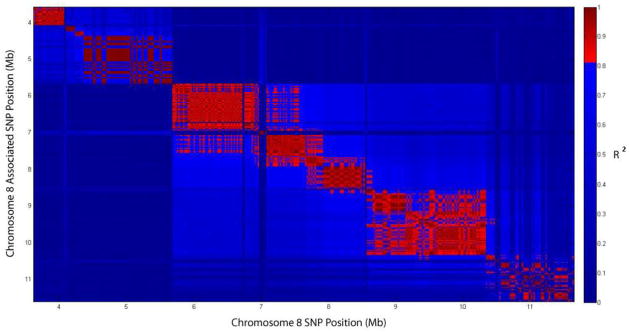
The peak SNP lies at 8.1 Mb in a ~700kb LD block from 7,915,722 to 8,647,388 bp. Horizontal axis is physical position of the SNP (Mb) while vertical axis is position of the associated SNP. Vertical bar on right shows color scale for correlation coefficient.
Table 3.
Candidate genes with non-synonymous mutations in LD blocks for blood phenotype QTLs
| Hemoglobin + RBC | |||
|---|---|---|---|
| chromosome | start position | end position | Genes with Nonsynonymous coding mutation or splice-site variations |
| 1 | 134,905,722 | 136,420,211 | Mdm4, Pik3c2b, Plekha6, Ren1, Etrik2, Sox13, Zc3h11a, Lax1, Atp2b4, Chi311, Mybch, Ppfia4, Cyb5r1, Rabif |
| 7 | 109,376,676 | 111,745,069 | Hbb-b1, Hbb-b2, Hbb-bh1, Hbb-bh2, Hbb-y and 19 other non-olofactory receptor genes |
| 11 | 55,901,493 | 59,445,442 | Fam 114a2, Mfap3, Galnt10, Larp1, Gemin5, Mrpl22, lgtp, lrgm2,Trim58, zfp39, Butr1,Trim17, Trim11, Obcscn, Gjc2, Mrpl55, Prss38, Jmjd4, Nlrp3 |
| 12 | 78,704,936 | 80,544,480 | Mpp5, Atp6v1d, Plekhh1, Pigh, Arg2, Vti1b, Zfyve26 |
| 16 | 13,716,171 | 16,326,370 | Pla2g10, pdxdc1, myh11, abcc1, prkdc |
| White Cell counts | |||
|---|---|---|---|
| chromosome | start position | end positian | Genes with Nonsynonymous coding mutations or splice-site variations |
| 1 | 25,822,356 | 26,780,378 | Gm9884,4931408C20Rik |
| 6 | 135,036,055 | 139,317,009 | gorc5d, hebp1, gsg1, pbp2 atf7ip, plbd1, Gucy2c, Wbp11, Art4, Mgp, Erp27, Ptpro, Eps8, Slc15a5, Mgst1, lgbp1b |
| 8 | 7,915,722 | 8,647,388 | Efnb2 |
| 11 | 63,581,579 | 64,044,219 | Hs3st3b1 |
| 12 | 78,704,936 | 80,544,480 | Mpp5, Atp6v1d, Plekhh1, Pigh, Arg2, Vti1b, Zfyve26 |
| 15 | 99,439,319 | 99,832,043 | Accn2, Smarcd1, Gpd1, Lass5, Lima1 |
| 16 | 13,716,171 | 16,326,370 | Pla2q10, pdxdc1, myh11, abcc1, prkdc |
| 18 | 69,977, 676 | 70,802,044 | ccdc68,2310002L13Rik, 4930503L19Rik, Stard6, Poli, Mbd2 |
To identify potential candidate genes for these QTLs, we determined which genes within the LD block exhibited either structural variation (non-synonymous variations in the coding sequence) or splice-site variations.
The genes exhibiting structural variation are shown in Table 3. The number of such candidate genes ranged from 1 to 16 per LD block except for the unusually gene-rich LD block on chromosome 7 that harbors nearly 110 such variants. However, 87 of these are from the olfactory-receptor gene family that populates this region of chromosome 7. Of the remaining 23 non-synonymous variants, 5 are from the hemoglobin gene family including Hbb-b1, thought to underlie the MCV QTL12.
For expression variation we examined local (likely cis-acting) eQTL in peritoneal macrophages26. The macrophages were studied under basal conditions (medium) or in the presence of an acute inflammatory agent (bacterial lipopolysaccharide, LPS) or a chronic inflammatory agent (oxidized phospholipids). We performed association analysis for global transcript levels to identify local (within 5 Mb of the gene) expression quantitative trait loci (eQTL), most likely acting in cis, and those distal to the gene likely acting in trans. Altogether, there are more than 9000 genes that show heritable expression at a false-discovery-rate (FDR) of <5%. We used these data to identify genes likely to have local (cis) eQTL in cells of the white blood cell lineage. Table 4 lists the genes for white blood cell loci that exhibited local eQTL within the associated LD block under basal conditions or following stimulation with LPS or oxidized lipids. Because these genes show genetically determined variation in expression that co-localizes with the white blood cell traits, they constitute additional candidates for genes that are causal for these traits.
Table 4.
Macrophage eQTL for genes at loci associated with blood cell traits in the HMDP
| gene | chromosome | position | p-value | macrophage | LPS | OxPAPC |
|---|---|---|---|---|---|---|
| Ptp4a1 | 1 | 26,101,763 | 3.9663E-06 | x | ||
| Emp1 | 6 | 135,272,118 | 6.6586E-12 | X | X | |
| Ptpro | 6 | 135,272,118 | 2.8697E-11 | X | X | X |
| Mgp | 6 | 135,274,624 | 2.922E-10 | x | X | X |
| H2afj | 6 | 135,607,348 | 5.3959E-16 | x | X | X |
| 8430419L09Rik | 6 | 135,607,348 | 8.14E-11 | X | ||
| Eps8 | 6 | 135,701,623 | 1.3198E-09 | X | X | |
| P1bd1 | 6 | 136,040,066 | 6.3669E-14 | X | X | X |
| Gpr19 | 6 | 136,040,694 | 1.5169E-17 | X | X | X |
| Arhgdib | 6 | 136,040,694 | 9.92E-09 | X | X | |
| Klra2 | 6 | 136,073,887 | 8.63E-07 | X | X | |
| Cdkon1b | 6 | 136,401,458 | 9.99 E-07 | X | X | |
| Ddx47 | 6 | 136,515,939 | 5.1766E-07 | X | X | |
| Dusp16 | 6 | 136,515,939 | 1.57E-06 | X | X | |
| Recql | 6 | 137,667,376 | 1.67E-06 | X | X | |
| Mgst1 | 6 | 138,540,068 | 1.8599E-08 | X | X | X |
| Arg2 | 12 | 79,687,143 | 1.2743E-11 | X | X | X |
| Atp6v1d | 12 | 79,687,143 | 1.6421E-06 | X | X | X |
| Eif2s1 | 12 | 79,687,143 | 2.0495E-21 | X | X | X |
| Vti1b | 12 | 79,687,143 | 5.2777E-07 | X | X | |
| Comt1 | 16 | 13,922,036 | 1.5192E-12 | X | X | X |
| Litaf | 16 | 14,087,146 | 5.2865E-08 | X | X | X |
| Pdxdc1 | 16 | 14,311,427 | 1.154E-39 | X | X | X |
| Mld2 | 16 | 14,438,272 | 1.0535E-09 | X | X | |
| Clec16a | 16 | 15,144,252 | 5.3751E-08 | X | X | X |
| Me2 | 18 | 69,977,676 | 2.8453E-07 | X | ||
| Smad4 | 18 | 70,571,511 | 4.3765E-12 | X | ||
| Stard6 | 18 | 70,627,066 | 5.6035E-12 | X | X | X |
| Chmp1b | 18 | 70,802,044 | 3.4346E-13 | X | X | X |
under basal [medium] condition
Following LPS treatment
Following axidized phospholipid treatment
DISCUSSION
We have used association analysis with correction for population structure to map multiple loci for blood cell traits. The results confirm some previous findings and identify a number of novel loci. They also demonstrate the greatly increased mapping resolution for association as compared to linkage analysis in mice.
There have been a number of recent efforts using linkage and GWAS to map loci underlying blood cell traits both in mice 12,13 and in humans 7,8,27. The major QTL we observed on mouse chromosome 7 was also reported by previous investigators12,13 and appears to arise from ancestral blocks carrying coding variations in duplicated adult hemoglobin genes 12. Thus, for strains that carry different alleles of this locus, there is a strong impact on hemoglobin hydration resulting in the reported difference in mean corpuscular hemoglobin concentration. The related traits of HCT, RDW and MCV are logically modulated by the same structural modification of the hemoglobin molecule and show correspondingly strong QTLs at the same locus. None of the human GWAS studies of blood cell traits7,8,27 have reported a corresponding QTL. Thus, similar coding variations in hemoglobin among the studied human populations are not sufficiently common to have produced a significant corresponding QTL.
Several other red cell QTLs that we observed in mice are replicated by QTLs seen in a recent GWAS study of red cell phenotypes of 135 thousand individuals of European and South Asian ancestry10. For instance, the LD block encompassing the hematocrit/hemoglobin QTL on chromosome 1 (Table 1) contains a non-synonymous SNP in the Atp2b4 gene (Table 3), a gene that was also identified as potentially causal for a MCHC QTL in the human study. Atp2b4 is a peripheral membrane calcium ATPase with no obvious connection to hemoglobin synthesis or structure but, the coincidence of GWAS results in human and mouse suggest that this gene may play a novel role in red blood cell metabolism. Similarly, potential candidate genes for the RBC QTL on Chr.11 (Table 3) include Trim58, a gene also identified in the human study10. Trim58 (tripartite motif-containing 58) is strongly expressed in bone marrow but has no established function. For the Chr 12 and Chr 16 RBC QTLs (Tables 1 and 3), none of the candidate genes we identified within the central LD block correspond to candidate genes in human GWAS studies. However, the recent human GWAS10 does appear to have identified syntenic loci. For instance, the human study identified FNTB (farnesyltransferase, CAAX box, beta), MAX (max protein) and SMOC1 (SPARC related modular calcium binding 1) as candidates for genes impacting MCV or MCH. In mice, these genes are located on Chr 12 at 76.8 Mb, 76.9 Mb and 81 Mb, respectively, immediately flanking the central LD block (78.7 to 80.5 Mb) (Table 3). Moreover, both Fntb and Smoc1 carry non-synonymous SNPs among inbred strains that might underlie functional variation affecting red blood cell traits. Similarly, human GWAS identified YDJC (YdjC bacterial homolog) and UBE2L3 (ubiquitin-conjugating enzyme E2L 3) as candidates for genes impacting MCV. In mice, these genes map to Chr 16 at about 17.1 Mb, immediately distal to the central QTL (Tables 1 and 3).
Peters et al. 12 observed a QTL for red cell hemoglobin content in 3 or 4 of the 12 mouse crosses studied. The fact that no such QTL is observed in the present study suggests that the responsible alleles are not widespread in the HMDP panel or that the effect of these alleles is relatively small, or both.
For white blood cell traits, the chromosome 18 QTL was seen in linkage studies of incipient lines from the collaborative cross 13. In addition, for the same locus, we observed strong QTL for all the white cell subtypes with the most significant being that for monocyte counts (Table 2). Finally, we observed significant WBC QTLs on chromosomes 1, 6, 8, 11, 12, 15 and 16 that were not seen in the collaborative cross. In contrast to the very high frequency of RBC locus-replication that we see between our mouse study and published human data, none of the white blood cell loci found in the HMDP was replicated in recent human GWAS analyses7,9. In part, this could be due to the size of the available human studies. The van der Harst mapping of RBC-related phenotypes10 involved over 135,000 subjects while two recent GWAS studies of WBC-related phenotypes analyzed only 19,509 subjects4 and 16,388 subjects6. Moreover, because of the very large numbers of biological processes and environmental factors that likely impact inflammatory pathways, it seems probable that WBC genetics is more complex than that of RBC and that differences in environment may play a larger role in obscuring WBC QTLs. Finally, there may be some major differences in the key determinants of WBC numbers between mice and men so that genetic variation at a locus may have much higher impact in one species that the other.
As discussed in a recent review of genome wide association studies in mice28, there is a tradeoff in power, resolution, and repeatability of the various approaches. The classic linkage approach has high power to detect the impact of genetic variants but the resolution is limited because of the small number of generations in which recombination can occur. Also, the number of genetic variants is limited to those found in the two parental strains. Moreover, the necessity to breed all the animals in a cross confers a high cost in time and resources before phenotyping can begin and, because each of the progeny is unique, there is a requirement to genotype every animal and no opportunity to do follow-up studies on additional animals of any given genotype. Peters et al.12 partially overcame the issue of resolution by combining the results a dozen different crosses involving thousands of animals, but such a herculean effort is daunting to contemplate for most genetic studies. The collaborative cross avoids the necessity of breeding or genotyping because it involves the use of stock recombinant inbred strains and, because the collaborative cross strains incorporate the genomes of several wild-derived strains, there is the opportunity to monitor the impact of a much larger set of genetic variants than is available in a classic cross or the HMDP. Ultimately, while the collaborative cross has constraints in resolution because of the limited number of generations for recombination in each strain, when they become available the large number of strains should help to overcome any resolution issues. It is exciting to see the debut of this effort in the mapping of hematologic traits by Kelada et al.13 The HMDP combines results from recombinant inbred strains, which give power approaching that of an F2 cross, and results from classic inbred strains confer high resolution due to the high number of generations that separate each strain from ancestral stocks. In fact, the HMDP is predicted to have resolution of about 2 Mb28 which is consistent with the size of the LD blocks that we report here. The need to correct for population structure in the HMDP reduces power28 and residual population structure after correction has the potential to produce false positives. Although we observed several instances of suggestive LD between pairs of loci, we conclude that this is not a major problem in the present study due to the fact that all of the red blood cell loci were replicated in previous mouse studies or in human GWAS. Genetic diversity is limited in the HMDP relative to the collaborative cross due to the decision to exclude wild derived strains in favor of better population structure corrections. In principle, this would lead to decreased ability to detect relevant QTL. However, at least in comparison to the initial collaborative cross studies by Kelada et al., this does not seem to be a large problem.
In summary, GWAS in human populations have been very successful in identifying loci for diseases and disease-related traits, but such studies have limited ability to examine gene-by-gene or gene-by-environment interactions, and the loci generally account for a very small fraction of the variance of the traits. Studies of natural variation in animal models can complement human studies by allowing analyses under controlled conditions and the examination of intermediate phenotypes such as transcript levels in tissues. An understanding of the genetic variation contributing to hematopoietic traits among common inbred strains may help explain differences in susceptibility to atherosclerosis, infection, and cancer.
Supplementary Material
Acknowledgments
This work was supported by NIH grants HL30568 and HL28481.
Footnotes
Authorship Contributions
AvN analyzed data and wrote the paper; RCD performed research and wrote the paper; BB performed research; LO performed research; CP analyzed data; CDR analyzed data; EE designed analysis software; AJL designed the research and wrote the paper.
Conflict of Interest Disclosures
The authors have nothing to disclose.
References
- 1.Reshef DN, Reshef YA, Finucane HK, et al. Detecting novel associations in large data sets. Science. 2011;334:1518–1524. doi: 10.1126/science.1205438. [DOI] [PMC free article] [PubMed] [Google Scholar]
- 2.Gillum RF, Mussolino ME, Madans JH. Counts of neutrophils, lymphocytes, and monocytes, cause-specific mortality and coronary heart disease: the NHANES-I epidemiologic follow-up study. Ann Epidemiol. 2005;15:266–271. doi: 10.1016/j.annepidem.2004.08.009. [DOI] [PubMed] [Google Scholar]
- 3.Lloyd-Jones DM, Camargo CA, Allen LA, Giugliano RP, O’Donnell CJ. Predictors of long-term mortality after hospitalization for primary unstable angina pectoris and non-ST-elevation myocardial infarction. Am J Cardiol. 2003;92:1155–1159. doi: 10.1016/j.amjcard.2003.07.022. [DOI] [PubMed] [Google Scholar]
- 4.Shankar A, Wang JJ, Rochtchina E, Yu MC, Kefford R, Mitchell P. Association between circulating white blood cell count and cancer mortality: a population-based cohort study. Arch Intern Med. 2006;166:188–194. doi: 10.1001/archinte.166.2.188. [DOI] [PubMed] [Google Scholar]
- 5.Evans DM, Frazer IH, Martin NG. Genetic and environmental causes of variation in basal levels of blood cells. Twin Res. 1999;2:250–257. doi: 10.1375/136905299320565735. [DOI] [PubMed] [Google Scholar]
- 6.Garner C, Tatu T, Reittie JE, et al. Genetic influences on F cells and other hematologic variables: a twin heritability study. Blood. 2000;95:342–346. [PubMed] [Google Scholar]
- 7.Nalls MA, Couper DJ, Tanaka T, et al. Multiple loci are associated with white blood cell phenotypes. PLoS Genet. 2011;7:e1002113. doi: 10.1371/journal.pgen.1002113. [DOI] [PMC free article] [PubMed] [Google Scholar]
- 8.Soranzo N, Spector TD, Mangino M, et al. A genome-wide meta-analysis identifies 22 loci associated with eight hematological parameters in the HaemGen consortium. Nat Genet. 2009;41:1182–1190. doi: 10.1038/ng.467. [DOI] [PMC free article] [PubMed] [Google Scholar]
- 9.Reiner AP, Lettre G, Nalls MA, et al. Genome-wide association study of white blood cell count in 16,388 African Americans: the continental origins and genetic epidemiology network (COGENT) PLoS Genet. 2011;7:e1002108. doi: 10.1371/journal.pgen.1002108. [DOI] [PMC free article] [PubMed] [Google Scholar]
- 10.van der Harst P. Seventy-five genetic loci influencing the human red blood cell. Nature. 2012 doi: 10.1038/nature11677. advance online publication. [DOI] [PMC free article] [PubMed] [Google Scholar]
- 11.Farber CR, Bennett BJ, Orozco L, et al. Mouse genome-wide association and systems genetics identify Asxl2 as a regulator of bone mineral density and osteoclastogenesis. PLoS Genet. 2011;7:e1002038. doi: 10.1371/journal.pgen.1002038. [DOI] [PMC free article] [PubMed] [Google Scholar]
- 12.Peters LL, Shavit JA, Lambert AJ, et al. Sequence variation at multiple loci influences red cell hemoglobin concentration. Blood. 2010;116:e139–149. doi: 10.1182/blood-2010-05-283879. [DOI] [PMC free article] [PubMed] [Google Scholar]
- 13.Kelada SN, Aylor DL, Peck BC, et al. Genetic analysis of hematological parameters in incipient lines of the collaborative cross. G3 (Bethesda) 2012;2:157–165. doi: 10.1534/g3.111.001776. [DOI] [PMC free article] [PubMed] [Google Scholar]
- 14.Flint J, Valdar W, Shifman S, Mott R. Strategies for mapping and cloning quantitative trait genes in rodents. Nat Rev Genet. 2005;6:271–286. doi: 10.1038/nrg1576. [DOI] [PubMed] [Google Scholar]
- 15.Bennett BJ, Farber CR, Orozco L, et al. A high-resolution association mapping panel for the dissection of complex traits in mice. Genome Res. 2010;20:281–290. doi: 10.1101/gr.099234.109. [DOI] [PMC free article] [PubMed] [Google Scholar]
- 16.Kang HM, Zaitlen NA, Wade CM, et al. Efficient control of population structure in model organism association mapping. Genetics. 2008;178:1709–1723. doi: 10.1534/genetics.107.080101. [DOI] [PMC free article] [PubMed] [Google Scholar]
- 17.Davis RC, van Nas A, Castellani LW, et al. Systems genetics of susceptibility to obesity-induced diabetes in mice. Physiol Genomics. 2012;44:1–13. doi: 10.1152/physiolgenomics.00003.2011. [DOI] [PMC free article] [PubMed] [Google Scholar]
- 18.Horvat S, Bunger L. Polymerase chain reaction-restriction fragment length polymorphism (PCR-RFLP) assay for the mouse leptin receptor (Lepr(db)) mutation. Lab Anim. 1999;33:380–384. doi: 10.1258/002367799780487850. [DOI] [PubMed] [Google Scholar]
- 19.Laurie CC, Nickerson DA, Anderson AD, et al. Linkage disequilibrium in wild mice. PLoS Genet. 2007;3:e144. doi: 10.1371/journal.pgen.0030144. [DOI] [PMC free article] [PubMed] [Google Scholar]
- 20.Broman KW, Wu H, Sen S, Churchill GA. R/qtl: QTL mapping in experimental crosses. Bioinformatics. 2003;19:889–890. doi: 10.1093/bioinformatics/btg112. [DOI] [PubMed] [Google Scholar]
- 21.van Nas A, Ingram-Drake L, Sinsheimer JS, et al. Expression quantitative trait loci: replication, tissue- and sex-specificity in mice. Genetics. 2010;185:1059–1068. doi: 10.1534/genetics.110.116087. [DOI] [PMC free article] [PubMed] [Google Scholar]
- 22.Hedrick CC, Castellani LW, Warden CH, Puppione DL, Lusis AJ. Influence of mouse apolipoprotein A-II on plasma lipoproteins in transgenic mice. J Biol Chem. 1993;268:20676–20682. [PubMed] [Google Scholar]
- 23.Puppione DL, Charugundla S. A microprecipitation technique suitable for measuring alpha-lipoprotein cholesterol. Lipids. 1994;29:595–597. doi: 10.1007/BF02536633. [DOI] [PubMed] [Google Scholar]
- 24.Krzywinski M, Schein J, Birol I, et al. Circos: an information aesthetic for comparative genomics. Genome Res. 2009;19:1639–1645. doi: 10.1101/gr.092759.109. [DOI] [PMC free article] [PubMed] [Google Scholar]
- 25.Payseur BA, Place M, Weber JL. Linkage disequilibrium between STRPs and SNPs across the human genome. Am J Hum Genet. 2008;82:1039–1050. doi: 10.1016/j.ajhg.2008.02.018. [DOI] [PMC free article] [PubMed] [Google Scholar]
- 26.Orozco LD, Bennett BJ, Farber CR, et al. Unraveling Inflammatory Responses using Systems Genetics and Gene-Environment Interactions in Macrophages. Cell. 2012;151:658–670. doi: 10.1016/j.cell.2012.08.043. [DOI] [PMC free article] [PubMed] [Google Scholar]
- 27.Ganesh SK, Zakai NA, van Rooij FJ, et al. Multiple loci influence erythrocyte phenotypes in the CHARGE Consortium. Nat Genet. 2009;41:1191–1198. doi: 10.1038/ng.466. [DOI] [PMC free article] [PubMed] [Google Scholar]
- 28.Flint J, Eskin E. Genome-wide association studies in mice. Nat Rev Genet. 2012;13:807–817. doi: 10.1038/nrg3335. [DOI] [PMC free article] [PubMed] [Google Scholar]
Associated Data
This section collects any data citations, data availability statements, or supplementary materials included in this article.


