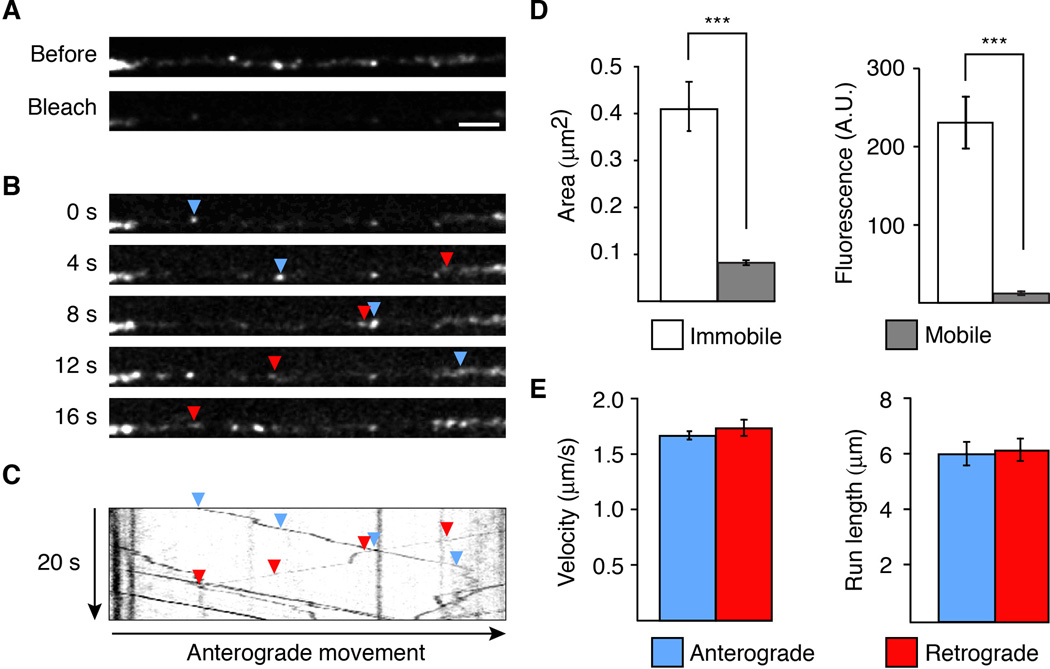
Figure 1. GLR-1∷GFP is transported in both an anterograde and retrograde direction along the AVA processes.
(A) Confocal images of GLR-1∷GFP puncta in the proximal AVA processes before (top) and after (bottom) photobleaching. Scale bar represents 2.5 µm. (B) Higher gain images of the region shown in (A) at various time points after photobleaching. The arrowheads indicate anterograde (blue) and retrograde (red) movement. (C) Kymograph showing mobile and immobile GLR-1∷GFP vesicles in the photobleached region shown in (A). (D) Measurement of the area (left) and average total fluorescence (right) of immobile and mobile GLR-1∷GFP, n>100 immobile; n>450 mobile. *** p<0.001. (E) Quantification of the velocity (left) and run length (right) of mobile GLR-1∷GFP vesicles, n>450 vesicles. Error bars indicate standard error of the mean (SEM).
See also Figure S1.

