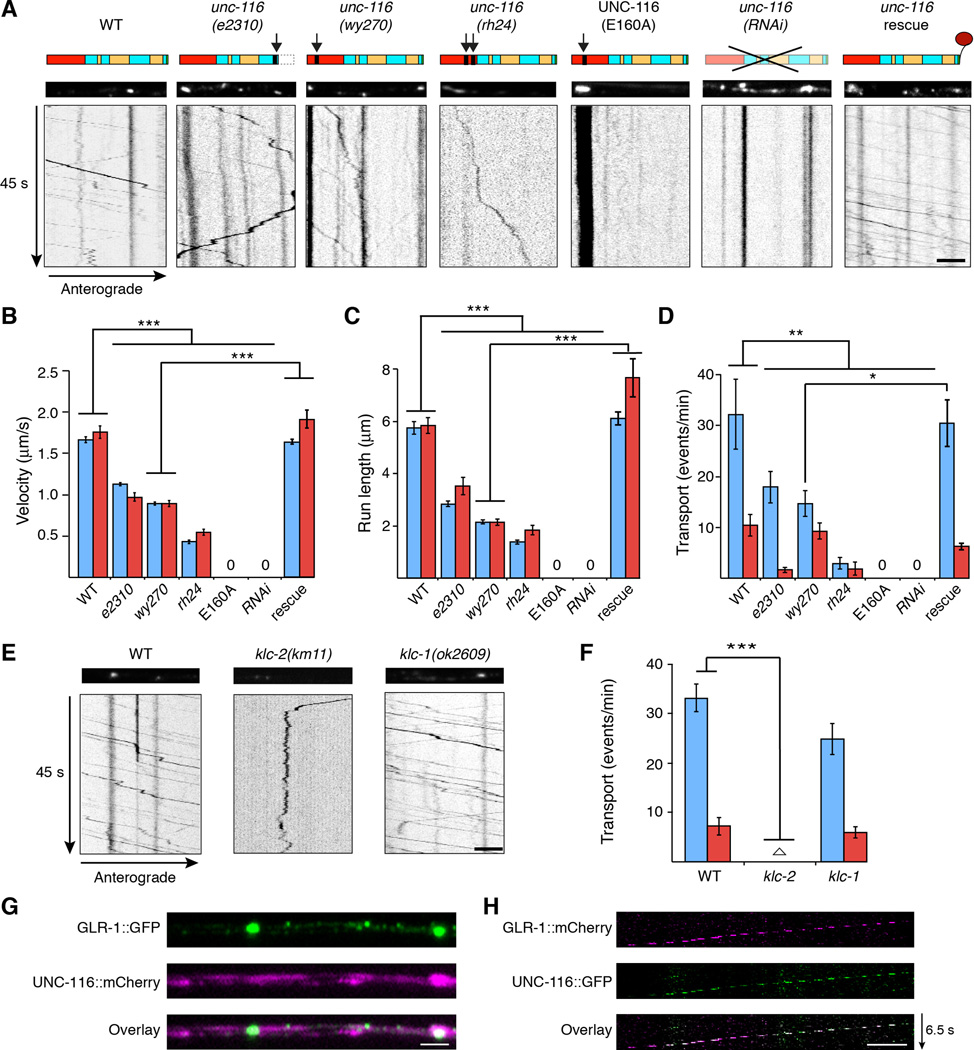
Figure 4. Bidirectional transport of GLR-1 is dependent on UNC-116/KIF5.
(A) Schematic of UNC-116/KIF5 (top). Arrows indicate the location of the mutation for each allele (Table S1). Red and yellow boxes represent the motor domain and coiled coil domains, respectively. Confocal images (middle) and kymographs (bottom) of GLR-1∷GFP in the AVA processes. Scale bar represents 2.5 µm. (B–D) Quantification of anterograde (blue) and retrograde (red) vesicle velocity (B), run length (C), and the frequency of transport events (D), n=10 worms. “0” indicates no measurable mobile vesicles. (E) Confocal images (top) and kymographs (bottom) of GLR-1∷GFP in the AVA processes in WT, klc-2(km11) and klc-1(ok2809). Scale bar represents 5 µm. (F) Quantification of the frequency of transport events. Empty triangle in klc-2 represents anterograde = 0.22 events/min and retrograde = 0.17 events/min, n=5. (G) Images of GLR-1∷GFP and UNC-116∷mCherry in the AVA processes of a transgenic worm. Scale bar represents 2 µm. (H) Kymograph showing retrograde co-movement of GLR-1∷mCherry and UNC-116∷GFP in AVA. The breaks in fluorescence are secondary to limited streaming capacity. Scale bar represents 2.5 µm.
* p<0.05, ** p<0.01, *** p<0.001. Error bars indicate SEM.
See also Figures S3, S4 and S5.

