Abstract
Background
Amnestic MCI (aMCI) is associated with an elevated risk of progressing to Alzheimer’s disease. Much less is known about the course of dysexecutive MCI (dMCI). The goals of this study were to determine: How the profile of cognitive deficits differs over time between patients with dMCI, aMCI, and control subjects; if the type of dementia differs between dMCI and aMCI in patients who progress to dementia; and if dMCI is more associated with strokes and white matter hyperintensities on MRI than aMCI.
Methods
A prospective evaluation of an inception cohort of 1167 ethnically-diverse elders recruited from an urban community-based sample and followed with clinical and neuropsychological testing over an average of 4.5 years (SD=0.8). A subset of the subjects had MRI scans. We compared four groups of MCI patients: single domain amnestic and dysexecutive MCI and multiple domain MCI with and without executive dysfunction.
Results
Compared with aMCI, dMCI was less likely to involve other areas of cognition over time and progress to dementia. None of the 33 single domain dMCI patients progressed to dementia. The presence of executive dysfunction in multiple domain MCI did not increase risk of progression to dementia. Patients with multiple domain MCI with executive dysfunction who progressed to dementia were less likely to have an Alzheimer’s type dementia than MCI patients without executive dysfunction. Patients with dMCI were more likely to have strokes, but not white matter hyperintensities, detected on MRI than patients with aMCI.
Conclusions
DMCI appears to follow a different course, and be less associated with AD and more associated with stroke, than aMCI.
Background
Mild Cognitive Impairment (MCI) commonly occurs as a transitional state from normal cognition to dementia [1]. Deficits in MCI can involve separate areas of cognition, either in isolation or in combination. Amnestic MCI (aMCI) is the most common type of single-domain MCI, but MCI can involve other domains such as executive function (dMCI) [1, 2]. In a previous study, we determined the relative prevalence and risk of progressing to dementia of the different subtypes of MCI in a multiethnic, community-based sample [1]. In the current study, we expand on these findings by addressing the following questions: how does the profile of cognitive deficits change over time between aMCI and dMCI, if dementia develops does the type of dementia differ in these two conditions, and is dMCI more associated with cerebrovascular disease than aMCI?
We focused on dMCI because much less is known about the course and progression of dMCI than of aMCI. Over 20 studies have already been performed to determine the rates of conversion from MCI to dementia (see [3] for a review of 15 of these studies). These studies have revealed that, contrary to initial supposition, non-amnestic single domain MCI is as common or more common than single domain amnestic MCI in community-based samples [4–6]. They also indicate that non-amnestic single domain MCI is significantly less likely to progress to dementia than aMCI. With the possible exception of non-amnestic, multiple domain MCI [6], all of the subtypes of MCI are more likely to progress to AD compared to other types of dementia [4, 5]. However these studies did not subdivide non-amnestic single domain MCI into its component cognitive domains, as we have done in the current study. The current study compares the changes in the pattern of cognitive deficits over time between aMCI and dMCI. Of the longitudinal studies that examined subtypes of MCI [1, 6–8], only the previous study from our group[1] and the current study were performed using a community-based ethnically diverse sample. Of note, several of the large, multicenter studies currently underway, including the Alzheimer’s Disease Neuroimaging Initiative (ADNI) and the Alzheimer’s Disease Research Centers (ADRC), are poorly suited to determine the prevalence and course dMCI as they selectively recruit subjects with aMCI, but not other subtypes of MCI, in restricted clinical settings rather than the broader home-dwelling community.
In epidemiological studies, MCI is associated with an annual conversion rate to dementia of 4.2% [3], although this rate varies considerably across studies [9]. Among the subtypes of MCI, aMCI and multi-domain MCI with memory impairment appear to be at highest risk for progression to Alzheimer’s disease (AD) [1]. It has been hypothesized that non-amnestic types of MCI are more likely to progress to non-Alzheimer’s dementias (e.g., vascular dementia and frontotemporal lobar degeneration), however this has not yet been demonstrated [9, 10]. Vascular risk factors are associated with both executive dysfunction in non-demented elderly [11, 12] and a worsening of the symptoms of AD [13]. Vascular dementia is more likely to have deficits in executive function than AD [14]. In the current study, we attempt to answer the following questions: Do aMCI and dMCI differ in their pattern of cognitive deficits over time, if they progress to dementia does the type of dementia differ between aMCI and dMCI, and is dMCI more associated with cerebrovascular disease than aMCI? To address these questions we compared four MCI groups: Single domain amnestic and dysexecutive type and multiple domain with or without executive dysfunction. The diagnoses of aMCI and dMCI are commonly used. Multiple domain MCI with and without executive dysfunction are uncommon categories of MCI, but we used them because our main goal was to explore the effects of executive dysfunction on progression of MCI and conversion to dementia in both single and multiple domain MCI.
Methods
Subjects
The Columbia University Institutional Review Board approved this project. All subjects discussed the study with an investigator and provided informed consent. This study was performed in a multiethnic, community-based sample in Northern Manhattan [1]. The sampling strategy, detailed in previous publications [15–17], was designed to assemble an ethnically diverse sample representative of the community in which they lived, and not enriched for particular characteristics or diagnoses. Medicare recipients aged 65 or older residing in three contiguous census tracts in the neighborhoods of Washington Heights and Inwood were invited to participate in the study (the WHICAP study). Subjects were excluded from the study if they did not speak English or Spanish. There were two recruitment efforts, one beginning in 1992 and the other in 1999. Ethnic group was determined by self-report using the format of the 2000 US Census [18].
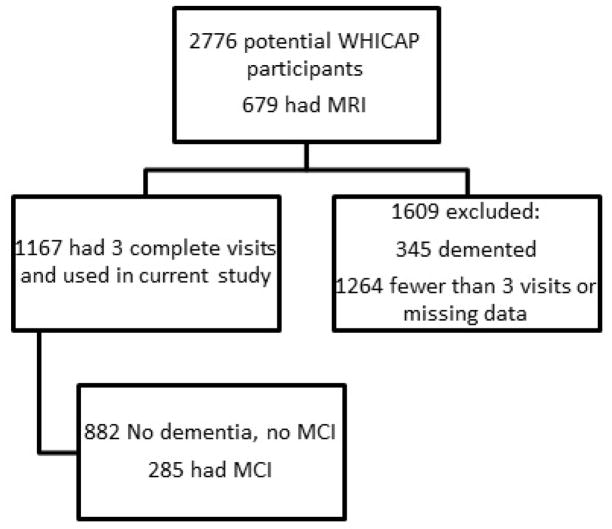
Subjects were diagnosed on their initial visit and categorized for the current analyses based on this initial diagnosis. See Figure 1 for a flow diagram of enrollment. They were revaluated approximately every 18 to 30 months. The mean total follow up was 4.5 years with a SD of 0.8 years. Only subjects who completed 3 sequential visits were used for this study, i.e., if a subject dropped out or missed a visit, they were excluded from the entire analysis. While this reduced the number of subjects we could include in the longitudinal analysis, it ensured that the same subjects were compared at all time points.
Figure 1. Flow diagram of study enrollment.
We performed t-tests between the subjects that were included and excluded to assess if there were any systematic differences between the two groups. Age, education, Short Blessed Exam Total [19], and the Blessed Functional Activity Scale [20] were compared between the two groups. A Bonferroni corrected p<0.05 level was used to determine significance.
MCI and neuropsychological testing
The method for diagnosing MCI was identical to that used in [1] in which expanded Petersen criteria were used to include other subtypes of MCI besides aMCI [21]. MCI was diagnosed in a consensus conference by a group of physicians and psychologists based on a review of all of the neuropsychological, clinical, neurological, psychiatric, and functional data. The consensus was blinded to the previous consensus diagnosis. The expanded Petersen MCI criteria used in this study for single domain MCI were: (1) a cognitive complaint, (2) essentially preserved activities of daily living (defined below), (3) objective impairment in one area of cognition defined as below 1.5 SD on an average composite measure (defined below) of memory, executive function, language, or visuospatial function, (4) All other composite scores ≥ 1.5 SD below the demographically corrected mean, and (5) not demented (as diagnosed in the consensus conference by Diagnostic and Statistical Manual of Mental Disorders, Third Edition, Revised criteria) [22]. Essentially preserved activities of daily living were defined as self or caregiver report of difficulty on less than 3 of 6 items from the Disability and Functional Limitations scale as specified in [1]. This cutoff was used because it captured 95% of the normative sample.
For the MCI criterion of objective impairment in an area of cognition, composite measures of four domains of cognition (memory, executive function, language, and visuospatial) were constructed by converting the scores for the tests listed below into z-scores and then calculating the mean as detailed in [1]. The memory measure was the average composite of the total recall and delayed free recall from the Selective Reminding Test, and recognition from the BVRT. The executive function measure was the average composite of letter fluency, category fluency, and the Wechsler Adult Intelligence Scale – Revised Similarities subtest. The language measure was the average composite of the Boston Naming Test, and the BDAE Repetition and Comprehension tests. The visuospatial measure was the average composite of Rosen Drawing and BVRT matching. Each study participant was judged as having a deficit in one of these domains of cognition if their composite score fell below 1.5 SD of the age, years of education, ethnicity and sex –adjusted prediction as calculated in a robust normative sample of non-demented older adults [15].
Two types of multiple domain MCI were used in this study: MCI-multiple cognitive domains with (MCI-MCDE) and without (MCI-MCDN) executive impairment. MCI-MCDE was defined as meeting criteria for dMCI as above with additional impairment in at least one additional cognitive domain. MCI-MCDN was defined as impairment in two or more of the three nonexecutive cognitive domains (memory, language, visuospatial) without executive impairment. The categories of MCI are mutually exclusive.
Data Analyses
Generalized Estimating Equations (GEE) were used to compare the slope of cognitive change in memory, executive function, visuospatial, and language between the subjects without dementia or MCI and the subjects in the following four groups: aMCI, dMCI, MCI-MCDE, and MCI-MCDN. GEE is a semiparametric regression technique that, unlike logistic regression which assumes independence, takes into account that data from the multiple visits of a subject are likely to be correlated [23, 24]. Separate GEE analyses were performed on the factor scores for each of the four cognitive domains previously listed. In the GEE model, the dependent variable was the composite neuropsychological score for each domain and the predictors were the subtype of MCI and the time elapsed since entry into the study. The non-demented non-MCI group was used as the reference group to which the MCI subjects were compared. Main effects and interactions between the MCI subgroups (“diagnosis”) and the time elapsed (“duration”) were calculated. A significant interaction between the MCI subgroups and time elapsed in the GEE analysis reflects a significant difference between the change in the neuropsychological score over time (i.e., the slope) between the MCI subgroup and the non-demented non-MCI group. Conversion to different types of dementia between the MCI subgroups was compared with a Kaplan-Meier survival analysis.
There were no significant differences in the included and excluded dMCI and MCI-MCDN patients on age, education, Short Blessed Exam Total [19], or the Blessed Functional Activity Scale [20]. In the aMCI group, subjects who were excluded were 1.4 years older on average than subjects who were included. In the MCI-MCDE group, the subjects who were excluded were an average of 2.6 years older, and had a Short Blessed Exam Total that was 0.28 points (out of 28) higher than those who were included (although their mean Short Blessed Exam Total was 0.66, which is well within normal limits for this test). We concluded that the cognitive differences between the included and excluded groups were minimal and the MCI patients we included in our analyses were representative of the larger sample, albeit that the included aMCI and MCI-MCDE patients were slightly younger than the not included patients.
Imaging analyses
Of the 2,776 WHICAP active study participants, 769 had an MRI scan as part of the study. The scan was usually given on the subject’s 3rd visit. The mean time elapsed between entry into the study and the scan was 4.4 years (SD=0.9) – very close to the mean time for the third evaluation (4.5 years). Scan acquisition was performed on a 1.5T Philips Intera scanner at Columbia University Medical Center. Fluid-attenuated inversion recovery (FLAIR)-weighted images (repetition time [TR] = 11,000ms, echo time [TE] = 144.0ms, inversion time = 2,800ms, field of view [FOV] = 25cm, number of excitations [nex] = 2, matrix size = 256 × 192, with slice thickness = 3mm) were acquired in the axial orientation, as were T1-weighted images (TR = 20ms, TE = 2.1ms, FOV = 240cm, matrix size = 256 × 160, with slice thickness = 1.3mm). MR images were transferred electronically to the University of California at Davis for analysis in the Imaging of Dementia and Aging Laboratory. The presence or absence of brain infarction on MRI was determined using all available images, including T1-weighted images, T2-weighted FLAIR images, and proton density/T2-weighted double-echo images. Lesions had to be > 3 mm to be considered an infarction. Infarcts of 1cm or less were defined as small, and infarcts of more than 1cm were defined as large. Two raters determined the presence of cerebral infarction on MRI. Previously published j values for agreement among raters has been generally good, ranging from 0.73 to 0.90 [25, 26]. White matter hyperintensities (WHI) were measured by isolating the brain on FLAIR images, identifying the voxels with intensity 3.5 SD or greater above the mean intensity value of the image, and multiplying these voxels by voxel dimensions and section thickness. See [27–30] for details of this procedure. The number of infarcts and volume of WHI were compared between the MCI groups using ANOVAs.
Results
Cognitive Testing
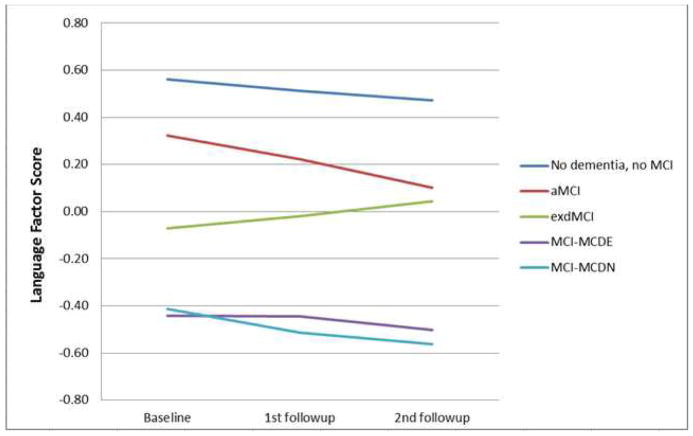
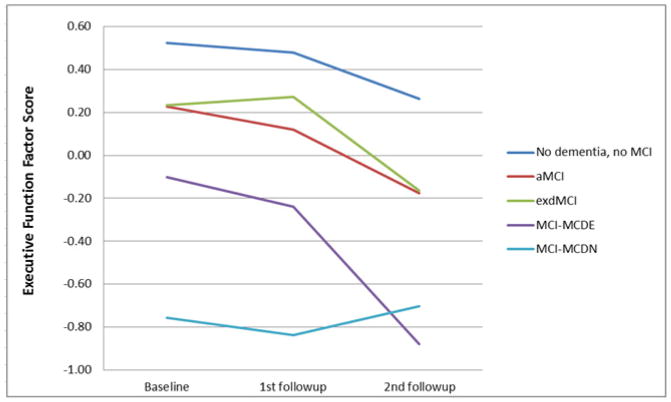
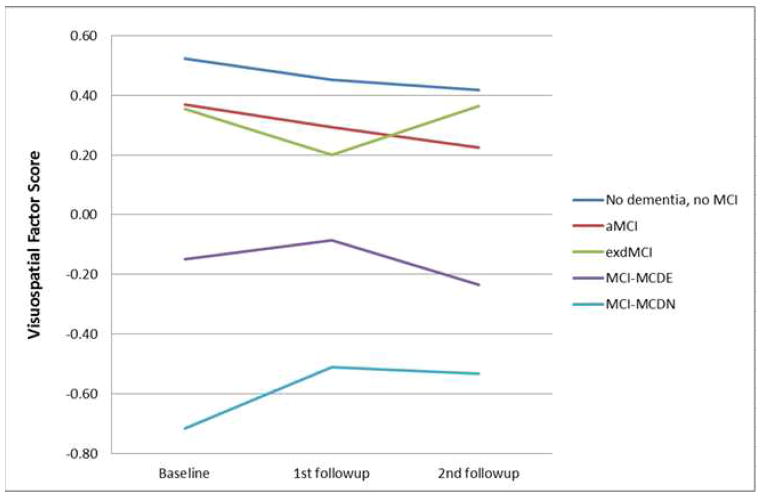
Separate GEE analyses were performed on the four cognitive domains and Bonferroni corrected for four comparisons. For all of the cognitive domains tested, there were significant main effects of duration and diagnosis, indicating that, in each cognitive domain, cognitive scores differed between the patients with different MCI diagnoses and those scores changed over time. We were most interested in the interaction of duration and diagnosis to determine if the MCI groups had different changes in cognitive scores over time. For memory, there was no significant interaction between duration and diagnosis. See Figure 2a. In the language domain, the aMCI patients had a significant decline (B=−0.029, p=0.003), and the dMCI patients had a significant improvement (B=0.042, p=0.001), compared to the subjects without dementia or MCI (Figure 2b). In the visuospatial domain, the MCI-MCDN had less decline than the subjects without dementia or MCI (B=0.043, p=0.047), but this effect did not survive correction for multiple comparisons (Figure 2c). The MCI-MCDE patients had significantly greater executive function decline than the subjects without dementia or MCI (B=−0.108, p=0.002) (Figure 2d). All other interactions were not significant.
Figure 2. Cognitive changes over time.
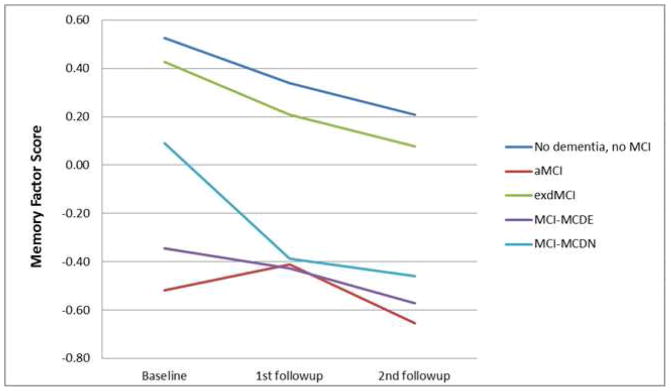
Changes in cognitive performance over time in different domains of cognition in patients with aMCI, dMCI, MCI-MCDE, MCI-MCDN, and patients without dementia or MCI. MCI=Mild Cognitive Impairment. aMCI-=Amnestic MCI, dMCI=Dysexecutive MCI, MCI-MCDE=Multidomain MCI with executive dysfunction. MCI-MCDN= Multidomain MCI without executive dysfunction.
(a) Language factor score
(b) Memory factor score
(c) Executive function factor score
(d) Visuospatial factor score
Progression to dementia
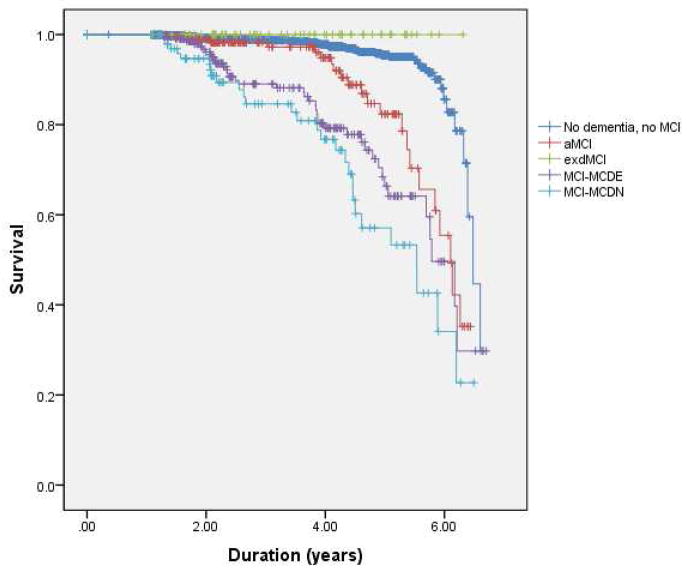
The patients were followed for an average of 4.5 years (SD=0.8). See Table 1 for subjects who received a diagnosis of dementia at any point during the four year follow-up. Of note, none of the patients with dMCI developed dementia. The proportion of patients with aMCI (21%), dMCI (0%), MCI-MCDE (25%), and MCI-MCDN (39%) who developed dementia was significantly different (χ2(1) = 17.55, p < 0.001). The Kaplan-Meier analysis showed that the MCI groups had significantly different rates of progression to dementia (Log-Rank Mantel-Cox, chi χ2(1) = 142, p<0.001) (Figure 3). See Table 1 for mean and median survival times to dementia from the Kaplan-Meier analysis.
Table 1. Demographic and clinical characteristics of the subjects.
Subjects had a baseline visit and two biannual follow-up visits for a total of 4 to 6 years of follow-up after the initial visit. See Methods section for details of diagnosis of Mild Cognitive Impairment (MCI) and dementia. The mean and median survival times to dementia were calculated from the Kaplan-Meier curve (see Methods section). A vascular risk score was calculated for each subject at the initial visit. This consisted of assigning the value of 1 to the presence of each of the following vascular risk factors: hypertension, diabetes mellitus, history of stroke, history of myocardial infarction, history of peripheral vascular disease. Thus, each subject was assigned a score of 0 (no vascular risk factors) to 5 (all of the vascular risk factors).
| No dementia or MCI | aMCI | dMCI | MCI-MCDE | MCI-MCDN | |
|---|---|---|---|---|---|
| n | 882 | 98 | 33 | 103 | 51 |
| Mean age (years) (SD) | 76 (6.2) | 77 (5.3) | 74 (5.7) | 76 (6.3) | 80 (8.2) |
| Mean education (years) (SD) | 11 (4.5) | 11 (4.6) | 12 (3.4) | 11 (3.4) | 7 (5.1) |
| White, % | 35 | 34 | 24 | 34 | 14 |
| Black, % | 32 | 34 | 39 | 37 | 27 |
| Hispanic, % | 32 | 32 | 36 | 29 | 59 |
| Women, % | 69 | 67 | 76 | 67 | 65 |
| Mean # of vascular risk factors (SD) | 1.0 (0.72) | 1.1 (0.75) | 1.2 (0.86) | 1.2 (0.76) | 1.3 (0.63) |
| Short Blessed Exam Total Mean (SD) | 1.3 (1.7) | 2.7 (2.7) | 2.2 (3.3) | 3.4 (2.6) | 3.8 (3.4) |
| Blessed Functional Activity Scale Mean (SD) | 0.47 (0.79) | 0.71 (1.0) | 0.65 (1.1) | 0.97 (1.3) | 1.2 (1.6) |
| # progressed to dementia | 38 (4.3%) | 21 (21%) | 0 (0%) | 26 (25%) | 20 (39%) |
| Of those progressed to dementia, sole cause assigned to probable AD | 23 (60%) | 16 (76%) | NA | 12 (46%) | 14 (70%) |
| Mean survival time to dementia in years (SE) | 6.3 (0.05) | 5.7 (0.12) | NA | 5.4 (0.16) | 4.9 (0.21) |
| Median survival time to dementia in years (SE) | 6.5 (0.10) | 6.1 (0.17) | NA | 5.8 (0.21) | 5.5 (0.56) |
SD=Standard Deviation. SE=Standard Error of the Mean. aMCI-=Amnestic MCI, dMCI=Dysexecutive MCI, MCI-MCDE=Multidomain MCI with executive dysfunction. MCI-MCDN= Multidomain MCI without executive dysfunction.
Figure 3. Survival curve.
Survival curve for development of dementia in patients with aMCI, dMCI, MCI-MCDE, MCI-MCDN, and patients without dementia or MCI.
Imaging
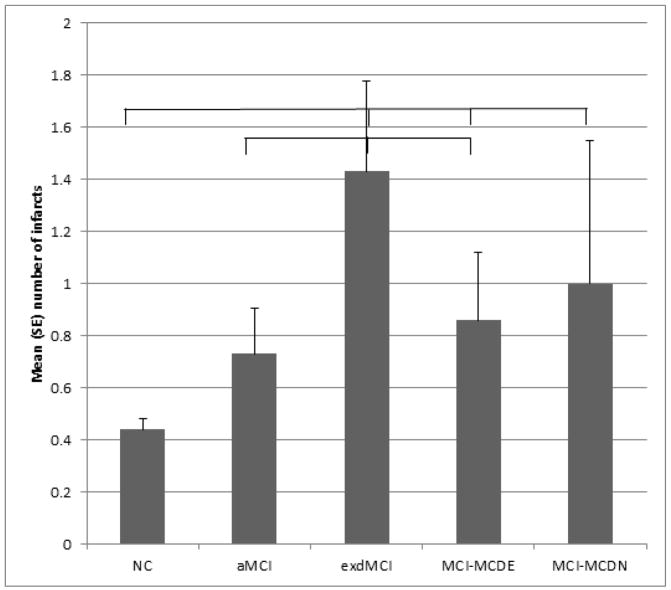
The mean amount of white matter intensity volume did not vary significantly by diagnostic group (F(6,703)=1.39, p=0.218). The mean numbers of infarcts varied significantly by diagnostic group (F(6,712)=4.83, p<0.001). See Figure 4 for significant (p<0.05) group differences revealed by post-hoc analyses. The proportion of cases with a stroke that affected the frontal grey or white matter was calculated for each diagnostic group: no dementia no MCI = 9%; aMCI = 12%; dMCI = 19%; MCI-MCDE = 12%; MCI-MCDN = 15%. When MCI patients progressed to dementia, 76% of aMCI, 70% of MCI-MCDN, and 46% of MCI-MCDE patients were given probable AD as the sole diagnosis (Table 1).
Figure 4. Number of infarcts.
Differences in mean (SE) number of infarcts as a function of diagnostic group. Lines show groups that are significantly different from each other (p<0.05)
Discussion
In our longitudinal data, several trends emerge. First, patients with aMCI appear to have more extension of cognitive deficits into non-amnestic cognitive domains, such as language, over 4.5 years than patients with dMCI. Second, as expected, patients with MCI affecting multiple domains generally have lowest scores across all cognitive domains, and may be demonstrating a floor effect on some of the measures, but they are more likely to progress to dementia than those with single domain MCI. These findings agree with the previously published finding that patients with aMCI have a greater risk of progressing to dementia than patients with dMCI, and that those with multi-domain MCI are at higher risk of progressing to dementia than those with single domain MCI [1].
Our findings on progression to dementia are consistent with our analysis of the neuropsychological data. DMCI tends to remain more isolated and less likely to progress to dementia than aMCI. Not only did none of the dMCI patients progress to dementia over 4.5 years, but a lower proportion of those with MCI-MCDE than those with MCI-MCDN patients progressed to dementia. This result is surprising given that MCI-MCDE patients actually have impairment in an additional domain, executive function, compared with MCI-MCDN patients. That no patients with dMCI progressed to dementia is likely related to the small sample size of this group. When the MCI-MCDE patients did progress to dementia, the proportion of probable AD as the sole diagnosis was lower than for aMCI or MCI-MCDN (Table 1). The most common other diagnoses besides probable AD were mixed dementia (AD plus stroke) or AD with other concomitant disease, and vascular dementia.
The imaging results demonstrate that patients with dMCI are more likely to have had a stroke than patients with aMCI. Preliminary evidence suggests that these strokes are more likely to be in the frontal grey and white matter in patients with dMCI. However, white matter hyperintensity (WMH) volume was not associated with dMCI compared to aMCI. Our findings on WMH replicate those of Luchsinger et al in the same cohort [31]. These results suggest that dMCI is associated with infarcts >3 mm, but not WMH, compared to aMCI. We do not have an explanation for this apparent paradox. One hypothesis is that WMH might be selectively associated with AD [13].
These findings suggest that the etiology of cognitive impairment in dMCI patients has a larger ischemic component than for aMCI. This hypothesis has face validity as memory is an early and necessary symptom of AD and so one would expect MCI patients who have underlying AD pathology to be more likely to have memory symptoms. Since AD has a progressive course the lower rates of extension of cognitive deficits and progression to dementia in dMCI patients also suggests that processes other than AD, such as vascular disease, are more commonly responsible for cognitive impairment in dMCI than in aMCI. This hypothesis is consistent with previous findings that vascular risk factors are associated with executive dysfunction in healthy elderly [11, 12] and that vascular dementia is more likely to be an executive-predominant dementia than AD [14]. In fact, one could criticize the findings of the current study, that dMCI is more associated with stroke and less likely to progress to involve other domains of cognition than aMCI, as obvious. However, to our knowledge, these findings have never been demonstrated longitudinally in aMCI and dMCI in an ethnically diverse community sample. Weaknesses of the present study include the relatively small sample size of the dMCI group, and lack of extensive executive function testing or autopsy data. The small sample size of some of the groups likely reduces the power of the analyses to detect differences between the groups. Future studies should evaluate whether patients with dMCI have other symptoms associated with frontal dysfunction including behavioral, emotional, and social cognitive symptoms and if they are more likely to progress to Frontotemporal Lobar Degeneration (FTLD) than patients with aMCI.[32]
These findings are clinically relevant. Our results suggest that the cognitive dysfunction of dMCI is more likely to remain isolated and less likely to be caused by AD than aMCI. Executive dysfunction in the context of multi-domain MCI does not appear to increase risk of progression to dementia. These findings are in an ethnically-diverse group of subjects and may differ in another population with, for example, a different prevalence of vascular illness [33, 34]. The proportion of aMCI patients that progressed to dementia in our sample is less than that found in ADNI (approximately 16% per year) [35]. The reasons for this are unclear, but it could reflect the difficulties in diagnosing MCI in a population with relatively low levels of education. One study of 31 older adults with dMCI demonstrated that 12 progressed, and 19 remained stable, over 2 years, a significantly higher rate of progression than in the present study [36]. However, in that study, decline was defined as an increase in the CDR sum of boxes, whereas in the current study we examined the more extreme change of conversion to dementia. Also, they excluded subjects with vascular disease at baseline which likely enriched their sample for patients with neurodegenerative illness.
In conclusion, we have shown that cognitive impairment in dMCI is more likely to remain isolated while aMCI is more likely to involve other cognitive areas and progress to dementia. DMCI appears to be less likely to be caused by AD than aMCI and is more associated with cerebrovascular disease. A recent set of consensus criteria for MCI has advocated that the focus on MCI shift from descriptive to assigning underlying etiologies [10]. We hope that this study is a step in that direction.
Acknowledgments
This work was supported by NIH/NIA grants NIA P01AG07232 (Mayeux), and NIA R01AG037212 (Mayeux), NIH/NINDS grant R00 NS060766 (Huey), and The Irving Institute of Columbia University. Also supported in part by Columbia University’s CTSA grant No.UL1RR024156 from NCATS-NCRR/NIH
Footnotes
Publisher's Disclaimer: This is a PDF file of an unedited manuscript that has been accepted for publication. As a service to our customers we are providing this early version of the manuscript. The manuscript will undergo copyediting, typesetting, and review of the resulting proof before it is published in its final citable form. Please note that during the production process errors may be discovered which could affect the content, and all legal disclaimers that apply to the journal pertain.
Contributor Information
Jennifer J. Manly, Email: jjm71@columbia.edu.
Ming-X Tang, Email: mxt1@columbia.edu.
Nicole Schupf, Email: ns24@columbia.edu.
Adam M. Brickman, Email: amb2139@columbia.edu.
Masood Manoochehri, Email: mm2626@columbia.edu.
Jesse Mez, Email: jbm2154@columbia.edu.
Charles DeCarli, Email: charles.decarli@ucdmc.ucdavis.edu.
Davangere P. Devanand, Email: dpd3@columbia.edu.
Richard Mayeux, Email: rpm2@columbia.edu.
References
- 1.Manly JJ, et al. Frequency and course of mild cognitive impairment in a multiethnic community. Ann Neurol. 2008;63(4):494–506. doi: 10.1002/ana.21326. [DOI] [PMC free article] [PubMed] [Google Scholar]
- 2.Petersen RC, et al. Mild cognitive impairment: ten years later. Arch Neurol. 2009;66(12):1447–55. doi: 10.1001/archneurol.2009.266. [DOI] [PMC free article] [PubMed] [Google Scholar]
- 3.Mitchell AJ, Shiri-Feshki M. Temporal trends in the long term risk of progression of mild cognitive impairment: a pooled analysis. J Neurol Neurosurg Psychiatry. 2008;79(12):1386–91. doi: 10.1136/jnnp.2007.142679. [DOI] [PubMed] [Google Scholar]
- 4.Fischer P, et al. Conversion from subtypes of mild cognitive impairment to Alzheimer dementia. Neurology. 2007;68(4):288–91. doi: 10.1212/01.wnl.0000252358.03285.9d. [DOI] [PubMed] [Google Scholar]
- 5.Palmer K, et al. Mild cognitive impairment in the general population: occurrence and progression to Alzheimer disease. Am J Geriatr Psychiatry. 2008;16(7):603–11. doi: 10.1097/JGP.0b013e3181753a64. [DOI] [PubMed] [Google Scholar]
- 6.Busse A, et al. Mild cognitive impairment: long-term course of four clinical subtypes. Neurology. 2006;67(12):2176–85. doi: 10.1212/01.wnl.0000249117.23318.e1. [DOI] [PubMed] [Google Scholar]
- 7.Bennett DA, et al. Natural history of mild cognitive impairment in older persons. Neurology. 2002;59(2):198–205. doi: 10.1212/wnl.59.2.198. [DOI] [PubMed] [Google Scholar]
- 8.Nordlund A, et al. Two-year outcome of MCI subtypes and aetiologies in the Goteborg MCI study. J Neurol Neurosurg Psychiatry. 2010;81(5):541–6. doi: 10.1136/jnnp.2008.171066. [DOI] [PubMed] [Google Scholar]
- 9.Petersen RC, et al. Current concepts in mild cognitive impairment. Arch Neurol. 2001;58(12):1985–92. doi: 10.1001/archneur.58.12.1985. [DOI] [PubMed] [Google Scholar]
- 10.Albert MS, et al. The diagnosis of mild cognitive impairment due to Alzheimer’s disease: recommendations from the National Institute on Aging-Alzheimer’s Association workgroups on diagnostic guidelines for Alzheimer’s disease. Alzheimers Dement. 2011;7(3):270–9. doi: 10.1016/j.jalz.2011.03.008. [DOI] [PMC free article] [PubMed] [Google Scholar]
- 11.Seshadri S, et al. Stroke risk profile, brain volume, and cognitive function: the Framingham Offspring Study. Neurology. 2004;63(9):1591–9. doi: 10.1212/01.wnl.0000142968.22691.70. [DOI] [PubMed] [Google Scholar]
- 12.Segura B, et al. Mental slowness and executive dysfunctions in patients with metabolic syndrome. Neurosci Lett. 2009;462(1):49–53. doi: 10.1016/j.neulet.2009.06.071. [DOI] [PubMed] [Google Scholar]
- 13.Brickman AM, Muraskin J, Zimmerman ME. Structural neuroimaging in Altheimer’s disease: do white matter hyperintensities matter? Dialogues Clin Neurosci. 2009;11(2):181–90. doi: 10.31887/DCNS.2009.11.2/ambrickman. [DOI] [PMC free article] [PubMed] [Google Scholar]
- 14.Looi JC, Sachdev PS. Differentiation of vascular dementia from AD on neuropsychological tests. Neurology. 1999;53(4):670–8. doi: 10.1212/wnl.53.4.670. [DOI] [PubMed] [Google Scholar]
- 15.Manly JJ, et al. Implementing diagnostic criteria and estimating frequency of mild cognitive impairment in an urban community. Arch Neurol. 2005;62(11):1739–46. doi: 10.1001/archneur.62.11.1739. [DOI] [PubMed] [Google Scholar]
- 16.Luchsinger JA, et al. Hyperinsulinemia and risk of Alzheimer disease. Neurology. 2004;63(7):1187–92. doi: 10.1212/01.wnl.0000140292.04932.87. [DOI] [PubMed] [Google Scholar]
- 17.Tang MX, et al. Incidence of AD in African-Americans, Caribbean Hispanics, and Caucasians in northern Manhattan. Neurology. 2001;56(1):49–56. doi: 10.1212/wnl.56.1.49. [DOI] [PubMed] [Google Scholar]
- 18.Budget, U.S.O.o. M.a. Standards for maintaining, collecting, and presenting federal data on race and ethnicity. Washington, D.C: United States Office of Management and Budget; 1997. Revisions to the Standards for the Classification of Federal Data on Race and Ethnicity (October 30, 1997) Vol. 11–6–2000. [Google Scholar]
- 19.Katzman R, et al. Validation of a short Orientation-Memory-Concentration Test of cognitive impairment. Am J Psychiatry. 1983;140(6):734–9. doi: 10.1176/ajp.140.6.734. [DOI] [PubMed] [Google Scholar]
- 20.Blessed G, Tomlinson BE, Roth M. The association between quantitative measures of dementia and of senile change in the cerebral grey matter of elderly subjects. Br J Psychiatry. 1968;114(512):797–811. doi: 10.1192/bjp.114.512.797. [DOI] [PubMed] [Google Scholar]
- 21.Petersen RC, et al. Mild cognitive impairment: clinical characterization and outcome. Arch Neurol. 1999;56(3):303–8. doi: 10.1001/archneur.56.3.303. [DOI] [PubMed] [Google Scholar]
- 22.Diagnostic and statistical manual of mental disorders DSM-II-TR. Washington, DC: American Psychiatric Association; 1987. [Google Scholar]
- 23.Zeger SL, Liang KY. Longitudinal data analysis for discrete and continuous outcomes. Biometrics. 1986;42(1):121–30. [PubMed] [Google Scholar]
- 24.Chen HY, Little R. A test of missing completely at random for generalised estimating equations with missing data. Biometrika. 1999;86(1):1–13. [Google Scholar]
- 25.DeCarli C, et al. Measures of brain morphology and infarction in the framingham heart study: establishing what is normal. Neurobiol Aging. 2005;26(4):491–510. doi: 10.1016/j.neurobiolaging.2004.05.004. [DOI] [PubMed] [Google Scholar]
- 26.Scarmeas N, et al. Mediterranean diet and magnetic resonance imaging-assessed cerebrovascular disease. Ann Neurol. 2011;69(2):257–68. doi: 10.1002/ana.22317. [DOI] [PMC free article] [PubMed] [Google Scholar]
- 27.Brickman AM, et al. Brain morphology in older African Americans, Caribbean Hispanics, and whites from northern Manhattan. Arch Neurol. 2008;65(8):1053–61. doi: 10.1001/archneur.65.8.1053. [DOI] [PMC free article] [PubMed] [Google Scholar]
- 28.DeCarli C, et al. Local histogram correction of MRI spatially dependent image pixel intensity nonuniformity. J Magn Reson Imaging. 1996;6(3):519–28. doi: 10.1002/jmri.1880060316. [DOI] [PubMed] [Google Scholar]
- 29.DeCarli C, et al. The effect of white matter hyperintensity volume on brain structure, cognitive performance, and cerebral metabolism of glucose in 51 healthy adults. Neurology. 1995;45(11):2077–84. doi: 10.1212/wnl.45.11.2077. [DOI] [PubMed] [Google Scholar]
- 30.DeCarli C, et al. Method for quantification of brain, ventricular, and subarachnoid CSF volumes from MR images. J Comput Assist Tomogr. 1992;16(2):274–84. doi: 10.1097/00004728-199203000-00018. [DOI] [PubMed] [Google Scholar]
- 31.Luchsinger JA, et al. Subclinical cerebrovascular disease in mild cognitive impairment. Neurology. 2009;73(6):450–6. doi: 10.1212/WNL.0b013e3181b1636a. [DOI] [PMC free article] [PubMed] [Google Scholar]
- 32.Godefroy O, et al. Dysexecutive syndrome: diagnostic criteria and validation study. Ann Neurol. 2010;68(6):855–64. doi: 10.1002/ana.22117. [DOI] [PubMed] [Google Scholar]
- 33.Fitzpatrick AL, et al. Incidence and prevalence of dementia in the Cardiovascular Health Study. J Am Geriatr Soc. 2004;52(2):195–204. doi: 10.1111/j.1532-5415.2004.52058.x. [DOI] [PubMed] [Google Scholar]
- 34.Froehlich TE, Bogardus ST, Jr, Inouye SK. Dementia and race: are there differences between African Americans and Caucasians? J Am Geriatr Soc. 2001;49(4):477–84. doi: 10.1046/j.1532-5415.2001.49096.x. [DOI] [PubMed] [Google Scholar]
- 35.Petersen RC, et al. Alzheimer’s Disease Neuroimaging Initiative (ADNI): clinical characterization. Neurology. 2010;74(3):201–9. doi: 10.1212/WNL.0b013e3181cb3e25. [DOI] [PMC free article] [PubMed] [Google Scholar]
- 36.Johnson JK, et al. Baseline predictors of clinical progression among patients with dysexecutive mild cognitive impairment. Dement Geriatr Cogn Disord. 2010;30(4):344–51. doi: 10.1159/000318836. [DOI] [PMC free article] [PubMed] [Google Scholar]


