

Abstract
Activity cliffs (ACs) are defined as pairs of structurally similar compounds sharing the same biological activity but having a large difference in potency. Therefore, ACs are often studied to rationalize structure-activity relationships (SARs) and aid in lead optimization. Hence, the AC concept plays an important role in compound development. For compound optimization, ligand efficiency (LE) represents another key concept. LE accounts for the relation between compound potency and mass. A major goal of lead optimization is to increase potency and also LE. Despite their high relevance for drug development, the AC and LE concepts have thus far not been considered in combination. It is currently unknown how compounds forming ACs might be related in terms of LE. To explore this question, ACs were systematically identified on the basis of high-confidence activity data and LE values for cliff partners were determined. Surprisingly, a significant increase in LE was generally detected for highly potent cliff partners compared to their lowly potent counterparts, regardless of the compound classes and their targets. Hence, ACs reveal chemical modifications that determine SARs and improve LE. These findings further increase the attractiveness of AC information for compound optimization and development.
KEY WORDS: activity cliffs, drug development, ligand efficiency, matched molecular pairs, structure-activity relationships
INTRODUCTION
The activity cliff (AC) concept plays a key role in structure-activity relationship (SAR) analysis (1–3). ACs are generally defined as pairs or groups of structurally similar or analogous active compounds having a large difference in potency (1–3). As such, ACs are prime indicators of SAR discontinuity (1,2) because small chemical changes lead to large biological effects. Therefore, SAR determinants can often be deduced from ACs (2,3). Although ACs have traditionally been considered on a case-by-case basis by focusing on one compound series at a time, they have recently been systematically investigated across compounds active against current pharmaceutical targets (2,3), thereby considerably increasing the knowledge base for SAR exploration and compound development (3).
Lead optimization generally aims to improve target-specific potency and other compound properties relevant for drug development (4). In order to increase potency, various R-groups are typically added to candidate compounds and their hydrophobic character is frequently increased (4). Thus, potency improvements often come at a price of increasing molecular mass and hydrophobicity, which in turn result in less favorable absorption, distribution, metabolism, and excretion characteristics. Therefore, potency is often not considered as an individual property but related to molecular mass, thus leading to the ligand efficiency (LE) assessment (5,6). The LE concept has its origins in attempts to account for compound potency on a per-atom basis (7). Accordingly, LE is usually calculated by dividing compound potency (e.g., pKi values) by the number of non-hydrogen atoms in a compound (5) or by its molecular weight (6). As such, LE is a simple and intuitive measure of compound optimization progress, despite some intrinsic limitations (8). Ideally, LE values should increase during compound optimization but not significantly decrease. In practice, LE values often remain more or less constant during successful optimization efforts (9–11).
Despite their intuitive nature and high relevance for compound optimization, the AC and LE concepts have thus far not been considered in combination. Rather, AC analysis has generally been potency-centric (2). Therefore, we have systematically analyzed ACs from an LE perspective and compared LE values for highly and lowly potent cliff partners across many different compound activity classes. The results of our analysis are presented herein.
MATERIALS AND METHODS
Datasets
Compounds against human targets were extracted from ChEMBL version 15 (12) by applying the following criteria. Only compounds with numerically exact Ki values reported for direct target interactions at the highest level of confidence (ChEMBL confidence score 9) were considered. If more than one Ki value for the same target was reported for a compound, it was discarded if these values differed by more than one order of magnitude. If the values fell within the same order of magnitude, their average was calculated as the final potency annotation. We obtained 610 different target sets comprising a total of 41,127 compounds. Individual target sets contained up to 2,307 compounds.
Molecular Representations
Molecular fingerprint- and graph-based compound representations (e.g., matched molecular pairs; see below) were calculated to identify ACs (2,3). As fingerprints, MACCS structural keys (13), a dictionary containing 166 different molecular fragments, and the extended connectivity fingerprint with bond diameter 4 (ECFP4) (14), a topological fingerprint capturing layered atom environments, were calculated using the molecular operating environment (MOE) (15). These two fingerprints of different design are currently most frequently used in AC analysis (2). The molecular weight (MW) and logP value, a measure of lipophilicity, of each compound was also calculated with MOE.
Matched Molecular Pairs
Matched molecular pairs (MMPs) are defined as pairs of compounds that differ only by a structural change at a single site (16), i.e., the exchange of a substructure, termed a chemical transformation (17). MMPs were systematically calculated for compounds in all target sets using an in-house implementation of the algorithm by Hussain and Rea (17) based on the OEChem toolkit (18). For AC assessment, transformation size-restricted MMPs were selected (19). The difference in size between the exchanged substructures was limited to at most 8 non-hydrogen atoms and the maximal size of an exchanged fragment was limited to 13 non-hydrogen atoms. In addition, the number of non-hydrogen atoms comprising the common parts (core structure) of two compounds had to be at least twice the size of each of two distinguishing substructures. These size restrictions generally limit transformations to chemically meaningful replacements (19). If several transformations met the size restrictions for a given compound pair, the smallest transformation was selected.
Activity Cliffs
For AC assessment, similarity and potency difference criteria must be specified. In order to limit the analysis to ACs of significant magnitude, a difference in potency (equilibrium constants) of at least two orders of magnitude was consistently applied (2,3). Alternative similarity criteria were considered. For MACCS and ECFP4 fingerprint representations, Tanimoto coefficient (20) values of at least 0.85 and 0.56, respectively, were required to qualify two compounds as cliff partners (3). ACs formed on the basis of MACCS and ECFP4 representations were designated fingerprint-cliffs. In addition, the formation of transformation size-restricted MMPs was applied as a substructure-based similarity criterion for AC formation (3). If compounds in a transformation size-restricted MMP displayed a potency difference of at least two orders of magnitude, they formed a so-called MMP-cliff (19). For each AC, the compound with high potency and compound with low potency forming the cliff were designated the “highly potent cliff partner” and the “lowly potent cliff partner,” respectively.
Ligand Efficiency
LE was calculated using the Binding Efficiency Index (BEI) (6) defined as follows:
 |
Because BEI values were only calculated and compared for structurally similar/analogous compounds, corrections for potential size dependence were not required (8).
Statistical Analysis
Statistical analysis of data distributions was carried out using the R package stats (21).
RESULTS AND DISCUSSION
AC Statistics
For each of our 610 target sets, ACs were systematically calculated using alternative molecular representations. From all 41,127 compounds, 22,109 and 17,312 MACCS- and ECFP4-based fingerprint-cliffs were obtained, respectively. In addition, 18,208 MMP-cliffs were identified. Thus, a very large pool of ACs was available for our analysis, originating from compounds active against the spectrum of current pharmaceutical targets. Table I lists the 30 targets yielding most ACs. The frequency of occurrence and potency range distribution of ACs has previously been determined (22). ACs spanning a potency difference of at least two orders of magnitude on the basis of equilibrium constants over all available potency ranges provide a statistically preferred and chemically reliable pool of ACs for further exploration (22). We adhere to this AC assessment herein.
Table I.
Target Sets with Largest Numbers of ACs
| Target name | No. ACs |
|---|---|
| Coagulation factor X | 3,972 |
| Melanocortin receptor 4 | 2,890 |
| Mu opioid receptor | 2,645 |
| Cannabinoid CB2 receptor | 2,380 |
| Adenosine A2a receptor | 2,290 |
| Adenosine A3 receptor | 2,096 |
| Thrombin | 1,810 |
| Kappa opioid receptor | 1,704 |
| Histamine H3 receptor | 1,643 |
| Purinergic receptor P2Y12 | 1,601 |
| Dopamine D2 receptor | 1,524 |
| Melanin-concentrating hormone receptor 1 | 1,500 |
| Bradykinin B1 receptor | 1,210 |
| Histamine H4 receptor | 1,126 |
| Serotonin 6 (5-HT6) receptor | 949 |
| Calcitonin gene-related peptide type 1 receptor | 918 |
| Corticotropin releasing factor receptor 1 | 888 |
| G protein-coupled receptor 44 | 853 |
| Muscarinic acetylcholine receptor M3 | 832 |
| Gonadotropin-releasing hormone receptor | 755 |
| Serotonin 1a (5-HT1a) receptor | 720 |
| Adenosine A2b receptor | 695 |
| Cannabinoid CB1 receptor | 666 |
| Vasopressin V1a receptor | 590 |
| Furin | 519 |
| Carbonic anhydrase I | 518 |
| Neuropeptide Y receptor type 5 | 513 |
| Dopamine transporter | 495 |
| Dopamine D3 receptor | 494 |
| Delta opioid receptor | 478 |
Targets yielding the largest number of ACs (fingerprint plus MMP-cliffs) are reported
LE Analysis
For each AC-forming compound, its LE value was calculated, and for each AC, the LE values of highly and lowly potent cliff partners were compared. Figure 1 reports the distribution of LE values for highly and lowly potent cliff partners identified on the basis of different molecular representations. In each case, LE values of highly potent cliff compounds were on average significantly larger than the values of lowly potent cliff partners. For different molecular representations, the profiles of the LE distributions were rather similar. Importantly, for 99.1, 96.9, and 97.4% of the MMP-, MACCS-, and ECFP4-based ACs, respectively, an increase in LE was detected for the highly potent compared to the lowly potent cliff compound; a surprising finding.
Fig. 1.
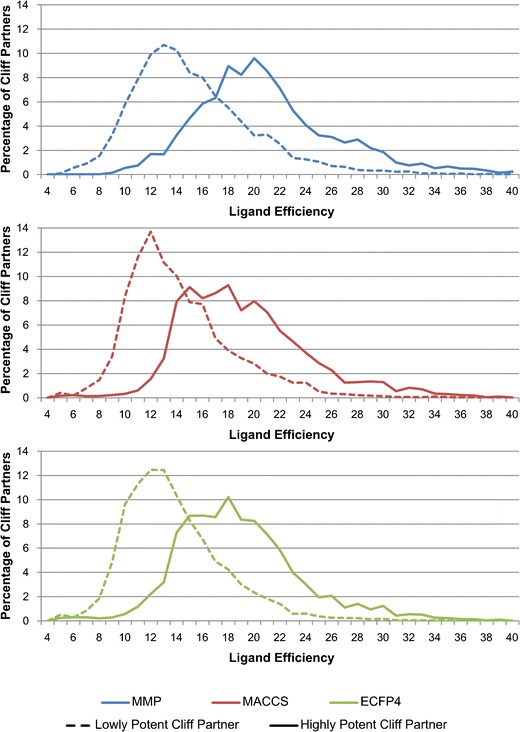
Distribution of LE values. For all ACs obtained on the basis of MMPs (blue), MACCS (red), and ECFP4 (green), the distribution of LE values for lowly potent (dashed lines) and highly potent cliff partners (solid lines) is reported
LE Differences
Figure 2 compares the distributions of LE differences between cliff-forming compounds. For fingerprint-based ACs, the distributions were extremely similar, with average LE difference values of 5.38 for both MACCS and ECFP4. However, for MMP-cliffs, the distribution was shifted towards larger LE differences, yielding an average value of 6.25. On the basis of a two sample unpaired t test (Table II), the difference between fingerprint- and MMP-based ACs was statistically highly significant. Thus, for the structurally more conservative MMP-based AC representations, larger differences in LE values between lowly and highly potent cliff partners were detected than for fingerprint-based AC representations that relied on the calculation of (whole-molecule) Tanimoto similarity. Hence, from an LE perspective, MMP-cliffs were preferred for AC representations.
Fig. 2.

LE difference distribution. The difference in LE between highly and lowly potent partners are compared for ACs obtained on the basis of MMPs (blue), MACCS (red), and ECFP4 (green). Negative values represent a decrease in LE as potency increases and positive values a corresponding increase in LE
Table II.
T-test for LE Difference Distributions
| LE diff. distribution | T statistic | p value |
|---|---|---|
| MMP vs. MACCS | 20.58 | 1.54E-93 |
| MMP vs. ECFP4 | 19.59 | 5.93E-85 |
| MACCS vs. ECFP4 | −0.012 | 0.99 |
In order to compare LE difference distributions for AC sets according to Fig. 2, a two-sample unpaired t test was performed. Values of the T statistic and p values are reported
LE vs. MW, Potency, and logP Differences
We also analyzed the relationship between LE and MW differences of AC partners. For 54.9, 58.2, and 57.3% of all MMP-, MACCS-, and ECFP4-based ACs, respectively, the highly potent cliff partners had larger MW than the lowly potent compounds. However, for 98.4, 95.4, and 95.5% of these ACs, the highly potent cliff partners also had larger LE values than their lowly potent counterparts. Figure 3 shows the comparison of LE and MW differences for MMP-cliffs and Fig. 4 the comparison of LE and potency differences. No statistically significant correlation between LE and MW or potency differences was detected. Furthermore, the relationship between LE and logP differences was also explored. LogP values of highly and lowly potent cliff partners were calculated as a measure of lipophilicity. For MMP-, MACCS-, and ECFP4-based ACs, the average change in logP values between compounds forming an AC was 0.16, 0.19, and 0.20, respectively. Figure 5 shows a comparison of LE and logP differences for MMP-cliffs. No significant correlation between LE and logP differences was observed. Taken together, these findings indicated that the observed LE increases for ACs were largely independent of MW or lipophilicity variations between cliff partners. Hence, large potency differences between cliff partners mostly determined LE increases.
Fig. 3.

LE vs. molecular weight difference. Each data point represents an MMP-cliff. Its position in the graph is determined by the LE and MW difference between highly and lowly potent cliff partners
Fig. 4.

LE vs. potency difference. Each data point represents an MMP-cliff. Its position in the graph is determined by the LE and potency difference between highly and lowly potent cliff partners
Fig. 5.

LE vs. logP difference. Each data point represents an MMP-cliff. Its position in the graph is determined by the LE and logP difference between highly potent and lowly potent cliff partners
Exemplary ACs
In Fig. 6, four MMP-cliffs are shown in which the highly potent cliff partner had larger MW and LE values than the lowly potent compound. These MMP-cliffs involve compounds of different size and chemical complexity (as well as different activity). In the first two examples (from the top), the MW increase was small and the LE increase was large, as often observed for different ACs. In the two remaining examples, MW increases are nearly maximal for MMP-cliffs (given the transformation size restrictions). In these extreme cases, MW increases are large and LE increases are small. In the majority of cases, larger LE increases were observed, as reflected by the LE value and difference distributions reported herein.
Fig. 6.

Exemplary ACs. Four MMP-cliffs are shown. In each pair, the left compound represents the lowly potent and the right compound the highly potent cliff partner, (arrows point from the lowly to the highly potent compound). Substructures constituting the MMP transformation are highlighted in red. For compound pairs, ChEMBL IDs (below the compounds) and targets (above the arrows) are provided. In addition, potency (pKi), MW, lipophilicity (logP), and LE differences are reported
CONCLUSIONS
The AC and LE concepts are focal points of SAR analysis and compound development. ACs are explored to identify SAR determinants and design analogs of active compounds, and increasing LE is utilized as a guiding principle during lead optimization. However, despite these conceptual relationships, ACs have, thus far, not been analyzed from an LE perspective. To these ends, we have carried out a large-scale analysis of ACs and calculated LE values for cliff-forming compounds. From a total of more than 41,000 unique compounds belonging to 610 different target sets, ACs were systematically extracted on the basis of high-confidence activity data and alternative molecular representations. The resulting AC populations were subjected to LE analysis. For each AC, LE values of the highly and lowly potent cliff partners were compared. On the basis of this analysis, very strong trends were observed. Regardless of chosen molecular representations and target activities, in more than 96% of all ACs, highly potent cliff partners had consistently higher LE values than their lowly potent counterparts. Thus, the formation of ACs was accompanied by a systematic increase in LE in the direction of increasing compound potency. Increases in LE were not accompanied by general increases in logP as a measure of lipophilicity. LE differences were larger for MMP- than for fingerprint-based ACs, and LE increases in ACs were independent of MW variations between cliff-forming compounds. The systematic differences between LE values of highly and lowly potent AC compounds revealed by our analysis further increase the value of AC information for compound development. ACs not only uncover SAR determinants but critical chemical changes encoded by ACs also lead to LE improvements. Especially for MMP-cliffs, this dual role renders the underlying chemical transformations highly attractive for compound design.
Acknowledgments
The authors thank Dilyana Dimova for help with compound datasets.
References
- 1.Maggiora GM. On outliers and activity cliffs–why QSAR often disappoints. J Chem Inf Model. 2006;46(4):1535. doi: 10.1021/ci060117s. [DOI] [PubMed] [Google Scholar]
- 2.Stumpfe D, Bajorath J. Exploring activity cliffs in medicinal chemistry. J Med Chem. 2012;55(7):2932–2942. doi: 10.1021/jm201706b. [DOI] [PubMed] [Google Scholar]
- 3.Stumpfe D, Hu Y, Dimova D, Bajorath J. Recent progress in understanding activity cliffs and their utility in medicinal chemistry. J Med Chem. 2013 doi: 10.1021/jm401120g. [DOI] [PubMed] [Google Scholar]
- 4.Wermuth CG. The practice of medicinal chemistry. 3. London: Academic; 2008. [Google Scholar]
- 5.Hopkins AL, Groom CR, Alex A. Ligand efficiency: a useful metric for lead selection. Drug Discov Today. 2004;9(10):430–431. doi: 10.1016/S1359-6446(04)03069-7. [DOI] [PubMed] [Google Scholar]
- 6.Abad-Zapatero C, Metz JT. Ligand efficiency indices as guideposts for drug discovery. Drug Discov Today. 2005;10(7):464–469. doi: 10.1016/S1359-6446(05)03386-6. [DOI] [PubMed] [Google Scholar]
- 7.Kuntz ID, Chen K, Sharp KA, Kollman PA. The maximal affinity of ligands. Proc Natl Acad Sci USA. 1999;96(18):9997–10002. doi: 10.1073/pnas.96.18.9997. [DOI] [PMC free article] [PubMed] [Google Scholar]
- 8.Reynolds CH, Bembenek SD, Tounge BA. The role of molecular size in ligand efficiency. Bioorg Med Chem Lett. 2007;17(15):4258–4261. doi: 10.1016/j.bmcl.2007.05.038. [DOI] [PubMed] [Google Scholar]
- 9.Hajduk PJ. Fragment-based drug design: how big is too big? J Med Chem. 2006;49(24):6972–6976. doi: 10.1021/jm060511h. [DOI] [PubMed] [Google Scholar]
- 10.Perola E. An analysis of the binding efficiencies of drugs and their leads in successful drug discovery programs. J Med Chem. 2010;53(7):2986–2997. doi: 10.1021/jm100118x. [DOI] [PubMed] [Google Scholar]
- 11.Tanaka D, Tsuda Y, Shiyama T, Nishimura T, Chiyo N, Tominaga Y, et al. A practical use of ligand efficiency indices out of the fragment-based approach: ligand efficiency-guided lead identification of soluble epoxide hydrolase inhibitors. J Med Chem. 2011;54(3):851–857. doi: 10.1021/jm101273e. [DOI] [PubMed] [Google Scholar]
- 12.Gaulton A, Bellis LJ, Bento AP, Chambers J, Davies M, Hersey A, et al. ChEMBL: a large-scale bioactivity database for drug discovery. Nucleic Acids Res. 2012;40(D1):D1100–D1107. doi: 10.1093/nar/gkr777. [DOI] [PMC free article] [PubMed] [Google Scholar]
- 13.MACCS structural keys; Accelrys, Inc., 5005 Wateridge Vista Drive, San Diego, CA 92121, USA
- 14.Rogers D, Hahn M. Extended-connectivity fingerprints. J Chem Inf Model. 2010;50(5):742–754. doi: 10.1021/ci100050t. [DOI] [PubMed] [Google Scholar]
- 15.Molecular operating environment (MOE), 2011.10; Chemical Computing Group Inc., 1010 Sherbooke St. West, Suite #910, Montreal, QC, Canada, H3A 2R7, 2011
- 16.Kenny PW, Sadowski J. Structure modification in chemical databases. In: Oprea TI, editor. Chemoinformatics in drug discovery. Weinheim: Wiley-VCH; 2005. pp. 271–285. [Google Scholar]
- 17.Hussain J, Rea C. Computationally efficient algorithm to identify matched molecular pairs (MMPs) in large data sets. J Chem Inf Model. 2010;50(3):339–348. doi: 10.1021/ci900450m. [DOI] [PubMed] [Google Scholar]
- 18.OEChemTK, v2012.Jun.1; OpenEye Scientific Software, 9 Bisbee Court, Suite D, Santa Fe, NM 87508, USA
- 19.Hu X, Hu Y, Vogt M, Stumpfe D, Bajorath J. MMP-cliffs: systematic identification of activity cliffs on the basis of matched molecular pairs. J Chem Inf Model. 2012;52(5):1138–1145. doi: 10.1021/ci3001138. [DOI] [PubMed] [Google Scholar]
- 20.Willet P, Barnard JM, Downs GM. Chemical similarity searching. J Chem Inf Comput Sci. 1998;38(6):983–996. doi: 10.1021/ci9800211. [DOI] [Google Scholar]
- 21.R: A language and environment for statistical computing; R Core Team; Foundation for Statistical Computing: Vienna, Austria, 2013
- 22.Stumpfe D, Bajorath J. Frequency of occurrence and potency range distribution of activity cliffs in bioactive compounds. J Chem Inf Model. 2012;52(9):2348–2353. doi: 10.1021/ci300288f. [DOI] [PubMed] [Google Scholar]