Abstract
We present two modifications of the Flux Balance Analysis (FBA) metabolic modeling framework which relax implicit assumptions of the biomass reaction. Our flexible Flux Balance Analysis (flexFBA) objective removes the fixed proportion between reactants, and can therefore produce a subset of biomass reactants. Our time-linked Flux Balance Analysis (tFBA) simulation removes the fixed proportion between reactants and byproducts, and can therefore describe transitions between metabolic steady states. Used together, flexFBA and tFBA model a time scale shorter than the regulatory and growth steady state encoded by the biomass reaction. This combined short-time FBA method is intended for integrated modeling applications to enable detailed and dynamic depictions of microbial physiology such as whole-cell modeling. For example, when modeling Escherichia coli, it avoids artifacts caused by low-copy-number enzymes in single-cell models with kinetic bounds. Even outside integrated modeling contexts, the detailed predictions of flexFBA and tFBA complement existing FBA techniques. We show detailed metabolite production of in silico knockouts used to identify when correct essentiality predictions are made for the wrong reason.
Keywords: Metabolism, Integrated Modeling
1. Introduction
Quantitative metabolic models are important tools for understanding and engineering the behavior of microorganisms. Flux Balance Analysis (FBA) is a powerful technique to simulate large metabolic networks for which kinetic parameters are unavailable. FBA simulations capture microorganism growth, nutritional resource consumption, and waste-product secretion rates [1, 2]. In addition FBA can generate knockout essentiality predictions which can be treated as hypotheses to explore an organism's metabolic capability [3, 4].
Classical implementations of FBA quantify microbial growth using a rigid biomass reaction which represents all the processes of cell replication as a single proportion of the reactants required and byproducts returned. It is used to quantify microbial growth even when another objective is used to refine flux predictions or evaluate perturbations [5, 6, 7].
The biomass reaction can produce only balanced growth or complete inactivity as predictions. For many applications the assumptions underlying this all-or-nothing behavior have been valid and the results have been useful. However, current in silico biology incorporates FBA in integrated models which combine mathematical models of different types to interact over a simulation [8, 9]. For these applications — most notably whole-cell models [10] — the rigid biomass reaction is a limitation.
To enable whole-cell modeling, we require a more nuanced alternative to the biomass reaction so that FBA can produce metabolites in non-wild-type and non-steady-state proportions.
In this work, we relax two implicit assumptions of the biomass reaction to construct new FBA methods. The first assumption is of balanced population average growth, encoded by the biomass reaction's fixed proportion of reactants. The second assumption is of steady state growth, encoded by the biomass reaction's fixed proportion of byproducts to reactants. Relaxing the reactant and byproduct assumptions results in the flexible FBA (flexFBA) and time-linked FBA (tFBA) approaches, respectively.
Together, the balanced and steady-state growth assumptions inherent to biomass reaction in FBA make the method applicable to a timescale longer than regulatory and cell process interactions. By combining the flexFBA and tFBA methods which relax these assumptions, we obtain a short-time FBA appropriate to use in whole-cell models. This short-time scale is consistent with whole-cell models which evaluate the metabolic model on timescales shorter than the regulatory and process interactions they explicitly represent.
1.1. Biomass Reaction and Assumptions
The biomass reaction is ubiquitous in microbial FBA because it lends great predictive power to the under-constrained metabolic network. It has a succinct mathematical form and is composed of straightforward parameter values. In addition to quantifying growth, the biomass reaction flux is often used as an optimization objective and in this case may be called the `biomass objective' [11]. Much literature evaluates the ability of various FBA objectives to mimic observed growth, gene essentiality, or flux states [6, 12, 13, 14, 15], often in comparison to `biomass objective' performance. In contrast, here we discuss simulation regimes in which the biomass reaction does not adequately model the range of metabolic network function, and is no longer relevant as a quantification of growth.
By constraining together all process reactant requirements and byproduct returns the biomass reaction combines the two subtly different assumptions that deal with the (1) reactant-to-reactant and (2) byproduct-to-reactant groups.
Reactant-to-reactant fixed proportion in the biomass reaction assumes population average balanced growth: homogeneity between cells and within cells over time. This assumption is contained in the biomass reaction's negative coefficients. As a consequence, the biomass reaction scales the fractional fulfillment of all process reactants to whichever one is most limited. Homogeneity between cells arises from the biomass reaction because its coefficients are bulk cell composition values. For single cells and short timescales this homogeneity conflicts with biological reality. Bulk phenotypes are given by an average and neglect variance in the underlying population [16, 17]. Strict temporal homogeneity of metabolite production ratios is unreasonable because the transcriptional and translational regulatory mechanisms which could enforce it operate on timescales longer than the typical FBA time step (1 sec to a few minutes [18, 19]). Furthermore, regulatory interactions may not exist between all metabolites included in the biomass reaction to enforce their proportional production. Experimental observations reveal that even essential metabolites can be produced in non-wild-type proportions [20, 21, 22, 23]. Additionally, all metabolites included in the biomass reaction are essential for model growth. If the biomass reaction includes process reactants which are non-essential for cell replication, then false-essential predictions will result [24]. Previously, the inflexible ratio and essentiality of the biomass reaction have been addressed via alternate biomass reaction definitions, [24, 25] or reactions allowing similar metabolites to substitute for one another [26]; though these approaches are not practical for the entire scale or all pathways of metabolism.
Byproduct-to-reactant fixed proportion in the biomass reaction assumes steady state metabolic function. This assumption is contained in biomass reaction's positive coefficients. The principle example is the return of spent energy carrier ADP set proportional to the amount of ATP produced within a time step. Proportional byproducts to reactants means the ADP return is immediately matched to the capacity of metabolism to recharge it to ATP, rather than being consistent with the previous time step's metabolic conditions. Relating the reactant and byproduct quantities is reasonable, but a long-time assumption is implied within a single evaluation of the FBA optimization. Perturbations or changes in available media resources therefore result in immediate transition to a new steady state in the single time step at which they are applied. This type of transition is unrealistic for short time step evaluations or if the energy carrier supply or turnover is limited.
2. Methods
Mathematically the biomass reaction consists of coefficients mi of metabolites Mi appended as a single reaction column to the stoichiometric matrix S as in the equation,
 |
(1) |
where values mi < 0 represent consumption of process reactants, and mi > 0 represent byproduct return. A majority of the n total mi values are zero because the associated metabolites do not participate in cell processes beyond metabolism. Coefficient magnitudes for anabolic products are given by relative quantities found in bulk biomass [11]; Coefficient magnitudes in the case of catabolic energy carriers are given by requirements for macromolecule synthesis or calculated from bulk yields [11]. Units of mi are usually chosen so that the flux through the biomass reaction, the last element of flux vector v denoted vbio, can be directly interpreted as a microbial growth rate [1]. Metabolite accumulation is set to zero [1], applying the steady state assumption to metabolic network intermediates on the timescale of evaluation Δt, typically 1 s or longer. Using the biomass reaction flux as the maximization objective, the optimization problem is:
| (2) |
where S′ = [S | m] and v′ is vbio appended to the end of v as in Equation 1.
Because the coefficients mi are quantities required for some basis amount of cell mass, we find it convenient to think of the biomass reaction flux vbio as the fractional fulfillment of that requirement per time. The classical FBA biomass reaction therefore requires the fractional fulfillment of all the metabolite requirements to be the same.
2.1. Designing a Biomass Reaction Alternative
While we sought to relax the biomass reaction's assumptions, we wanted to simultaneously preserve its behavior in the wild-type and long-time limits. We developed flexFBA to produce all possible process reactants without inhibition from distant/unrelated blocked pathways while maintaining the population average cell composition for wild type networks. We developed tFBA to allow observation of transient behavior and integration with other biological process models while reproducing steady state growth. An additional design constraint was the need for integrated modeling methods to be computationally efficient and function without human supervision.
Neither flexFBA nor tFBA rely on or interfere with each other, so they can be implemented separately or together. We therefore treat them individually in initial methods explanation and evaluation. However, because flexFBA and tFBA relax separate long-time assumptions of the biomass reaction, only by implementing them together do we achieve short-time FBA suitable for use in whole-cell models.
2.2. Reactant Flexibility: flexFBA
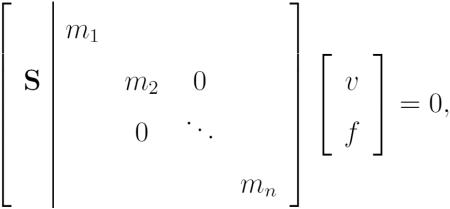
As long as the process reactants participate in the same reaction they must be provided by the network at rates related by a nonzero constant multiplier. To remove this constraint and produce them independently, we append their coefficients in separate reactions to the stoichiometric matrix:
 |
(3) |
where the fluxes corresponding to each of these reactions fi appended to v, still intuitively represent the fractional fulfillments of the requirement for metabolites by processes, but they can now vary from one another. We will call the combined matrix of Equation and the combined vector . The blocks appended to S are square diagonal in the general forms of Equations 3 and 5, the many all-zero columns are neglected in practical use.
The objective criteria applied must incentivize process reactant metabolite production — large values of fi — and simultaneously encourage proportional production — similar values of fi. In the wild type case, such an objective will result in process reactant exchange to and from the metabolic network identical to the biomass reaction flux maximization case in Equation (2). We achieve this mathematically using the objective,
| (4) |
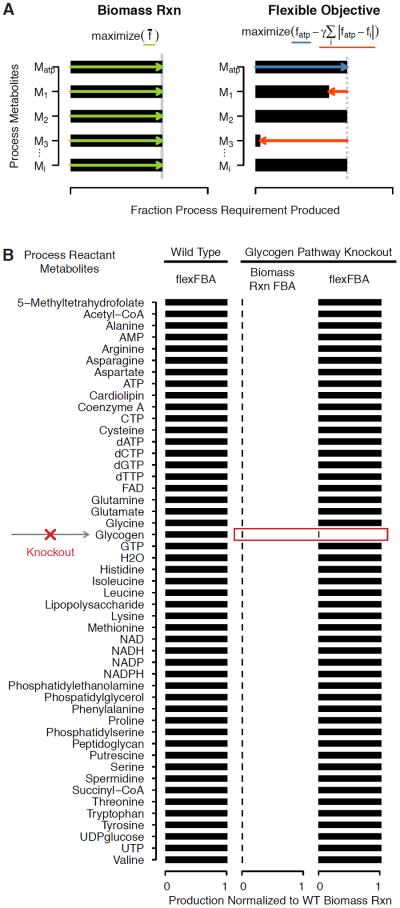
where fatp is the fractional fulfillment of energy carrier ATP. It maximizes the fractional fulfillment of ATP while penalizing any metabolite produced less than proportionally to ATP. The weight γ applied to penalty terms is a constant, which we explain how to choose later. Figure 1a compares biomass reaction flux maximization to the flexible form.
Figure 1.
Flexible FBA objective and Time Step Linked Simulation diagrams. (a) Diagram of biomass reaction flux maximization compared to application of flexible FBA to a small example system with key metabolite Matp corresponding to ATP and other biomass metabolites generically denoted Mi. The biomass reaction flux maximization objective optimizes for the production of all metabolites necessarily in exact proportion (green). The flexible FBA objective increases ATP production (blue) with a penalty for any other process reactant which is produced less than proportionally (red). (b) FlexFBA objective demonstration showing biomass metabolite production for the wild type metabolic network, and for a glycogen pathway knockout compared to biomass reaction flux maximization objective for that knockout.
The ℓ1 norm penalty encourages sparsity in its arguments; incentivizing that most fi match fatp rather than drawing all fi towards those that are constrained to be low. Similar motivations for ℓ1 norm use are found in robust and regularized regression [27, 28]. In contrast, the ℓ2 norm does not penalize small errors, and draws the solution towards outliers. We also found the ℓ2 norm is less numerically stable, failing to give reliable results for the metabolic system.
ATP production fatp is used as a representative of metabolic function, based on its biological importance and large process requirement mi. Including ATP explicitly in the objective is also consistent with previous FBA implementations which include ATP rate or yield in the optimization criteria or maintenance energy flux constraints [6]. Alternatives to this choice include functions of fi values such as the mean, but these are prone to trade-offs between metabolites, especially due to the eight orders of magnitude spanned by the values of mi.
We additionally introduce the constraint that fatp ≥ fi, resulting in the simplification to difference penalty terms. However, this constraint is optional and ℓ1 norm penalties could be used in subsequent equations instead. Because the ATP coefficient mATP is based on bulk yield measurements it accounts for some of the thermodynamic inefficiencies of metabolism, which we have chosen to maintain strictly with the fatp ≥ fi constraint. We include an optional full biomass reaction flux with weight β in the optimization criteria, so the full problem is,
| (5) |
The biomass group term gbio, if it is included with su ciently large β, assures that no metabolite is produced less than it would be using biomass reaction FBA. Including the biomass group alters the exFBA simulation only when a pathway is partially restricted upstream of a branch to multiple process reactant metabolites, as we discuss subsequently. The problem in Equation 5 can be forced to the biomass reaction solution by further setting 0 ≤ gbio = fi.
Basic flexFBA simulation results are shown in Figure 1b with identical metabolite production to biomass reaction FBA for the wild-type network. When glycogen synthesis capacity is removed by a simulated gene knockout, the biomass reaction predicts no metabolite production, while flexFBA predicts full wild type level production of all metabolites except glycogen.
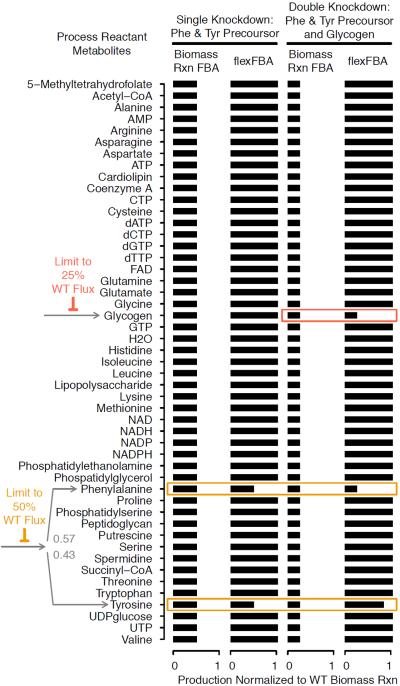
Simulations in Figure 2 exemplify the contribution of the full biomass group gbio term. Pathway restriction makes the metabolic precursor of tyrosine and phenylalanine a limited resource. E. coli biomass contains slightly greater amounts of phenylalanine than tyrosine (mtyr < mphe), with 57% of the flux to the branch point heading to phenylalanine. The process requirement for tyrosine being smaller means each increment of fractional fulfillment is less costly in terms of the limited precursor so the flexible terms (fatp with penalty Equation (4) alone would produce ftyr > fphe. The biomass group incentivizes proportional production to the extent that its flux is permitted: ftyr = fphe in the single knockdown (left two columns). This contribution is limited by any other restricted process metabolites, just as the biomass reaction would have been. We see the preference of flexFBA for the smaller requirement downstream of a restricted branch when the biomass group is additionally constrained — in Figure 2 by a glycogen pathway restriction with the double knockdown (right two columns, Figure 2).
Figure 2.
Branched Pathway Restriction. Flex FBA objective biomass metabolite production compared to biomass reaction flux maximization for a 50% knockdown in aromatic amino acid biosynthesis immediately upstream of the branch to Phenylalanine (Phe) and Tyrosine (Tyr), and with additional 75% knockdown to the glycogen synthesis pathway.
The addition of βgbio the flexible objective is only one of many ways to increase fi similarity among subsets of the process metabolites. Mathematically these terms could positively weight group production as with the biomass group term. Taking as an example the reactants of DNA synthesis, this would entail adding the βdNTPgdNTP to the maximization criteria and the constraint gdNTP ≤ fj for j = {dATP, dTTP, dGTP, dCTP} to the problem of Equation 5. Similarly, deviations within the group could be penalized using a form like the flexible objective itself, or a strict limit imposed on members fj ≤ mink fk, for j, k = {dATP, dTTP, dGTP, dCTP}. These additional terms could apply the assumption with varying strictness that molecular interactions maintain proportion between these metabolites on the timescale of FBA evaluation. However, assigning groups and weighting their terms increases the parameterization and potentially complicates the optimization problem. We consider current experimental evidence insufficient to guide or justify including such groups generally.
2.3. Time-Linked Byproducts: tFBA
Biomass reaction FBA can represent only the steady states of growth and not the transients between those steady states. This limitation is because process byproducts are returned from the reactants provided to processes within the same optimization time step. In tFBA the byproducts from time step t are available to the metabolic network at time step t + Δt With this modification we remove the long term steady state assumption from the biomass reaction.
Additional motivation for tFBA is that to construct integrated models it is advantageous to separate process reactant requirements and byproduct return. The biomass reaction can be thought of as an integrated model lumping all cell processes together. Because the biomass reaction is expressed as a single linear equation, it can be included in the linear system for optimization. However, it is not possible to represent processes of differential equation form, and especially stochastic processes, within the framework. Once it is required to evaluate FBA optimization and process models separately, the simulation must include methods to assure a metabolic solution exists and the overall simulation conserves mass — to keep processes and metabolism consistent. A former solution to maintaining process-metabolism consistency while preserving byproduct-to-reactant ratio within an FBA optimization required multiple evaluations of each for every simulated time step. We applied this solution to FBA integrated modeling in Birch et al. 2012 [8], however it is computationally inefficient, prone to time step dependent artifacts, and would be very problematic for stochastic models. The preferable alternative is tFBA: process-metabolism consistency can be enforced with straightforward metabolite quantities by separating process reactant consumption and byproduct return to occur between time steps.
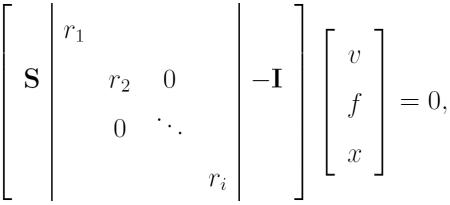
The biomass reaction summarizes many molecular steps which may share reactants and byproducts, so mi summarizes a reactant and byproduct stoichiometric coefficient ri and pi respectively: mi = pi + ri, with ri < 0 and pi > 0. In tFBA we replace mi with the reactant coefficient ri in the reactions appended to the S matrix,
 |
(6) |
where separate exchange reactions xi for the process byproducts have been added, and the matrix and flux vector are denotedŜ and v̂. The bounds for byproduct exchanges xl ≤ x ≤ 0 set only for uptake, and based on the available byproduct metabolite returned by the processes at the prior time step. In the case that a simple proportionality is still used to represent processes, at steady state in the wild type network these exchange reactions will have flux bounds and values of xi = xl,i – pif where f is the fractional fulfillment of all metabolites at this steady state. For during transient metabolic states the bounds xl,i will depend on ci,j, and fj,(t–Δt) the fractional fulfillment of related reactant Mj from the previous time step. Note that we maintain the FBA steady state assumption with respect to metabolic intermediates, which addresses an intermediate timescale between the fluctuations in metabolite concentrations to which enzyme-small molecule interactions respond quickly, and the longer regulatory responses. The full optimization problem statement for tFBA is:
| (7) |
where in this case the flexFBA is also being used. To implement tFBA but retain fixed proportion of reactants the last constraint of Equation 7 becomes 0 ≤ gbio = fi.
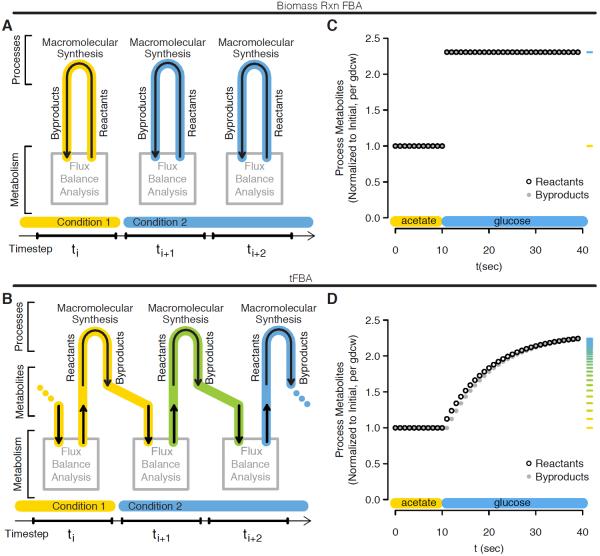
To present the impact of the tFBA method on simulations, we compare it to the previous methods for generating FBA time courses. Such methods consist of updating media concentrations based on the resources consumed during discrete time steps, with the most thorough accounting called dynamic FBA (dFBA) from Mahadevan et. al. 2002 [2]. Such simulations capture organism growth rate shifts in the time step after one of the resources is exhausted. However, at each time step growth is steady state with respect to the biomass reaction, so the resulting time course is a sequence of growth steady states. Figure 3a and b illustrate the reactant-byproduct relationship for a time course of biomass reaction FBA steady states, and tFBA, respectively. Upon a change in conditions, biomass reaction FBA byproduct return is already informed by the new conditions — which is why the arrow from reactants to byproducts in Figure 3a appears reversed with respect to time — and immediately achieves steady state. In comparison, tFBA byproduct return is a function of reactant consumption at the previous time step and condition. As a result, it transitions over some number of evaluations to the new steady state. At steady-state growth, time steps are identical so the same result is obtained at the long time limit.
Figure 3.
Biomass reaction FBA and tFBA time step relationship schematics and example media transition simulations. (a) Biomass reaction FBA diagram of relationship between metabolism and biomass process within and between time steps, with influence from simulation conditions represented as colored highlight. (b) and corresponding tFBA diagram. (c) Biomass reaction FBA simulation of acetate to glucose media transition at t = 10 sec showing normalized production of biomass reactants (black open) and return of biomass byproducts (closed grey). Marginal ticks for process reactant production values are colored according to a scale of yellow to blue with the end points set as steady states of acetate and glucose growth respectively. (d) and corresponding tFBA simulation of acetate to glucose media transition.
Figures 3c and d show process reactants and byproducts across an example transition from acetate to glucose media conditions for biomass reaction FBA and tFBA simulations. Transition time is not the only distinction, as tFBA also accounts for the difference in resources needed to maintain the states. In the E. coli network purine energy carriers ATP and ADP are the most important example. Using biomass reaction FBA, one of the modeling assumptions is that additional ADP are assumed to exist as soon as they can be phosphorylated in the glucose media condition, whereas tFBA simulation includes synthesis of these additional purine molecules via the metabolic network. The higher glucose growth rate requires twice the number ATP plus ADP to sustain [29], and it is certainly preferable to account for the resources used in their synthesis. Because Figure 3 simulations employ the wild type network and necessary media resources are available to produce balanced growth, either flexFBA or the biomass reaction objective will produce the results shown.
We note here that the quantities of reactants and byproducts exchanged between metabolism and the processes will not be representative of physiological metabolite concentrations. These quantities are an accounting practicality of representing discrete metabolic steps and cell function beyond linear system representation. However, the variables at this metabolism-process interface provide an opportunity for further methods development in FBA and whole-cell modeling fields.
2.4. Implementation
The genome scale metabolic model used for all main text figures is a slight expansion on iMC1010 [30]. Text files used for the reaction network and other modeling information are included with the code associated with this publication. Kinetic bounds and reaction perturbations are included in source code. Simulations were implemented in Python, with linear programming completed using CVXOPT [31] and GLPK or MOSEK. Source code for simulation and figure generation is available at simtk.org/home/flexfbatfba.
Simulations of in silico knockouts entail setting the associated reaction flux constraints vl = vu = 0. For tFBA simulations, use of process byproduct protons by metabolism was required. Fluxes are accounted in our simulations on a per cell rather than on a per gram dry cell weight basis, and are displayed as such unless otherwise noted. If β is nonzero we hold its value large, β ≫ 1.
The weighting of penalty terms must be 0 < γ < 1 for the production of any biomass metabolites other than ATP, with some tighter lower and upper bounds depending on the metabolic network and biomass metabolite count (theoretically γ ≥ 1 is feasible but practically interferes with solver). For all main text simulations in this work a value of 0.1 was used, chosen based on the total count of process reactants terms to avoid solution convergence to the biomass reaction limit. An analysis of metabolite production sensitivity to γ (Supplementary Figure S1) shows that the value can be chosen which produce the desired qualitative flexFBA solution, robust to various conditions and with multiple perturbations. Figure S1 includes simulations over a physiologically reasonable range of growth conditions, and with a range of metabolites constrained to low production.
3. Results
3.1. Knockouts
Using combined flexFBA and tFBA to achieve a short-time FBA, we can simulate the metabolic network in dynamic response to an in silico gene knockout perturbation. When we applied such knockouts, we observed two broad types of simulation results, examples of which are presented in Figure 4.
Figure 4.
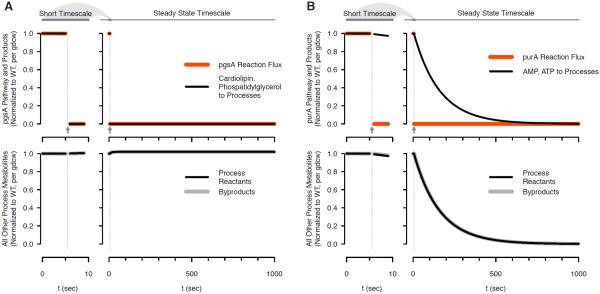
Flex and tFBA simulation with knockouts. Immediately after perturbation (left panels) at t > 5 sec indicated by arrows, and in the steady state time limit (right panels). (a) Acidic phospholipid pathway knockout of gene pgsA. (b) Purine pathway knockout of gene purA.
Many knockouts converge almost immediately to steady state, as in Figure 4a. An example is pgsA which catalyzes a step in the synthesis of E. coli membrane components cardiolipin and phosphatidylglycerol. Immediately upon constraining the pgsA flux to zero, the associated process reactant production is zero (top left Figure 4a) and this continues in the long time limits (top right Figure 4a). Meanwhile, all unrelated biomass reactants and byproducts continue to be produced (bottom left and right Figure 4a). Lack of cardiolipin and phosphatidylglycerol in the pgsA knockout simulation is consistent with experimental evidence where this strain has been shown to lack these two membrane components [32] and survive under some conditions.
A smaller group of knockouts display qualitatively different metabolite synthesis immediately upon and long after perturbation, as exemplified by purA in Figure 4b. Flux through the reaction towards de novo purine synthesis is set to zero, but in the short term purines are still provided to the processes (top right Figure 4b). Continued purine availability is due to tFBA purines being returned from the previous step as byproduct spent energy carrier ADP. Long-term gradual decrease occurs because at each time step a few of the returned purines are sequestered in cell macromolecules as RNA and `soluble pool' maintenance — mathematically mamp + matp < −madp — so without the ability to synthesize adenosine from small molecule nutrients the free amount declines (top right Figure 4b). Based on the flexFBA constraint fm < fatp, which represents the biological dependance of all metabolic activity on ATP, all other biomass reactants decrease proportionally (bottom left and right Figure 4b). Experimentally, purA knockouts are purine auxotrophs [33], consistent with the flexFBA and tFBA phenotype predictions.
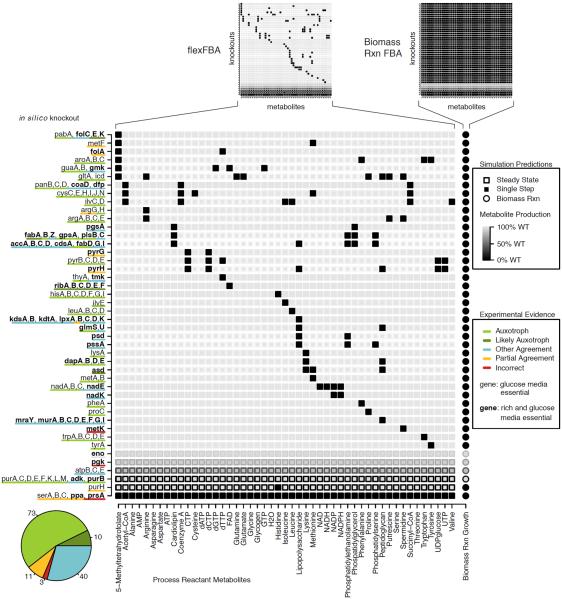
The flexFBA and tFBA techniques allow us to compare knockout simulations to experiment for each metabolite individually, rather than with the binary essential/non-essential gene classifications of biomass reaction FBA. Previously, such detailed predictions would have been possible only in part and only by testing media supplements over many simulations, or with computational searches of the FBA solution space [34]. Figure 5 emphasizes the increase in prediction detail with our techniques by summarizing results like those in Figure 4. In Figure 5, genes knocked out computationally are true-essential predictions for glucose minimal media from Feist et al. 2007 [24]. Process reactant absence is indicated by dark shading of that metabolite, short-term as fill and long-term as border. We contrast these results with the analogous biomass reaction results (small grids at top Figure 5): using the biomass reaction no useful detail is contained in the completely shaded grid (right Figure 5).
Figure 5.
Knockout strain versus process reactant production grid for flexFBA and biomass reaction FBA (small grids at top), and expanded to show detail for flexFBA. Strains included are those experimentally categorized as essential in glucose minimal (gene) or glucose minimal and additionally rich media (gene bolded) by Feist et al. [24]. Simulations completed in glucose minimal in silico media. Production immediately following perturbation given by shading (dark indicating metabolite absence), steady state limit result is outline. Experimental evidence associated with colored key for prediction correctness is in Table S1, categorized as follows: `Auxotrophs' are associated with direct literature reference to the knockout strain requiring the absent metabolites, precursors from which they can be synthesized, or some combination; `Likely Auxotrophs' are associated consistent but indirect literature reference to the knockout strain requiring the absent metabolites or precursors from which they can be synthesized; `Other Agreement' indicates that the absent metabolites are entirely consistent with literature documentation of the gene product, but cannot be transported from the media to supplement an auxotrophy; `Partial Agreement' indicates that literature references are consistent with some of the missing metabolites, but some either are or fail to be produced in conflict with literature evidence; `Incorrect' predictions are those for which detailed metabolite production is largely inconsistent with literature biochemical evidence. The knockouts in Figure 4 provide additional orientation to the information presented.
We can now make graded assessments of metabolic network predictions. A knockout has historically been called true-essential if the biomass reaction flux value is below some threshold for a gene found experimentally necessary for growth. These true-essential matches are considered a metric for the quality of metabolic network reconstructions. However, it provides no information about whether the prediction is correct for the relevant biological reason. We compared literature information to flexFBA metabolites absences in Figure 5, and indicate agreement by color (associated references in Table S1). The strains missing one or more biomass metabolites are analogous to auxotrophs, and for most of these experimental literature confirms that media must be supplemented with the metabolites unavailable in simulation or precursors. For genes where experimental evidence was consistent with the in silico phenotype, but it was not expected for the critical components to exchanged with the media, we assigned an `other agreement' classification. The `other agreement' group consists of mostly membrane components, electron transport chain enzymes, and nucleotide kinases.
Shown by the pie inset of Figure 5, the majority of true-essential predictions occur from biologically relevant consequences in the metabolic network. This agreement means that our detailed results are largely consistent with the accuracy classification implied by the `true' of true-essential biomass reaction predictions. 14 metabolic phenotypes were found in at least partially inconsistent with biochemical and genetic evidence. These phenotypes include cases in which FBA made technically correct predictions of essentiality, but with faulty reasoning. One example is the metK knockout for which spermidine synthesis is blocked in silico, preventing any biomass reaction flux. The zero biomass reaction flux is the traditional FBA prediction that metK is an essential gene, which matches with metK essentiality found experimentally. However, the metK knockout is not lethal because of spermidine absence, as strains have been isolated without the polyamines [35]. Instead, the reason a metK knockout is lethal involves the production of critical cofactors required for methionine biosynthesis [36]. These cofactors are used in cycles, which means that FBA can `balance' the fluxes even though the cofactors are never produced. Our new approach allows us to resolve the discrepancy between biochemical evidence and the in silico phenotype, whereas the previous FBA methods claimed a correct prediction. The folA knockout prediction is an analogous case to metK; serA, serB, and serC knockouts demonstrate the opposite phenomena wherein cycles which are possible for FBA but not in cells are disrupted. A number of these incorrect predictions involve cofactor cycling, among them folA and metK knockouts are both able to produce metabolites whose synthesis is in reality prevented. In the cases of serA, serB, and serC knockouts the balance of interconversion between acetyl-CoA and CoA is perturbed, to which FBA is apparently more sensitive than metabolism in vivo.
3.2. Expression Bursts
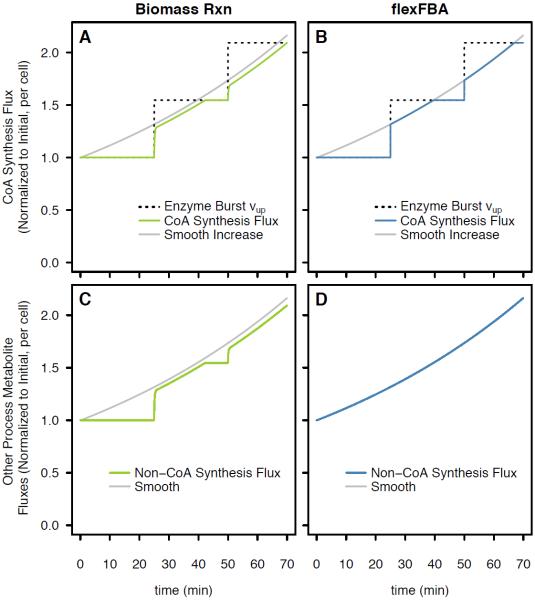
Figure 6 compares the results of our short-time FBA to biomass reaction simulations in the case of enzyme copy number fluctuations in a single cell. Some process reactant metabolites are required by the cell in small amounts, and the enzymes that produce them exist on the order of tens per cell. Increasingly, FBA approaches are refined with the addition of enzymatic parameters in bounds calculation [14], for example using protein counts and turnover number to constrain internal network fluxes [10]. For kinetic flux bounds to be applied in single cell integrated models, flexFBA is required to avoid biomass reaction artifacts from low copy number enzymes.
Figure 6.
Low copy number enzyme expression bursts. (a) Biomass reaction and (b) flexFBA: CoA synthesis reaction flux bounds (dotted), and flux (solid) compared to smooth (grey). (c) Biomass reaction and (d) flexFBA: biomass metabolite production (solid) compared to smooth (grey) for all biomass metabolites excepting CoA, Succinyl-CoA and Acetly-CoA.
Coenzyme A (CoA) is the small process requirement metabolite example for Figure 6 simulations, with total inclusion in biomass alone and as acetyland succinyl-CoA being six orders of magnitude smaller than the process requirement for ATP. An essential step in CoA synthesis is performed by coaBC, which is observed at an average of less than twenty per cell, produced from two or three transcription events per cell cycle [16]. We input an approximation of coaBC expression by translational bursts, which informs kinetic bounds on CoA synthesis shown in Figure 6a and b, compared to kinetic bounds which smoothly increase according to a population average. The biomass reaction and flexFBA predictions for CoA synthesis rate are similar, both being restricted while kinetic bounds for the single cell are lower than smooth population average (Figure 6a and b). The difference is when CoA synthesis is constrained below the smooth level, using the biomass reaction, all process reactant metabolite synthesis is also constrained (Figure 6c), whereas it is unperturbed by CoA limits using flexFBA (Figure 6d). Biomass reaction accumulation of macromolecular precursors is lowered by the periods of restriction. This deficit is seen as slightly lower fluxes compared to the smooth case even when coaBC enzyme is not limiting.
4. Discussion and Conclusions
We have constructed an FBA objective which is able to produce subsets of process reactants, and reproduces the traditional biomass production in the wild-type network case. In addition, our time-linked simulations allow us to observe transitions between FBA steady states. Critically, the methods satisfy the requirement for quick unsupervised operation such that they can be used in integrated modeling applications, and do so using off-the-shelf and open-source optimization packages. Furthermore, flexFBA functions robustly with the single added adjustable parameter of penalty term weighting γ. An additional strength is that as the penalty weighting approaches one the question asked converges from `whatever metabolism can make' to the to the classic population survival assessment.
The detailed results of flexFBA and tFBA in silico knockout predictions offer a new window into metabolic reconstructions. Correctness or incorrectness of essentiality and metabolic phenotype predictions are properties of the metabolic reconstruction and gene associations. What our methods make possible is to identify when correct predictions are made for the wrong reason, indicating a problem with the metabolic reconstruction. Identification of erroneous true-essential predictions is important as they may cause problems within other applications of FBA. For example, in metabolic engineering design these could lead to misguided computational suggestions for strain development efforts.
Our short-time FBA is necessary to avoid artifacts as we apply FBA at the short-time scale single-cell level with enzyme count and kinetic parameters as constraints. Using the biomass reaction, models predict that a cell constrains these distant pathways, including large fluxes catalyzed by high copy number enzymes, to match the transcriptional fluctuations of a single rare protein. On one second timescales, such a strict constraint is unreasonable both from an evolutionary perspective and from our mechanistic understanding. Furthermore, in the coaBC example we saw the impact of only one reaction limited by an enzyme produced in bursts, whereas many exist and, in simulation simultaneously, would result in even more dramatic limitation. Our methods introduce the first FBA solution that avoids propagating low copy enzyme bounds implausibly.
The biomass reaction previously limited application of genome scale stoichiometric metabolic models to population average and steady state growth. FlexFBA and tFBA together bring the relevant timescale to an intermediate range which will allow us to represent more cell physiological detail. The combined short-time FBA will be instrumental in whole-cell simulations and understanding the heterogeneity that underlies many critical phenomena in microbiology.
Supplementary Material
Highlights
The rigid Flux Balance Analysis (FBA) biomass reaction hinders whole-cell modeling.
New flexible FBA can produce subsets of biomass reactants.
Time-linked FBA removes the reactant-to-byproduct long-time assumption.
Our new methods avoid low-copy enzyme metabolic artifacts for whole-cell modeling.
Acknowledgements
We thank Derek Macklin and Jonathan Karr for helpful discussions on methods and presentation. This work was supported by a NIH Directors Pioneer Award (5DP1LM01150-05), an Allen Distinguished Investigator Award, and a Hellman Faculty Scholarship to M.W.C; a Stanford Bio-X Fellowship to E.W.B; and NSF Graduate Research Fellowship DGE-1147470 and Gabilan Stanford Graduate Fellowship Funds to M.U.
Footnotes
Publisher's Disclaimer: This is a PDF file of an unedited manuscript that has been accepted for publication. As a service to our customers we are providing this early version of the manuscript. The manuscript will undergo copyediting, typesetting, and review of the resulting proof before it is published in its final citable form. Please note that during the production process errors may be discovered which could affect the content, and all legal disclaimers that apply to the journal pertain.
References
- [1].Varma A, Palsson BO. Metabolic capabilities of Escherichia coli: I. synthesis of biosynthetic precursors and cofactors. J Theor Biol. 1993;165(4):477–502. doi: 10.1006/jtbi.1993.1202. [DOI] [PubMed] [Google Scholar]
- [2].Mahadevan RR, Edwards JSJ, Doyle FJF. Dynamic flux balance analysis of diauxic growth in Escherichia coli. Biophys J. 2002;83(3):1331–1340. doi: 10.1016/S0006-3495(02)73903-9. [DOI] [PMC free article] [PubMed] [Google Scholar]
- [3].Covert MW, Schilling CH, Famili I, Edwards JS, Goryanin II, Selkov E, Palsson BO. Metabolic modeling of microbial strains in silico. Trends Biochem Sci. 2001;26(3):179–186. doi: 10.1016/s0968-0004(00)01754-0. [DOI] [PubMed] [Google Scholar]
- [4].Edwards JS, Palsson BO. Metabolic flux balance analysis and the in silico analysis of Escherichia coli K-12 gene deletions. BMC Bioinformatics. 2000;1:1. doi: 10.1186/1471-2105-1-1. [DOI] [PMC free article] [PubMed] [Google Scholar]
- [5].Raman K, Chandra N. Flux balance analysis of biological systems: applications and challenges. Briefings in Bioinformatics. 2009;10(4):435–449. doi: 10.1093/bib/bbp011. [DOI] [PubMed] [Google Scholar]
- [6].Schuetz R, Kuepfer L, Sauer U. Systematic evaluation of objective functions for predicting intracellular fluxes in Escherichia coli. Molecular Systems Biology. 2007;3:119–119. doi: 10.1038/msb4100162. [DOI] [PMC free article] [PubMed] [Google Scholar]
- [7].Segrè D, Vitkup D, Church GM. Analysis of optimality in natural and perturbed metabolic networks. Proc Natl Acad Sci USA. 2002;99(23):15112–15117. doi: 10.1073/pnas.232349399. [DOI] [PMC free article] [PubMed] [Google Scholar]
- [8].Birch EW, Ruggero NA, Covert MW. Determining Host Metabolic Limitations on Viral Replication via Integrated Modeling and Experimental Perturbation. PLoS Comput Biol. 2012;8(10):e1002746. doi: 10.1371/journal.pcbi.1002746. [DOI] [PMC free article] [PubMed] [Google Scholar]
- [9].Gonçalves E, Bucher J, Ryll A, Niklas J, Mauch K, Klamt S, Rocha M, Saez-Rodriguez J. Bridging the layers: towards integration of signal transduction, regulation and metabolism into mathematical models. Mol. BioSyst. doi: 10.1039/c3mb25489e. [DOI] [PubMed] [Google Scholar]
- [10].Karr JR, Sanghvi JC, Macklin DN, Gutschow MV, Jacobs JM, Bolival B, Assad-Garcia N, Glass JI, Covert MW. A whole-cell computational model predicts phenotype from genotype. Cell. 2012;150(2):389–401. doi: 10.1016/j.cell.2012.05.044. [DOI] [PMC free article] [PubMed] [Google Scholar]
- [11].Feist AM, Palsson BO. The biomass objective function. Curr Opin Microbiol. 2010;13(3):344–349. doi: 10.1016/j.mib.2010.03.003. [DOI] [PMC free article] [PubMed] [Google Scholar]
- [12].Harcombe WR, Delaney NF, Leiby N, Klitgord N, Marx CJ. The Ability of Flux Balance Analysis to Predict Evolution of Central Metabolism Scales with the Initial Distance to the Optimum. PLoS Comput Biol. 2013;9(6):e1003091. doi: 10.1371/journal.pcbi.1003091. [DOI] [PMC free article] [PubMed] [Google Scholar]
- [13].Burgard AP, Maranas CD. Optimization-based framework for inferring and testing hypothesized metabolic objective functions. Biotechnol Bioeng. 2003;82(6):670–677. doi: 10.1002/bit.10617. [DOI] [PubMed] [Google Scholar]
- [14].Reed JL. Shrinking the Metabolic Solution Space Using Experimental Datasets. PLoS Comput Biol. 2012;8(8):e1002662. doi: 10.1371/journal.pcbi.1002662. [DOI] [PMC free article] [PubMed] [Google Scholar]
- [15].Zomorrodi AR, Suthers PF, Ranganathan S, Maranas CD. Mathematical optimization applications in metabolic networks. Metab Eng. 2012;14(6):672–686. doi: 10.1016/j.ymben.2012.09.005. [DOI] [PubMed] [Google Scholar]
- [16].Taniguchi Y, Choi PJ, Li GW, Chen H, Babu M, Hearn J, Emili A, Xie XS. Quantifying E. coli Proteome and Transcriptome with Single-Molecule Sensitivity in Single Cells. Science. 2010;329(5991):533–538. doi: 10.1126/science.1188308. [DOI] [PMC free article] [PubMed] [Google Scholar]
- [17].Lidstrom ME, Konopka MC. The role of physiological heterogeneity in microbial population behavior. Nat Chem Biol. 2010;6(10):705–712. doi: 10.1038/nchembio.436. [DOI] [PubMed] [Google Scholar]
- [18].Covert MW, Palsson BØ. Transcriptional regulation in constraints-based metabolic models of Escherichia coli. J Biol Chem. 2002;277(31):28058–28064. doi: 10.1074/jbc.M201691200. [DOI] [PubMed] [Google Scholar]
- [19].Covert MW, Xiao N, Chen TJ, Karr JR. Integrating metabolic, transcriptional regulatory and signal transduction models in Escherichia coli. Bioinformatics. 2008;24(18):2044–2050. doi: 10.1093/bioinformatics/btn352. [DOI] [PMC free article] [PubMed] [Google Scholar]
- [20].Jackowski S, Rock CO. Regulation of coenzyme A biosynthesis. The Journal of Bacteriology. 1981;148(3):926–932. doi: 10.1128/jb.148.3.926-932.1981. [DOI] [PMC free article] [PubMed] [Google Scholar]
- [21].Goldstein A, Goldstein DB, Brown BJ, Chou S-C. Amino acid starvation in an Escherichia coli auxotroph. I. E ects on protein and nucleic acid synthesis and on cell devision. Biochim Biophys Acta. 1959;36:163–172. doi: 10.1016/0006-3002(59)90080-0. [DOI] [PubMed] [Google Scholar]
- [22].Goss WA, Deitz WH, Cook TM. Mechanism of Action of Naladixic Acid on Escherichia coli. The Journal of Bacteriology. 1964;88:1112–1118. doi: 10.1128/jb.88.4.1112-1118.1964. [DOI] [PMC free article] [PubMed] [Google Scholar]
- [23].Ohashi Y, Hirayama A, Ishikawa T, Nakamura S, Shimizu K, Ueno Y, Tomita M, Soga T. Depiction of metabolome changes in histidine-starved Escherichia coli by CE-TOFMS. Mol. BioSyst. 2008;4(2):135. doi: 10.1039/b714176a. [DOI] [PubMed] [Google Scholar]
- [24].Feist AM, Henry CS, Reed JL, Krummenacker M, Joyce AR, Karp PD, Broadbelt LJ, Hatzimanikatis V, Palsson BØ. A genome-scale metabolic reconstruction for Escherichia coli K-12 MG1655 that accounts for 1260 ORFs and thermodynamic information. Molecular Systems Biology. 2007;3:121. doi: 10.1038/msb4100155. [DOI] [PMC free article] [PubMed] [Google Scholar]
- [25].Nookaew I, Jewett MC, Meechai A, Thammarongtham C, Laoteng K, Cheevadhanarak S, Nielsen J, Bhumiratana S. The genome-scale metabolic model iIN800 of Saccharomyces cerevisiae and its validation: a scaffold to query lipid metabolism. BMC Syst Biol. 2008;2(1):71. doi: 10.1186/1752-0509-2-71. [DOI] [PMC free article] [PubMed] [Google Scholar]
- [26].Heavner BD, Smallbone K, Barker B, Mendes P, Walker LP. Yeast 5 – an expanded reconstruction of the Saccharomyces cerevisiae metabolic network. BMC Syst Biol. 2012;6(1):55. doi: 10.1186/1752-0509-6-55. [DOI] [PMC free article] [PubMed] [Google Scholar]
- [27].Boyd S, Vandenberghe L. Convex optimization. [Google Scholar]
- [28].Sra S, Nowozin S, Wright SJ. Optimization for Machine Learning. MIT Press; 2012. [Google Scholar]
- [29].Bennett BD, Kimball EH, Gao M, Osterhout R, Van Dien SJ, Rabinowitz JD. Absolute metabolite concentrations and implied enzyme active site occupancy in Escherichia coli. Nature Publishing Group. 2009;5(8):593–599. doi: 10.1038/nchembio.186. [DOI] [PMC free article] [PubMed] [Google Scholar]
- [30].Covert MW, Knight EM, Reed JL, Herrgard MJ, Palsson BO. Integrating high-throughput and computational data elucidates bacterial networks. Nature. 2004;429(6987):92–96. doi: 10.1038/nature02456. [DOI] [PubMed] [Google Scholar]
- [31].Andersen MS, Dahl J, Vandenberghe L. CVXOPT: A Python package for convex optimization. [Google Scholar]
- [32].Mileykovskaya E, Ryan AC, Mo X, Lin C-C, Khalaf KI, Dowhan W, Garrett TA. Phosphatidic acid and N-acylphosphatidylethanolamine form membrane domains in Escherichia coli mutant lacking cardiolipin and phosphatidylglycerol. J Biol Chem. 2009;284(5):2990–3000. doi: 10.1074/jbc.M805189200. [DOI] [PMC free article] [PubMed] [Google Scholar]
- [33].Zalkin H. Escherichia coli and Salmonella. American Society for Microbiology; Washington, DC: 1996. Biosynthesis of purine nucleotides. [Google Scholar]
- [34].Imielinski M, Belta C, Halasz A, Rubin H. Investigating metabolite essentiality through genome-scale analysis of Escherichia coli production capabilities. Bioinformatics. 2005;21(9):2008–2016. doi: 10.1093/bioinformatics/bti245. [DOI] [PubMed] [Google Scholar]
- [35].Tabor CW, Tabor H. Polyamines in microorganisms. Microbiol Rev. 1985;49(1):81. doi: 10.1128/mr.49.1.81-99.1985. [DOI] [PMC free article] [PubMed] [Google Scholar]
- [36].Wei Y, Newman EB. Studies on the role of the metK gene product of Escherichia coli K-12. Molecular Microbiology. 2002;43(6):1651–1656. doi: 10.1046/j.1365-2958.2002.02856.x. [DOI] [PubMed] [Google Scholar]
Associated Data
This section collects any data citations, data availability statements, or supplementary materials included in this article.


