

Abstract
The transcriptome is subject to multiple changes during pathogenesis, including the use of alternate 5′ start-sites that can affect transcription levels and output. Current RNA sequencing techniques can assess mRNA levels, but do not robustly detect changes in 5′ start-site use. Here, we developed a transcriptome sequencing strategy that detects genome-wide changes in start-site usage (5′RNA-Seq) and applied this methodology to identify regulatory events that occur in hypertrophic cardiomyopathy (HCM). Compared with transcripts from WT mice, 92 genes had altered start-site usage in a mouse model of HCM, including four-and-a-half LIM domains protein 1 (Fhl1). HCM-induced altered transcriptional regulation of Fhl1 resulted in robust myocyte expression of a distinct protein isoform, a response that was conserved in humans with genetic or acquired cardiomyopathies. Genetic ablation of Fhl1 in HCM mice was deleterious, which suggests that Fhl1 transcriptional changes provide salutary effects on stressed myocytes in this disease. Because Fhl1 is a chromosome X–encoded gene, stress-induced changes in its transcription may contribute to gender differences in the clinical severity of HCM. Our findings indicate that 5′RNA-Seq has the potential to identify genome-wide changes in 5′ start-site usage that are associated with pathogenic phenotypes.
Introduction
Pathogenic mutations produce broad changes in cell biology, in part by affecting gene expression. Changes in gene expression include altering transcription levels and/or diversifying the transcriptome through alternative use of 5′ start-sites, alternative exon splicing, and differential use of polyadenylation sites. The use of alternative 5′ start-sites can influence the cell type that expresses a gene, transcription levels, mRNA stability, and/or encoded protein structure (1–3). Several methods for high-throughput sequencing of cDNA have been recently developed to interrogate the transcriptome (denoted RNA-Seq) (4–7). While these approaches measure changes in RNA levels, methods to assess changes in 5′ end usage across the entire transcriptome remain limited.
Here, we present a modification of existing RNA-Seq protocols to define genome-wide assessment of RNA levels and structure, inclusive of quantitative assessments of 5′ start-site usage (denoted 5′RNA-Seq). Using this methodology, we studied the mouse cardiac transcriptome in a model of human hypertrophic cardiomyopathy (HCM), a monogenic disorder caused by mutations in sarcomere protein genes. HCM is characterized by LV hypertrophy (i.e., increased LV wall thickness [LVWT]), myocyte enlargement and disarray, and increased myocardial fibrosis, but the severity of these manifestations and associated symptoms vary among patients. Recent studies have shown more severe LV hypertrophy (8), disease progression (9, 10), and adverse outcomes, including sudden cardiac death (11, 12), in men than women with HCM, information that implicates a role for genetic modifiers in disease expression. Using 5′RNA-Seq, we identified 92 genes with altered 5′ start-site usage in HCM. Among these, four-and-a-half LIM domains protein 1 (Fhl1), a chromosome X gene, had the most marked change in 5′ start-site usage in the hypertrophied LV of HCM mice. As Fhl1 ablation exacerbated the cardiomyopathy in HCM mice, we propose that stress-induced FHL1 and the regulatory molecules that alter Fhl1 transcription are genetic modifiers in HCM.
Results
We first optimized methodologies to construct cDNA libraries for RNA-Seq analyses, so as to minimize RNA or cDNA fragmentation and also to incorporate random hexamer priming to complete cDNA synthesis (Supplemental Methods; supplemental material available online with this article; doi:10.1172/JCI70108DS1). After adding adaptors, we used size selection and cDNA polarity to enrich the sequencing of small fragments that include transcripts with 5′ ends (Figure 1A and Supplemental Figures 1 and 2). As standard RNA-Seq provides sequences that are distributed across the entire gene, the acquisition of start-site information can require increased sequence depth and cost. Conversely, 5′RNA-Seq defined RNA levels and 5′ start-site information without additional sequencing. The gene expression profiles derived from this approach demonstrated high technical reproducibility (Supplemental Figure 3).
Figure 1. 5′RNA-Seq allows sensitive assessment of start-site changes.

(A) Distribution of reads with transcript reference (sense; left) or complement strand (antisense; right) plotted at positions normalized for transcript length. (B) Algorithm for assessing changes in distributions at gene start-sites. (C) Distribution of 92 genes with significant (P < 0.05) start-site fold changes in HCM. Fhl1 had the most robust change (see Supplemental Table 2).
To identify differences in start-site usage, we developed a computational approach that detected differences in read depth distribution at the start-site regions of genes and quantified the extent of change in start-site usage (Figure 1B and Supplemental Methods). The sum of instances with detected shifts at 5′ ends was converted into a 5′RNA-Seq score for each gene (GEO accession no. GSE52038). This score only considers changes of read distribution at 5′ ends of RNA, normalized for gene expression changes, so that genes with large changes in expression and no change in read distribution at 5′ ends receive a lower score. Thus, the 5′RNA-Seq score ranks genes with altered start-site usage. Genes with only 1 previously defined start-site that exhibited additional novel start-sites were also detected, since detection of a shift in transcript start-site was not dependent on prior annotation (Figure 1B). This bioinformatic approach was implemented in a series of PERL scripts combined into a single open-source software package with configurable parameters that outputs computation of gene expression profiles, quantification of 5′ changes, and a tool for visualization of read profiles (Supplemental Software).
We used 5′RNA-Seq to assess the transcriptional program in the hearts of MHC403/+ mice, which carry a human HCM missense mutation, Arg403Gln, in the myosin heavy chain gene (13–15). Adult male MHC403/+ mice recapitulate the histopathologic manifestations of human HCM. Expression of 5,132 genes was significantly changed in male MHC403/+ versus WT LV (4,641 increased, 491 decreased; GEO accession no. GSE52038). To assess the accuracy of measuring RNA levels using 5′RNA-Seq, we compared these data with those obtained by a previously validated method (16, 17), deep sequencing analysis of gene expression (DSAGE; Supplemental Figure 4). We observed a strong correlation (r = 0.9) for the datasets generated by either methodology, including low abundant transcripts.
The UCSC Genome browser defines 8,000 annotated mouse genes with more than 1 transcriptional start-site (Supplemental Methods). Genome-wide assessment of start-site usage in MHC403/+ LV revealed 92 genes with 5′RNA-Seq score ≥20, indicative of significant changes in transcriptional start-site usage compared with WT LV. Approximately 30% of these genes were annotated as having only 1 initiation site (Figure 1C and Supplemental Table 1). 52 of the 92 genes with altered start-site usage in MHC403/+ hearts also had significant differences (fold change >1.5 or <0.67 and P < 0.001) in expression levels (44 increased, 8 decreased). The fraction of genes with alterations in both start-site and transcript levels was significantly more than genome-wide expression changes (P = 5.4 × 10⁻²⁴). Gene ontology analyses of genes with altered 5′ start-sites identified actin binding and cytoskeletal protein binding as highly ranked, significant categories (Supplemental Table 2).
We used 2 strategies to validate 5′RNA-Seq for defining alternative start-site usage. First, we visually assessed the paired-end reads in 800 genes with 5′RNA-Seq score ≥20 (GEO accession no. GSE52038) and confirmed that these corresponded to alternative transcriptional start-sites annotated in the UCSC Genome browser and/or demonstrated continuity with another exon in the same gene. The rank order of 5′RNA-Seq scores significantly predicted alternative start-site usage (P = 1.1 × 10⁻¹¹, receiver operating characteristic [ROC] curve analysis; Supplemental Figure 5). Second, we performed 5′ rapid amplification of cDNA ends (5′RACE; see Methods) on 5 genes with 5′RNA-Seq scores between 30 and 257 (Supplemental Figure 6) and validated the alternative start-site usage in each.
To determine whether the 92 genes with altered 5′ start-sites in MHC403/+ hearts reflected regulatory changes within myocytes that express the mutant sarcomere protein, or rather within nonmyocytes that subsequently proliferate and contribute to increased fibrosis, we performed RNA-Seq on isolated cell populations. 12 genes were expressed primarily in myocytes, 21 were expressed primarily in nonmyocytes, and 59 were expressed in both (Supplemental Table 1).
Fhl1 had the highest change in 5′ start-site usage (69-fold, P = 4.8 × 10⁻²⁴; 5′RNA-Seq score, 257) among more than 15,000 transcripts expressed in the LV. Although Fhl1 expression was increased in MHC403/+ hearts (13-fold; P < 0.001), this level was less than 183 other LV RNAs, highlighting a substantive difference between data obtained by 5′RNA-Seq compared with more traditional RNA-Seq methodologies. The ratio of reads from the 2 alternative first exons in Fhl1 increased 69-fold in MHC403/+ versus WT mouse hearts (P = 4.8 × 10⁻²⁴). Fhl1 transcriptional profiles (Figure 2A) revealed that WT mice used a basal start-site (referred to herein as bFhl1; bFHL1 in protein) located 5′ to an alternative HCM-induced start-site (iFhl1; iFHL1) that was predominant in MHC403/+ mice. The normalized transcriptional read depths were similar for bFhl1 in hearts from WT and MHC403/+ mice; therefore, the markedly increased Fhl1 expression in mutant hearts reflected use of the iFhl1 start-site. The iFhl1 translational site is predicted to incorporate 16 amino acids (NCBI accession no. NP_001070830) that are absent from bFhl1 transcripts. The 16 amino acids are highly conserved among mammals, and 15 of 16 are identical in mice and humans (NCBI accession no. NP_001153171).
Figure 2. Fhl1 transcripts in WT and MHC403/+ LV and isolated myocytes and nonmyocytes.

(A) UCSC genome browser screen shot of the Fhl1 gene, showing normalized read depths found in WT and HCM (MHC403/+) hearts. Structures of bFhl1 and iFhl1 isoforms are shown. Note the 10-fold difference in y axis scales; iFhl1 in HCM hearts was expressed at a 10-fold higher level than bFhl1 in WT hearts. (B) Fhl1 5′RACE products fractionated on an agarose gel confirmed 5′RNA-Seq estimates of bFHL1 and iFHL1 levels. For analyses of PCR products, see Supplemental Figure 7. (C) Western blot showing increased iFHL1 levels in HCM LV protein extracts. Extracts (15 μg Fhl1-null, 15 μg WT, 5 μg MHC403/+ per lane) were fractionated on a 12% SDS-polyacrylamide gel. Note the size shift due to the addition of 16 amino acids to the iFHL1 protein (∼1.6 kDa) compared with the bFHL1 protein. (D) iFhl1 and bFhl1 expression in LV, isolated myocytes, and nonmyocytes from 3 WT and 3 MHC403/+ mice. No iFhl1 transcripts were detected in nonmyocytes from WT or MHC403/+ hearts. Reads were normalized to total reads per million (see Methods). *P < 5 × 10⁻⁶, **P < 10–7, ***P = 2 × 10–16, Fisher exact test.
To semiquantitatively assess Fhl1 start-site usage in MHC403/+ and WT mouse hearts, we performed 5′RACE (Figure 2B and Supplemental Figure 6). Dideoxy sequences of 5′RACE fragments confirmed alternative 5′ start-site usage and indicated predominant expression of bFhl1 in WT hearts and iFhl1 in MHC403/+ hearts (Supplemental Figure 7). We also assessed FHL1 protein expression by Western blot analyses of cardiac lysates. FHL1 protein was not detected in Fhl1-null hearts, but was markedly increased in MHC403/+ LV extracts (Figure 2C). Densitometry analysis of Western blots (n = 3 per genotype) indicated that MHC403/+ LV had 5.3- ± 0.6-fold increased FHL1 levels compared with WT LV (P = 0.001). MHC403/+ LV extracts contained both bFHL1 and the 1.6-kDa-larger iFHL1 isoform, which is transcribed from the altered start-site. Consistent with 5′RNA-Seq data, the iFHL1/bFHL1 protein ratio was 2.57- ± 0.3-fold higher in MHC403/+ lysates than in WT lysates (n = 3; P = 0.03; Figure 2C).
Altered Fhl1 expression in the LV of MHC403/+ mice primarily reflected transcriptional changes in myocytes (Supplemental Table 1). Isolated MHC403/+ myocytes had higher Fhl1 levels and predominantly iFhl1 transcripts, unlike WT myocytes, which primarily expressed bFhl1 (Figure 2D and Supplemental Figure 8). Nonmyocytes isolated from WT or MHC403/+ mice expressed comparable bFhl1 transcript levels and no iFhl1 transcripts.
The closely related gene Fhl2 also used an alternative start-site (5′RNA-Seq score, 148), but had decreased expression (0.6-fold) in MHC403/+ versus WT hearts. The iFhl2 transcript, unlike iFhl1, did not encode different amino acids (Supplemental Figure 6). In addition, the transcriptional changes in Fhl2 occurred primarily in nonmyocytes, which had increased iFhl2 expression, whereas myocytes expressed predominantly bFhl2 (data not shown).
We hypothesized that induction of the iFhl1 isoform might have functional roles in the myocyte responses to HCM mutations. To address this, we crossed Fhl1-null mice expressing lacZ under the endogenous Fhl1 promoter (18) with MHC403/+ mice. As Fhl1 is encoded on chromosome X, we studied hemizygous male (Fhl1lacZ) and homozygous female (Fhl1lacZ/lacZ) mice. The LVWT of adult male and female Fhl1-null mice was comparable to that of WT controls.
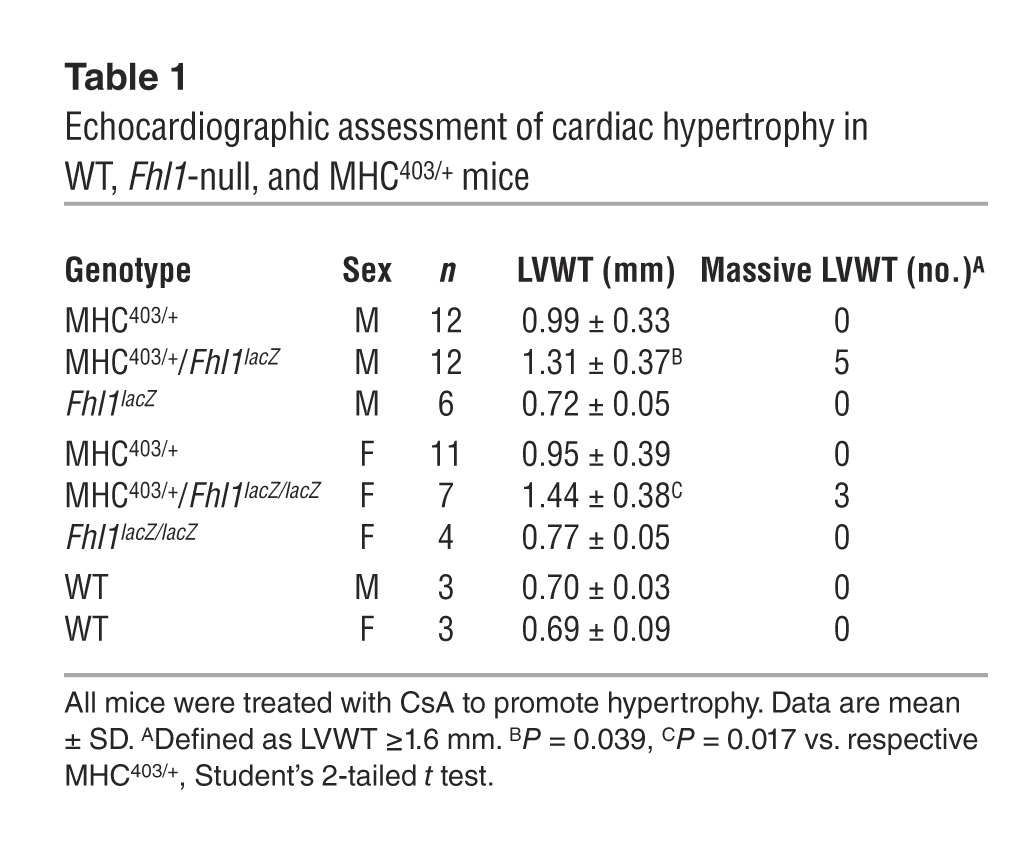
As female MHC403/+ mice exhibit less LVWT and histopathologic manifestations of HCM than male MHC403/+ mice (13), we expected gender-specific changes to Fhl1 ablation. However, we observed a marked increase in HCM manifestations for both male and female MHC403/+/Fhl1-null mice. Both male MHC403/+/Fhl1lacZ and female MHC403/+/Fhl1lacZ/lacZ mice developed significantly thicker LV walls than MHC403/+ mice (P = 0.039 and P = 0.017, respectively; Table 1). Moreover, RNA-Seq analyses of MHC403/+/Fhl1-null mice showed greater transcriptional activation of genes encoding signature molecules of hypertrophy and fibrosis (Supplemental Table 3). Expression of Nppa (4.1-fold) and Nppb (1.7-fold); the profibrotic genes Postn, Ctgf, Tgfb2, and Tgfb3; and several collagens was significantly more elevated in MHC403/+/Fhl1-null versus MHC403/+ LV.
Table 1.
Echocardiographic assessment of cardiac hypertrophy in WT, Fhl1-null, and MHC403/+ mice
The 5′RNA-Seq data confirmed that compound WT/Fhl1-null and MHC403/+/Fhl1-null mice maintained the Fhl1 transcriptional regulation patterns located 5′ to the lacZ insert that were defined in WT and MHC403/+ mice (Supplemental Figure 9), which indicates that induction of iFhl1 transcription in HCM hearts does not require Fhl1 expression. iFhl1-promoted β-gal activity (see Methods) was absent in LV sections from WT/Fhl1-null mice, but present in myocytes adjacent to fibrotic regions in young, prehypertrophic MHC403/+/Fhl1-null mice (Figure 3A). Consistent with increased transcription of the iFhl1 isoform, β-gal activity was robust in myocytes from MHC403/+/Fhl1-null mice with overt hypertrophy.
Figure 3. Fhl1 expression in mouse and human cardiomyopathic hearts.

(A) Histologic assessment of fibrosis and Fhl1 expression in male WT (Fhl1hemi/–) and HCM (Fhl1hemi/–) mouse hearts, assessed by lacZ expression in mice carrying the Fhl1lacZ allele (blue staining from β-gal with X-gal). Sections were also stained with Sirius red, which stains collagen in fibrotic areas red. The WT mouse expressed no iFhl1 and had no fibrosis. The young MHC403/+ mouse heart (bottom left) exhibited focal fibrosis (red) and iFhl1 expression (blue) prior to hypertrophy onset. An adult hypertrophic MHC403/+ mouse heart (top right) exhibited markedly increased iFhl1 expression in myocytes (bottom right, magnified view of boxed region) juxtaposed to interstitial fibrosis. Scale bars: 0.5 mm (left and top right); 0.05 mm (bottom right). (B) iFhl1 upregulation in mouse and human cardiomyopathies. Mouse 5′RNA-Seq libraries were constructed from RNA pooled from a minimum of 3 mouse hearts; human 5′RNA-Seq libraries were constructed from LV RNA extracted from individual subject hearts. N, normal; DCM, dilated cardiomyopathy; LVH, pressure overload LV hypertrophy; CHF, congestive heart failure.
As prior studies identified increased Fhl1 expression in the LV from WT mice with pressure overload hypertrophy (19) and from human HCM hearts (20), we examined whether the Fhl1 transcriptional changes induced in HCM mice also occurred in other cardiac pathologies. 5′RNA-Seq analyses of LV samples from patients with HCM, dilated cardiomyopathy, aortic stenosis, and heart failure showed markedly increased expression of iFHL1 transcripts, similar to that found in HCM mice (Figure 3B and Supplemental Figure 10).
Discussion
We here report a robust methodology for acquiring 5′RNA-Seq gene expression profiles and computational approaches to detect and quantify start-site usage throughout the genome. As the profiles defined by 5′RNA-Seq and DSAGE (16) were strongly correlated (Supplemental Figure 4), we conclude that the technical modifications used to enrich analyses of 5′ ends of RNA caused no substantial loss of transcriptome data.
Using 5′RNA-Seq analyses to characterize the cardiac transcriptome from WT and HCM mice, we identified 92 genes that underwent significant changes in start-site usage in response to a sarcomere gene mutation (Supplemental Table 1, Supplemental Figures 6 and 11, and Supplemental Software). Fhl1 exhibited marked transcriptional diversity, including increased expression and myocyte-specific induction of iFhl1, a novel transcript that uses an alternative start-site and incorporates 16 additional amino acids. Further studies will be needed to determine whether altered protein levels or distinct activities by the iFhl1 isoform affect myocyte biology in HCM and to identify the regulatory mechanisms that account for these transcriptional changes. As 5′RNA-Seq analyses of human patients with distinct cardiac pathologies also showed induction of iFHL1, understanding these processes should improve insights into the transcriptional responses to myocyte stress.
Increased expression of the Fhl1 isoform could occur because iFhl1 participates in the pathogenic pathways triggered by a sarcomere gene mutation or, alternatively, because iFhl1 has salutary roles in HCM. Gene ablation studies clarified this ambiguity: MHC403/+/Fhl1-null mice had significantly worse HCM, including increased LV hypertrophy, fibrosis, and induction of molecular markers of pathologic remodeling. This result paralleled the finding that isoproterenol-induced hypertrophy was more severe in Fhl2-null mice (21), but was discordant with the observation of attenuated pressure overload hypertrophy in Fhl1-null WT mice (18). We suspect these differences reflect independent hypertrophic signaling pathways, which is supported by the distinct response to the calcineurin inhibitor CsA, which decreases pressure overload hypertrophy in WT mice (22), but increases hypertrophy in mice with a sarcomere gene mutation (23).
Recently, 3 rare human variants in FHL1 were proposed to cause HCM (24) that exhibited incomplete penetrance in females and an associated skeletal myopathy in some males. That Fhl1-null mice had normal cardiac dimensions and function raises an alternative interpretation: that human variation in Fhl1, in particular that causing a loss of protein function, prevents the salutary effects of increased levels and isoform switching of Fhl1 in HCM and in other cardiac (and perhaps skeletal muscle) disease.
Although disease-causing mutations in HCM are autosomal dominant, clinical studies demonstrate more severe hypertrophy (8) and LV dysfunction in men (9, 10) compared with women with HCM as well as more sudden death events during athletic participation (11). Male and female MHC403/+ mice show similar gender-specific differences in disease severity (13). Deletion of Fhl1 caused profound hypertrophy (defined as LVWT ≥1.6 mm) in 43% of female and 25% of male MHC403/+/Fhl1-null mice. Given its location on chromosome X, we speculate that gene dosage and FHL1 allelic variation in humans contributes to gender differences in HCM. For example, the exon sequencing project (25) has identified a FHL1 frameshift mutation and a deleterious missense mutation (p.D275N) in 0.5% and 1.3% of the population, respectively. As men carry a single FHL1 allele, these and other loss-of-function variants would mitigate the potential benefits of myocyte expression of iFHL1 in response to stress.
In conclusion, our 5′RNA-Seq strategy provided new insights into the genome-wide transcriptional diversity occurring in HCM. 5′RNA-Seq data revealed dynamic regulation of iFhl1 in HCM myocytes that, when abrogated, increased cardiomyopathic processes. To our knowledge, iFhl1 represents the first beneficial genetic modifier in HCM.
Methods
Model organisms.
MHC403/+ mice in the 129/SvEv background and Fhl1-null mice in the Black Swiss background were mated, and littermates of different genotypes were studied. Primers used to genotype Fhl1-null mice were AAACCAGGCAAAGCGCCATTCG, GGCCCACTTGTCCTCTGAGTCAGC, and TGCAAGGGGTCCCTGCAGTAGTGA. The combination of these 3 primers used in the same reaction produced a ∼370-bp (WT) or ∼510-bp (KO) band. For all MHC403/+, MHC403/+/Fhl1-null, and WT mice used in these experiments, cyclosporine A (CsA) was administered in chow (100 mg CsA/100 g chow) to accelerate hypertrophic remodeling (17).
Echocardiographic studies.
Mice were anesthetized with an isoflurane vaporizer (VetEquip), and each limb was placed on the ECG leads on a Vevo Mouse Handling Table (VisualSonics Inc.), maintaining the body temperature at 37°C during the study. Transthoracic echocardiography was performed using Vevo 770 High-Resolution In Vivo Micro-Imaging System and RMV 707B scan-head (VisualSonics Inc.), with heart rate at 500–550 bpm. The images were acquired as 2D (left parasternal long and short axes) and M-mode (left parasternal short axis). Measurements were averaged from images acquired during 3 consecutive heart beats. All echocardiographic measurements were performed with the user blinded to mouse genotype.
5′RNA-Seq library construction and analysis.
Human tissue samples were obtained from study participants undergoing either myectomy heart surgery, cardiac transplant surgery, or valve replacement surgery.
RNA from human tissues and mouse LV was prepared (26). To reduce biological variation in mouse specimens, RNA was pooled from at least 3 biological replicates. 5′RNA-Seq libraries were constructed as described previously to prevent RNA or cDNA fragmentation and did not include normalization (26). Uniform amplification of the cDNA library was achieved with amplification cycling before the reaction reached saturation, as determined by quantitative PCR. Following sequencing, alignment of reads was performed with Tophat (version 1.0.14) (27). Read depth profiles were constructed with Tophat’s “wiggles” tool, and values were normalized to total aligned reads and uploaded on the UCSC browser (28) or IGV (29). The read depths shown were adapted after visualization with UCSC Genome Browser. Gene expression profiles were constructed by tallying reads on gene loci, using a Bayesian P value to assess the significance of gene expression differences between samples (16, 30). Samtools (31) was used to generate and process binary alignment files. Plots of directional reads were generated by assigning gene reads to bins based on the position of the read on the transcript, including upstream and downstream regions. Gene ontology analysis was performed with the Database for Annotation, Visualization, and Integrated Discovery (DAVID), version 6.7 (32).
Genome-wide comparison of MHC403/+ and WT cardiac samples, including read distributions at 5′ ends and expression level, is available at GEO (accession no. GSE52038). Data included are (a) gene, (b) description, (c) chromosome, (d) genome start coordinate, (e) genome end coordinate, (f) strand, (g) annotated transcription start coordinates, (h) 5′ region used by the start-site analysis algorithm, (i) 5′RNA-Seq score, (j) read counts normalized to 1 × 10⁶ total sample reads for the indicated sample, (k) normalized read counts for the indicated sample in j, (l) gene read counts for the indicated sample, (m) gene read counts for the indicated sample, (n) fold change between the 2 normalized read counts of the 2 samples as indicated, (o) Bayesian P value comparison between the 2 read values.
Mathematical formulation of start-site analysis algorithm.
For any genome G with total m genes, say {x1, x2, x3 . . . xm}, we here define a typical gene model and mathematical algorithm.
Assume a typical gene x ′ε {x1, x2, x3 . . . xm} from genome G has n isoforms, and each isoform has a unique 5′ position (Figure 1B). Assume the total number of reads for gene x is xa from sample A and xb from sample B.
As shown in Figure 1B, each isoform has a 5′ interval of 400 bp, and assume each position has some read coverage:
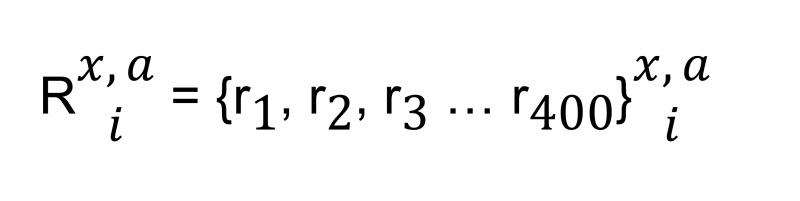
(Equation 1)
where Rx,ia represents the vector of reads at each position in ith isoform for gene x in sample A.
We normalized each vector with corresponding total reads:

(Equation 2)
where a represents sample A; x represents any gene x from genome G; xa represents the total number of reads for gene x from sample A; and NRDx,ia represents the normalized read depth for sample A for ith isoform of gene x from genome G.
Next, we calculated a normalized read depth ratio (NRDR) vector of 400 elements for ith isoform of gene x of genome G:

(Equation 3)
where the nth element of NRDR vector is defined as the ratio of the nth element of NRDx,ia vector to the nth element of vector NRDx,ib.
After calculating NRDR xi we calculated P values based on a Bayesian test (30). We obtained a P value vector from Rx,ia and Rx,ib vectors and xa and xb values of the same size as NRDR xi :
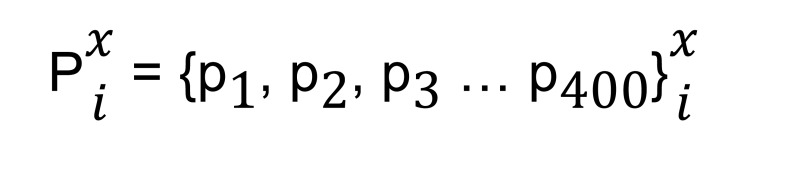
(Equation 4)
where the nth element of the P value vector is the P value for the nth element of the NRDR xi vector.
Using these NRDR xi and P xi , we assigned a binary vector to each isoform i of gene x from genome G:
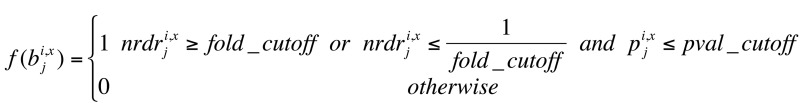
(Equation 5)
where j is the position in the 5′ interval (of 400 bp for the typical isoform, adjusted to 200 bp when another gene is potentially overlapping the upstream region).
We then computed the 5′RNA-Seq score sx for each gene x, which was the sum of the binary vector for x. This way, we obtained a score vector for all m genes for the genome — i.e., G[x] = {x1, x2, x3 . . . xm} — for samples A and B:

(Equation 6)
We implemented this mathematical concept using Perl (Supplemental Software).
Myocyte and nonmyocyte isolation.
Cells were isolated using the Langendorff heart preparation, as previously performed (17). In addition, the final myocyte pellet was resuspended in MEM with 5% FBS and 2 mM l-glutamine and plated in laminin-coated culture dishes (in 2% CO2 incubator at 37°C). After 1 hour of incubation, cells were rinsed with sterile PBS to remove nonadherent cells and debris, and TRIzol (Invitrogen) was added to extract total RNA according to manufacturer protocols.
5′RACE.
5′RACE was performed using a commercially available kit (Ambion, catalog no. AM1700), with amplification performed using rTth DNA polymerase (Applied Biosystems, catalog no. N808-0188). For Fhl1, an outer primer with sequence TCCAGATGTGATGGCCTTGTTGCACTT and an inner primer with sequence ACATGGTGCCCACCTTATAGCTGGA were used.
Western blotting and histology staining.
To achieve separation between bFHL1 and iFHL1, Western blot was performed using a 12% polyacrylamide gel. An FHL1 mouse monoclonal antibody was used (Abcam, catalog no. Ab58067). For histology, we confirmed that both the bFhl1 and iFhl1 transcripts encoded lacZ sequences in frame. Frozen sections were prepared and incubated with X-gal for 30 minutes to stain iFhl1, or overnight to stain bFhl1 (data not shown). Sections were then washed in PBS, fixed in 4% PFA for 40 minutes, washed in PBS again, stained with Sirius red as previously described (33), and mounted with Permount.
Statistics.
Significance was assessed by Bayesian P value, 2-sample Student’s t test, or Fisher exact test on selected groups. A P value less than 0.05 was considered significant.
Study approval.
Animal studies were performed in accordance with protocols approved by the Animal Care and Use Committee of Harvard Medical School. Discarded human tissue collections were obtained and studied according to institutional guidelines using protocols approved by the Partners (Brigham and Women’s and Massachusetts General Hospitals) Human Research Committee. Written informed consent was obtained from study participants or their guardians.
Supplementary Material
Acknowledgments
We are grateful to Michael Springer (Harvard Medical School) for helpful discussions. This work was supported in part by HHMI (to C.E. Seidman, S. Eminaga, and S.R. DePalma), NHLBI, NIH (to H. Wakimoto, K. Onoue, J.M. Gorham, D.A. Conner, D.M. McKean, J.G. Seidman, C.E. Seidman, P.L. DeJager, M.L. Bulyk, and J. Chen), and Leducq (to C.E. Seidman and J.G. Seidman). J.G. Seidman and C.E. Seidman are members of the CVDC, funded by NIH grant U01 HL098166. M.L. Bulyk received NIH/NHGRI grant R01 HG005287. P.L. DeJager received NIH grant R01 AG015819.
Footnotes
Conflict of interest: The authors have declared that no conflict of interest exists.
Citation for this article: J Clin Invest. 2014;124(3):1364–1370. doi:10.1172/JCI70108.
References
- 1.Williams FM, Flintoff WF. Structural organization of the human reduced folate carrier gene: evidence for 5′ heterogeneity in lymphoblast mRNA. Somat Cell Mol Genet. 1998;24(3):143–156. doi: 10.1023/B:SCAM.0000007117.50428.63. [DOI] [PubMed] [Google Scholar]
- 2.Menon RK, Shaufl A, Yu JH, Stephan DA, Friday RP. Identification and characterization of a novel transcript of the murine growth hormone receptor gene exhibiting development- and tissue-specific expression. Mol Cell Endocrinol. 2001;172(1–2):135–146. doi: 10.1016/S0303-7207(00)00375-0. [DOI] [PubMed] [Google Scholar]
- 3.Rasmussen AA, et al. Regulation of ompA mRNA stability: the role of a small regulatory RNA in growth phase-dependent control. Mol Microbiol. 2005;58(5):1421–1429. doi: 10.1111/j.1365-2958.2005.04911.x. [DOI] [PubMed] [Google Scholar]
- 4.Mortazavi A, Williams BA, McCue K, Schaeffer L, Wold B. Mapping and quantifying mammalian transcriptomes by RNA-Seq. Nat Methods. 2008;5(7):621–628. doi: 10.1038/nmeth.1226. [DOI] [PubMed] [Google Scholar]
- 5.Sultan M, et al. A global view of gene activity and alternative splicing by deep sequencing of the human transcriptome. Science. 2008;321(5891):956–960. doi: 10.1126/science.1160342. [DOI] [PubMed] [Google Scholar]
- 6.Nagalakshmi U, et al. The transcriptional landscape of the yeast genome defined by RNA sequencing. Science. 2008;320(5881):1344–1349. doi: 10.1126/science.1158441. [DOI] [PMC free article] [PubMed] [Google Scholar]
- 7.Trapnell C, et al. Differential gene and transcript expression analysis of RNA-seq experiments with TopHat and Cufflinks. Nat Protoc. 2012;7(3):562–578. doi: 10.1038/nprot.2012.016. [DOI] [PMC free article] [PubMed] [Google Scholar]
- 8.Lind JM, et al. Sex hormone receptor gene variation associated with phenotype in male hypertrophic cardiomyopathy patients. J Mol Cell Cardiol. 2008;45(2):217–222. doi: 10.1016/j.yjmcc.2008.05.016. [DOI] [PubMed] [Google Scholar]
- 9.Kubo T, et al. Serum cardiac troponin I is related to increased left ventricular wall thickness, left ventricular dysfunction, and male gender in hypertrophic cardiomyopathy. Clin Cardiol. 2010;33(2):E1–E7. doi: 10.1002/clc.20622. [DOI] [PMC free article] [PubMed] [Google Scholar]
- 10.Page SP, et al. Cardiac myosin binding protein-C mutations in families with hypertrophic cardiomyopathy: disease expression in relation to age, gender, and long term outcome. Circ Cardiovasc Genet. 2012;5(2):156–166. doi: 10.1161/CIRCGENETICS.111.960831. [DOI] [PubMed] [Google Scholar]
- 11.Maron BJ, Doerer JJ, Haas TS, Tierney DM, Mueller FO. Sudden deaths in young competitive athletes: analysis of 1866 deaths in the United States, 1980–2006. Circulation. 2009;119(8):1085–1092. doi: 10.1161/CIRCULATIONAHA.108.804617. [DOI] [PubMed] [Google Scholar]
- 12.Harmon KG, Asif IM, Klossner D, Drezner JA. Incidence of sudden cardiac death in national collegiate athletic association athletes. Circulation. 2011;123(15):1594–1600. doi: 10.1161/CIRCULATIONAHA.110.004622. [DOI] [PubMed] [Google Scholar]
- 13.Geisterfer-Lowrance AA, et al. A mouse model of familial hypertrophic cardiomyopathy. Science. 1996;272(5262):731–734. doi: 10.1126/science.272.5262.731. [DOI] [PubMed] [Google Scholar]
- 14.Seidman JG, Seidman C. The genetic basis for cardiomyopathy: from mutation identification to mechanistic paradigms. Cell. 2001;104(4):557–567. doi: 10.1016/S0092-8674(01)00242-2. [DOI] [PubMed] [Google Scholar]
- 15.Geisterfer-Lowrance AA, et al. A molecular basis for familial hypertrophic cardiomyopathy: a beta cardiac myosin heavy chain gene missense mutation. Cell. 1990;62(5):999–1006. doi: 10.1016/0092-8674(90)90274-I. [DOI] [PubMed] [Google Scholar]
- 16. Christodoulou DC, Gorham JM, Kawana M, DePalma SR, Herman DS, Wakimoto H. Quantification of gene transcripts with deep sequencing analysis of gene expression (DSAGE) using 1 to 2 microg total RNA. Curr Protoc Mol Biol. 2011. Chapter 25 : Unit25B 9 [DOI] [PMC free article] [PubMed] [Google Scholar]
- 17.Teekakirikul P, et al. Cardiac fibrosis in mice with hypertrophic cardiomyopathy is mediated by non-myocyte proliferation and requires Tgf-β. J Clin Invest. 2010;120(10):3520–3529. doi: 10.1172/JCI42028. [DOI] [PMC free article] [PubMed] [Google Scholar]
- 18.Sheikh F, et al. An FHL1-containing complex within the cardiomyocyte sarcomere mediates hypertrophic biomechanical stress responses in mice. J Clin Invest. 2008;118(12):3870–3880. doi: 10.1172/JCI34472. [DOI] [PMC free article] [PubMed] [Google Scholar]
- 19.Song HK, Hong SE, Kim T, Kim do H. Deep RNA sequencing reveals novel cardiac transcriptomic signatures for physiological and pathological hypertrophy. PLoS One. 2012;7(4):e35552. doi: 10.1371/journal.pone.0035552. [DOI] [PMC free article] [PubMed] [Google Scholar]
- 20.Lim DS, Roberts R, Marian AJ. Expression profiling of cardiac genes in human hypertrophic cardiomyopathy: insight into the pathogenesis of phenotypes. J Am Coll Cardiol. 2001;38(4):1175–1180. doi: 10.1016/S0735-1097(01)01509-1. [DOI] [PMC free article] [PubMed] [Google Scholar]
- 21.Kong Y, et al. Cardiac-specific LIM protein FHL2 modifies the hypertrophic response to beta-adrenergic stimulation. Circulation. 2001;103(22):2731–2738. doi: 10.1161/01.CIR.103.22.2731. [DOI] [PubMed] [Google Scholar]
- 22.Molkentin JD, et al. A calcineurin-dependent transcriptional pathway for cardiac hypertrophy. Cell. 1998;93(2):215–228. doi: 10.1016/S0092-8674(00)81573-1. [DOI] [PMC free article] [PubMed] [Google Scholar]
- 23.Fatkin D, et al. An abnormal Ca(2+) response in mutant sarcomere protein-mediated familial hypertrophic cardiomyopathy. J Clin Invest. 2000;106(11):1351–1359. doi: 10.1172/JCI11093. [DOI] [PMC free article] [PubMed] [Google Scholar]
- 24.Friedrich FW, et al. Evidence for FHL1 as a novel disease gene for isolated hypertrophic cardiomyopathy. Hum Mol Genet. 2012;21(14):3237–3254. doi: 10.1093/hmg/dds157. [DOI] [PubMed] [Google Scholar]
- 25. NHLBI Exome Sequencing Project (ESP). Exome Variant Server. NHLBI Web site. http://evs.gs.washington.edu/EVS/ . Accessed December 19, 2013.
- 26. Christodoulou DC, Gorham JM, Herman DS, Seidman JG. Construction of normalized RNA-seq libraries for next-generation sequencing using the crab duplex-specific nuclease. Curr Protoc Mol Biol. 2011. Chapter 4 : Unit4.12 . [DOI] [PMC free article] [PubMed] [Google Scholar]
- 27.Trapnell C, Pachter L, Salzberg SL. TopHat: discovering splice junctions with RNA-Seq. Bioinformatics. 2009;25(9):1105–1111. doi: 10.1093/bioinformatics/btp120. [DOI] [PMC free article] [PubMed] [Google Scholar]
- 28.Kuhn RM, Haussler D, Kent WJ. The UCSC genome browser and associated tools. Brief Bioinform. 2013;14(2):144–161. doi: 10.1093/bib/bbs038. [DOI] [PMC free article] [PubMed] [Google Scholar]
- 29.Robinson JT, et al. Integrative genomics viewer. Nat Biotechnol. 2011;29(1):24–26. doi: 10.1038/nbt.1754. [DOI] [PMC free article] [PubMed] [Google Scholar]
- 30.Audic S, Claverie JM. The significance of digital gene expression profiles. Genome Res. 1997;7(10):986–995. doi: 10.1101/gr.7.10.986. [DOI] [PubMed] [Google Scholar]
- 31.Ramirez-Gonzalez RH, Bonnal R, Caccamo M, Maclean D. Bio-samtools: Ruby bindings for SAMtools, a library for accessing BAM files containing high-throughput sequence alignments. Source Code Biol Med. 2012;7(1):6. doi: 10.1186/1751-0473-7-6. [DOI] [PMC free article] [PubMed] [Google Scholar]
- 32.Huang da W, Sherman BT, Lempicki RA. Systematic and integrative analysis of large gene lists using DAVID bioinformatics resources. Nat Protoc. 2009;4(1):44–57. doi: 10.1038/nprot.2008.211. [DOI] [PubMed] [Google Scholar]
- 33.Fujisawa G, Dilley R, Fullerton MJ, Funder JW. Experimental cardiac fibrosis: differential time course of responses to mineralocorticoid-salt administration. Endocrinology. 2001;142(8):3625–3631. doi: 10.1210/endo.142.8.8339. [DOI] [PubMed] [Google Scholar]
Associated Data
This section collects any data citations, data availability statements, or supplementary materials included in this article.