

Abstract
Lysosomal storage disorders (LSDs) occur at a frequency of 1 in every 5,000 live births and are a common cause of pediatric neurodegenerative disease. The relatively small number of patients with LSDs and lack of validated biomarkers are substantial challenges for clinical trial design. Here, we evaluated the use of a commercially available fluorescent probe, Lysotracker, that can be used to measure the relative acidic compartment volume of circulating B cells as a potentially universal biomarker for LSDs. We validated this metric in a mouse model of the LSD Niemann-Pick type C1 disease (NPC1) and in a prospective 5-year international study of NPC patients. Pediatric NPC subjects had elevated acidic compartment volume that correlated with age-adjusted clinical severity and was reduced in response to therapy with miglustat, a European Medicines Agency–approved drug that has been shown to reduce NPC1-associated neuropathology. Measurement of relative acidic compartment volume was also useful for monitoring therapeutic responses of an NPC2 patient after bone marrow transplantation. Furthermore, this metric identified a potential adverse event in NPC1 patients receiving i.v. cyclodextrin therapy. Our data indicate that relative acidic compartment volume may be a useful biomarker to aid diagnosis, clinical monitoring, and evaluation of therapeutic responses in patients with lysosomal disorders.
Introduction
Lysosomal storage disorders (LSDs) are a group of more than 60 inborn errors of metabolism that result in the expansion of the late endosomal/lysosomal (LE/Lys) compartment in cells (1–3). We therefore hypothesized that measuring relative LE/Lys volume could serve as a potentially universal biomarker for this family of disorders. To test this hypothesis, we developed an assay using the fluorescent probe Lysotracker, a weakly basic amine that selectively builds up in the acidic compartment (i.e., LE/Lys). This probe can be visualized and quantified in circulating cells and has previously been reported in a single clinical case study of a patient with adult-onset Niemann-Pick type C disease (NPC) (3). NPC1 is a progressive neurodegenerative LSD caused by mutations in either NPC1 or NPC2 (4). Diagnosis of NPC, which is technically challenging, is often delayed. There is currently 1 European Medical Association–approved disease-modifying therapy, miglustat, which is licensed for treating the CNS manifestations of NPC1, combined with symptomatic management (5, 6). At the time of the clinical trial of miglustat, there were no validated biomarkers for NPC that could be used as secondary endpoints in support of clinical data. Recently, oxysterols emerged as the first validated biochemical biomarker for NPC (7, 8).
In this study, we optimized the Lysotracker assay and validated it in a prospective study of more than 100 NPC patients derived from multiple independent clinical cohorts to ensure statistical power. We used this disorder as proof of concept for its use in other LSDs, due to the relatively large number of patients available to study with this specific lysosomal disorder. We applied this assay to small, resting, circulating B cells because they can readily be identified as a uniform population using the CD19 marker and do not change in response to infection. Circulating B cells are therefore a suitable cell type to analyze in longitudinal studies. We found here that this biomarker correlated with age-adjusted clinical severity scores and was responsive to miglustat therapy. It also correlated with levels of oxysterol (an NPC-specific biochemical biomarker; ref. 7) in the same patient samples. This biomarker also showed utility in monitoring response to bone marrow transplantation (BMT) in an NPC2 patient and identified an unanticipated adverse event in NPC patients receiving cyclodextrin therapy with i.v. 2-hydroxypropyl-β-cyclodextrin (HPβCD). Taken together, our data support the use of this biomarker in clinical monitoring of NPC. In addition, this assay has the potential to be a universal monitoring tool for any disease with lysosomal hypertrophy.
Results
Assay validation in a mouse model.
We first validated the assay in resting B cells (splenic and circulating) from Npc1–/– mutant mice using the minimal group size to provide statistically valid results with enough power (in this case, 3 mice per group per time point). We quantified Lysotracker fluorescence — calibrated using fluorescent microbead standards and expressed as mean equivalent of fluorescence (MEFL) — and observed a progressive increase in relative acidic compartment volume (Figure 1, A and B). This expansion of LE/Lys was seen at all ages compared with age-matched controls and was highly significant at each time point in both splenic and circulating B cells (P < 0.001). We have previously shown that B cells from Npc1–/– store high levels of glycosphingolipids (GSLs) when measured by HPLC (9). A key finding was that peripheral B cell storage, as indicated by MEFL, paralleled progressive ganglioside and lactosylceramide storage in the brain, as measured by HPLC (Figure 1, C and D), which indicates that the rate of storage in B cells in the periphery parallels storage in the CNS. The probe LipidTOX, which detects phospholipid storage, detected phospholipids in control and Npc1–/– B cells, but did not show enhanced staining in Npc1–/– relative to wild-type B cells (Supplemental Figure 1B; supplemental material available online with this article; doi: 10.1172/JCI72835DS1), and thus was not further evaluated.
Figure 1. Relative LE/Lys volume increases progressively in B cells in a mouse model of NPC1 disease and parallels the rate of GSL storage in the brain.

(A and B) Splenic (A) and circulating (B) B cells were analyzed by flow cytometry over the lifespan of the Npc1–/– mouse (3 weeks, presymptomatic; 6 weeks, early symptomatic; 9 weeks, late symptomatic) and compared with wild-type Npc1+/+ controls. A pan–B cell marker was detected using an anti-CD19 monoclonal antibody conjugated to PE, and cells were costained with Lysotracker green. Analysis was performed on gated B cells (CD19+), and Lysotracker staining levels were standardized to fluorescent microbeads conjugated to defined numbers of fluorescent molecules/bead to linearize the logarithmic data collected by the cytometer. There was progressive elevation in B cell MEFL at each time point relative to the previous age point (P < 0.01, spleen, all ages, and blood, 6 and 9 weeks). (C and D) GSL analysis, performed by HPLC, of GM2 ganglioside (C) and lactosylceramide (D) in the forebrain of 2-, 4-, 7-, and 9-week-old Npc1–/– mice compared with wild-type controls. **P < 0.01; ***P < 0.001.
Assay validation in patient blood samples.
The Lysotracker assay was then applied to peripheral blood B cells from NPC patients. Although this assay would in practice be used for monitoring individual patients over time, we had the opportunity here to evaluate this biomarker at the population level. We found that MEFL values were significantly elevated in B cells from the majority of pediatric NPC1 patients (aged 0–12 years; P < 0.001; Figure 2A); only 4 cases in the 0–6 year age range and 6 cases in the 7–12 year age range overlapped with control values. 2 infantile Tay-Sachs disease patients also had elevated levels of MEFL above the age-matched control range. The youngest NPC1 subjects with significant clinical manifestations had the highest MEFL values (P < 0.05, 0–6 years vs. 13–18 years; P < 0.01, 0–6 years vs. ≥19 years). In contrast, the adult NPC1 patients (with later onset and slower disease progression) and the heterozygous carriers did not differ significantly from age-matched controls at the population level (Figure 2A).
Figure 2. Relative LE/Lys volume identifies pediatric patients with NPC1 disease.

Data were collected prospectively on NPC1 patients (n = 97, aged 2 months to 53 years), heterozygous carriers (NPC Het; n = 40, aged 23 to 76 years), age-matched controls (n = 53, aged 4 months to 64 years), and 2 pediatric patients with Tay-Sachs disease (TS). (A) Lysotracker values from circulating B cells were measured by flow cytometry and plotted against patient age. Each patient only appears once, standardized to the first sample analyzed for each patient. ***P < 0.01. (B) When the same patients’ data were plotted as unadjusted severity score (with higher value denoting greater disease burden) against age, multiple subgroups were identified. These were designated according to decreasing severity, from the severest (subgroup a) to the mildest (subgroup f). Rate of change per year is indicated for each subgroup. (C) Total severity score (without hearing, as this was not measured by all clinical centers) for each patient was divided by patient age to generate ASIS. When plotted against MEFL, a statistically significant correlation was found (P = 0.017). (D) When each patient’s plasma cholestane-3β,5α,6β-triol level was plotted against their MEFL value, a statistically significant correlation was observed in all patients (P < 0.01). A piecewise linear model significantly improved the goodness-of-fit with respect to a single linear model (P < 0.001); in this model, the initial slope was significant (P = 0.015), and the second was not (P = 0.228), with the estimated change point being 21,269 MEFL.
Characterization of the study cohort.
To better characterize the study cohort, clinical severity scores (for which higher scores denote increasing severity; ref. 10) were plotted against patient age. Hearing was excluded, as it was not measured in all clinical centers. There was no simple linear or nonlinear model that adequately represented the complete data distribution (Supplemental Figure 2). We therefore looked for discrete subpopulations of patients and identified 6 subgroups (denoted a–f), with subgroups b, c, and d defined by latent class mixture modeling (Figure 2B). The study cohort included miglustat-treated patients, which were represented in all 6 subgroups (Supplemental Figures 3 and 4). Seizures are a common feature in the most severely affected patients; consistent with this, patients with seizures were almost exclusively present in subgroups a–c (Supplemental Figure 5). When a small number of untreated patients were plotted longitudinally, they remained within the same subgroup (Supplemental Figure 6), which suggests that these subgroups may have prognostic value. When MEFL values were plotted against total clinical severity score, no significant correlation was observed in the group as a whole or in subgroups a–f (data not shown). As disease progression has been reported to be linear in NPC disease (10), and different patients achieved their severity scores over variable numbers of years (Figure 2B), total severity scores were divided by age to give an annual severity increment score (ASIS). When ASIS was plotted against MEFL, a significant correlation was observed for the total NPC1 population (P = 0.017; Figure 2C), but not after stratifying by latent subgroups a–f, as these were individually underpowered (data not shown).
Relationship to oxysterols.
Oxysterols have been validated as NPC-specific biochemical biomarkers (7, 8). We therefore measured cholestane-3β,5α,6β-triol and MEFL in matched plasmas and found a significant correlation in NPC1 patients (P = 0.015), but not in controls or heterozygous carriers (Figure 2D).
Response to treatment with miglustat.
Longitudinal data were collected on 38 patients that were untreated, chronically treated with miglustat (>6 months; ref. 5), or analyzed both before and after miglustat therapy, with the first point being pretreatment (referred to herein as pre-post analysis) (Table 1). There were no significant differences in median ages for the 3 groups (P = 0.09). Of the untreated patients, 86% had positive slopes (progression of storage), compared with 71% in the chronically miglustat-treated group and 43% in the pre-post group (Table 1 and Figure 3). Untreated adult controls (variable MEFL values) with repeat measures were analyzed, and no significant slopes were detected (Figure 3 and Supplemental Figure 7).
Table 1.
Miglustat treatment slows the rate of storage in NPC1 patients
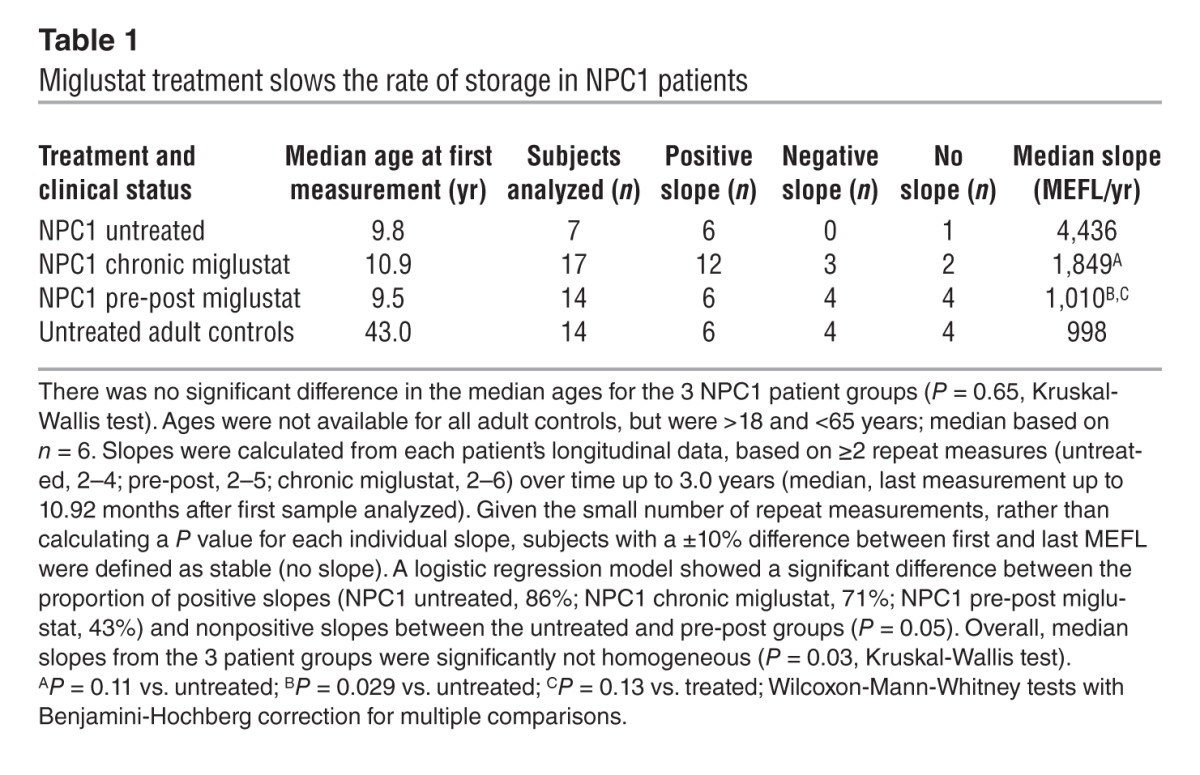
Figure 3. Miglustat treatment reduces lysosomal storage in NPC1 patients’ B cells.

Box plots summarizing progression of storage for untreated (n = 7), chronic miglustat (n = 17), and pre-post miglustat (n = 14) patient groups as well as adult controls (n = 14) analyzed over time. The box is limited by the 1st and 3rd quartiles (Q1 and Q3), and the median is indicated by a bar inside the box; whiskers and outliers are defined in terms of 2 unmarked boundaries defined using Tukey’s rule as Q1 – 1.5 IQR and Q3 + 1.5 IQR (IQR, interquartile range, i.e., Q3 – Q1). Whiskers extend to the smallest and largest observed values within the boundaries, and outliers are defined as points outside the boundaries. Adjusted pairwise multiple comparisons are shown (Wilcoxon-Mann-Whitney test). See Table 1 and Supplemental Figure 7.
Response to BMT in an NPC2 patient.
An NPC2 patient was analyzed before and after BMT. Prior to BMT (and before immunosuppressive conditioning), the patient’s MEFL value approximated the average for NPC1 patients of a similar age (Figure 4A). At 1 month after BMT, the B cell MEFL was reduced, and by 3 months after BMT, it had moved into the control range (Figure 4A), suggestive of cross correction and/or cell replacement with donor cells. At this point, 2 equally abundant (50:50) subpopulations of B cells were detected, which were classified as high or low MEFL staining (Figure 4A). This coincided with the development of 50% donor chimerism, based on human leukocyte analysis (data not shown).
Figure 4. Relative LE/Lys volume is a sensitive measure of response and potentially adverse response to NPC disease therapeutics.

(A) Pre-post analysis of an NPC2 patient with BMT, using Lysotracker analysis of circulating B cells. MEFL was reduced 1 month after BMT, and by 3 months was within the pediatric control range. At 3 months after BMT, donor chimerism developed and was detected by the presence of 2 B cell populations (inset; gated on mononuclear cells). The populations had high or low Lysotracker fluorescence, with a 50:50 distribution of B cells between the 2 populations. HLA typing confirmed the development of 50% donor chimerism (not shown). (B) 7 patients on HPβCD therapy (individual use INDs) were analyzed. Patients 1–4 were analyzed pre-post i.v. HPβCD (arrows denote therapy initiation points), patients 5 and 6 were analyzed after HPβCD only, and patient 7 was analyzed pre-post intrathecal HPβCD delivery (no i.v. administration throughout the treatment period). (C) B cells isolated from the blood of patients 1–4 were analyzed to determine their levels of GSL storage. Total GSL levels were compared before and after HPβCD delivery for each patient and plotted individually (blue; error bars derived from 3 independent HPLC analytical runs of the same samples). An average of the 4 patients was also plotted (green; error bars derived from the mean values for each patient). *P < 0.05; ***P < 0.001.
Unanticipated potential adverse response to HPβCD treatment.
Finally, we investigated the effects of HPβCD therapy on B cell MEFL, both pre-post i.v. HPβCD therapy in 4 pediatric NPC1 patients (patients 1–4) and after i.v. HPβCD therapy in 2 additional individuals (patients 5 and 6); all 6 were being treated under individual patient Investigational New Drug (IND) provisions (Figure 4B). In patients 1–4, pre-post analysis showed a dramatic increase in B cell MEFL values in response to HPβCD treatment, with patients 1–3 exceeding the NPC patient range. Analysis of patients 5 and 6 after HPβCD therapy showed MEFL values similar to those of patients 1–3. In patients 1–4, B cells were isolated, and all 4 had increased levels of GSL storage after HPβCD treatment (Figure 4C). We also analyzed a single patient pre-post approximately 1 year of intrathecal HPβCD therapy (patient 7). Despite being well managed on miglustat, with a MEFL value in the normal pediatric range prior to intrathecal HPβCD treatment, patient 7 also showed increased MEFL values in response to HPβCD, albeit not as great as those in patients 1–6 with i.v. administration (Figure 4B).
Discussion
In addition to disease-specific biomarkers (7), it would be useful to have a general biomarker for measuring the degree of storage in all lysosomal disorders, regardless of the biochemical nature of the stored macromolecule(s). We therefore selected the probe Lysotracker to study, as it measures relative acidic compartment volume in live cells. An increased Lysotracker value could reflect lysosome enlargement, increased number of lysosomes, or both.
We first validated this assay in Npc1–/– mutant mice and found that the rate of storage in the brain and circulating B cells mirrored each other; thus, measuring storage in circulating B cells is a suitable surrogate for measuring progression of storage in the brain. This suggests that although absolute amounts of lipid storage differ in different cell types in NPC, the rate of storage is similar in different tissues as disease progresses, so the use of peripheral biomarkers is still informative and also minimally invasive for patients.
We then applied this assay to a multicenter, international prospective study of 106 NPC patients, spanning a 5-year period. To our knowledge, this is the largest prospective study ever undertaken in a neurodegenerative lysosomal disorder. Typically, biomarker validation involves analysis of multiple independent clinical cohorts, each of sufficient size to provide sufficient statistical power, in order to draw conclusions about the biomarker’s practical utility. In the case of a rare lysosomal disease such as NPC, this is clearly not possible, due to small patient numbers. Instead, we combined patients from 3 independent clinical cohorts from 3 countries to sufficiently power this study. Although this biomarker would be used in practice at the individual patient level, in the present study we began with population-based analysis to define the study cohort. We found that the clinical severity of the total NPC study cohort spanned the severity range, and additionally revealed 6 discrete subgroups with differential rates of disease progression. Individual untreated patients longitudinally tracked an individual subgroup, which suggests that simply plotting total severity against age may have prognostic value, particularly in patients older than 5 years.
At the population level, the clear finding was that pediatric NPC patients had significantly elevated levels of Lysotracker staining in circulating B cells, minimally overlapping those of age-matched controls. Similar findings were made in 2 18-month-old Tay-Sachs disease patients compared with pediatric controls 0–6 years of age. As lysosomal hypertrophy is a universal feature of LSDs, it is logical to hypothesize, based on our data in more than 100 NPC1 patients and 2 Tay-Sachs patients, that relative LE/Lys volume could represent a universal biomarker for lysosomal disorders. The trend in NPC1 patients was for older patients to have lower average MEFL values at the population level than pediatric NPC1 patients, implying a milder disease burden in older patients, as might be predicted. In contrast, the controls had a very tight distribution in pediatric individuals, which broadened over time to a diverse range of values in the adult group. This may suggest that some individuals develop impaired lysosomal flux as they age, leading to an expansion of the lysosomal system. There was no simple age relationship, which suggests that this is not an inevitable consequence of aging. Alternatively, an expanded lysosomal system in some adults in the general population may reflect an increased rate of substrate flux through the lysosomal compartment. This unexpected observation merits further investigation in the general population in order to better understand its basis and potential clinical significance.
However, the Lysotracker assay was useful in adults for monitoring individual changes over time, with patients serving as their own controls (Table 1 and ref. 3). As the biomarker would be used in clinical practice for monitoring individual patients over time, not for population-based studies, this underscores its practical utility. When Lysotracker was compared with the NPC disease-specific oxysterol biochemical biomarker, there was a significant correlation with patients with lower MEFL values. Interestingly, a subset of patients with very high Lysotracker values did not have the predicted high level of triol species (assuming a linear relationship), suggestive of potentially attenuated oxidative stress responses in these individuals and highlighting the need to use multiple biomarkers in NPC. Control and heterozygous carriers could be distinguished on the basis of mildly elevated oxysterol levels, whereas Lysotracker values overlapped between these 2 genotypes.
We calculated ASIS and found it to be significantly correlated with relative lysosomal volume. Scoring with ASIS may also represent a simple tool for stratifying patients for clinical trials or for monitoring disease progression. As the severity score used to calculate ASIS is derived from multiple neurological clinical measures (10), these data, in agreement with our findings in the Npc1–/– mouse (Figure 1), are suggestive of an association between storage in the CNS and in the hematopoietic system. Therefore, monitoring B cell lysosomal volume is a valid minimally invasive surrogate for storage levels in the CNS in NPC. These data also suggest that human B cell progenitors store progressively, such that this is reflected in the mature circulating B cell population, as the half-life of B cells in the blood is only 36 days (11). Most untreated NPC patients had increased relative lysosomal volumes over time, but significant decreases were observed in the miglustat-treated groups, consistent with miglustat stabilizing/slowing the rate of disease progression in NPC1 patients (5, 12–14). Patients in whom pre-post analysis was performed exhibited the most marked decrease in storage, relative to the chronically miglustat treated group, which was relatively stable at the initiation of the study.
We also investigated the effects of 2 experimental therapies on this biomarker. NPC2 constitutes 5% of NPC cases (15) and is appropriate for BMT, as the NPC2 protein is a soluble, mannose-6-phosphorylated protein amenable to secretion/recapture cross-correction (16, 17). The efficacy of BMT was recently reported in an NPC2 patient (18). We therefore monitored an NPC2 patient pre-post BMT, and this biomarker revealed reduced storage in peripheral B cells after BMT (cross-correction at the early time point) and detected donor chimerism at 3 months after BMT. Before BMT, the patient was declining, with symptoms of respiratory compromise, ataxia, and slowed development of speech. After BMT, these symptoms improved, preceded by reduced Lysotracker staining. When symptoms returned and repeat transplant was under consideration, Lysotracker values increased before the onset of clinical deterioration, which suggests that this may be a sensitive biomarker for NPC2 disease.
HPβCD is an experimental drug that has shown benefit in mouse and feline models of NPC1 (19, 20), potentially by stimulating lysosomal exocytosis, which has been demonstrated in vitro (21). There are currently 10 NPC1 patients worldwide undergoing i.v. HPβCD therapy, of which 7 were included in this study. Patients previously treated with miglustat (patients 1–4 and 7; ref. 5) had reduced MEFL values, close to or within the normal range, prior to initiation of HPβCD therapy. Paradoxically, after HPβCD therapy, there was a pronounced increase in B cell Lysotracker fluorescence. Patients 1–6, with i.v. exposure to the drug, developed elevated MEFL values that were similar to one another; all but 1 were above the upper limit of the general NPC1 patient population. Patient 7 never received HPβCD i.v.; the drug was only administered intrathecally. However, even this individual showed elevated MEFL values after approximately 1 year of HPβCD treatment. The magnitude of this increase was less than in patients receiving i.v. HPβCD. These data suggest that intrathecal HPβCD treatment resulted in exchange of HPβCD into the peripheral circulation, which was sufficient to lead to an increase in B cell MEFL values. This assay may serve as a useful surrogate of systemic exposure to HPβCD treatment, regardless of the route of administration. We then investigated whether the increased MEFL values we observed after HPβCD treatment reflected enhanced lipid storage in response to HPβCD. When B cells from a subset of the patients were isolated and analyzed biochemically, GSL levels were higher than at the start of HPβCD therapy, suggestive of storage lipid redistribution to B cells in response to HPβCD. These data suggest that direct CNS delivery of HPβCD may be needed to minimize potential peripheral side effects, although even the patient receiving intrathecal drug (patient 7) showed elevated levels, albeit to a lesser extent than those receiving i.v. HPβCD.
The main findings of this study are summarized in Figure 5, including differential responses to therapies. Taken together, and based on lysosomal hypertrophy being a universal hallmark of LSDs, our present findings suggest that this biomarker may have broad utility as an aid to initial diagnosis (suspicion of an LSD), for monitoring disease progression in multiple LSDs, and for determining their differential responses to therapies. It remains to be determined whether this peripheral blood biomarker will be applicable in milder LSDs or in LSDs involving storage restricted to highly specialized cell types. Clinical studies are planned to test this prospectively in a range of lysosomal disorders to determine clinical utility more broadly.
Figure 5. Summary of major findings in the study.

Methods
NPC1 mice.
BALB/cNctr-Npc1m1N/J (Jackson Laboratory) mice (termed Npc1–/–) were maintained by heterozygote brother/sister matings and genotyped as previously described (22). The Npc1–/– mouse has a lifespan of 10–12 weeks, with neurological symptoms presenting at approximately 6 weeks of age. Mice were group housed in ventilated cages with irradiated food and bedding and autoclaved water available ad libitum. Control mice were Npc1+/+ mice generated from the same litters as the Npc1–/– animals. Blood and spleens were harvested from PBS-perfused mice under terminal anesthesia and analyzed for flow cytometry or biochemical analysis as previously described (9).
Clinical study cohort.
The 106 total NPC patients in this study were from multiple independent international clinical cohorts from the United Kingdom, Germany, and the United States (29, 30, and 47 patients, respectively). A further 6 NPC1 patients treated with HPβCD were also studied (in addition to 1 patient on HPβCD therapy that was part of the US cohort, giving a total of 7 NPC1 patients on HPβCD treatment that were analyzed). The study cohort was composed of 52 untreated patients, 54 patients on miglustat at time of first analysis, 41 heterozygous carriers, and 53 age-matched controls. There was no standardization between centers relating to the stage of disease when miglustat therapy was initiated, although dosing was standardized according to current clinical guidelines (23). In a subset of patients, treatment was initiated during the study, allowing for pre-post analysis of miglustat therapy. Longitudinal data was not collected on pediatric controls, only on adult heterozygous carriers and adult healthy volunteers.
We also studied a pair of twins with infantile-onset Tay-Sachs, who died of disease progression at 3 years of age. Analysis was performed at 16 months of age, at which time they had been on off-label miglustat therapy for 5 months.
HPβCD-treated patients.
Patients 1 and 2 were started on i.v. HPβCD in April 2009 and dose escalated to 2,500 mg/kg, administered weekly. These 2 patients were also receiving, by lumbar intrathecal injection, 175 mg HPβCD every 2 weeks starting in October 2010. Patient 3 and 4 were started on i.v. HPβCD in December 2010 and April 2011, respectively. They were dose escalated to 2,000 mg/kg, administered weekly. Patients 5 and 6 were started on i.v. HPβCD in January 2010 and started on intrathecal HPβCD in May 2010. At the time of blood sampling, they were receiving i.v. HPβCD at a dose of 2,900 mg/kg twice per week and intrathecal HPβCD at a dose of 875 mg every 2 weeks. Patient 7 was on oral miglustat therapy (2 years) prior to commencing intrathecal HPβCD and remained on miglustat throughout HPβCD treatment. Patient 7 was treated with HPβCD every 15 days and commenced with 175 mg HPβCD that was increased in single-dose steps (175, 250, 300, and 350 mg) up to a maintenance dose of 400 mg. Initially, this patient received all HPβCD doses through lumbar puncture with i.v. sedation; for the last 6 months of the study, HPβCD was delivered via an Ommaya intrathecal reservoir.
BMT of an NPC2 patient.
The NPC2 patient presented as a neonate with hepatosplenomegaly and dysmorphic features. She developed progressive neurodevelopmental delay and unexplained pulmonary disease. At 14 months of age, NPC2 was diagnosed based on filipin staining of skin fibroblasts and mutational analysis. 1 known NPC2 mutation was identified with no second mutation found, with intronic regions yet to be sequenced. The patient was deteriorating, and so BMT was performed at 18 months of age using an unaffected sibling donor, as efficacy had recently been reported in another NPC2 case after BMT (18). Pre-BMT sampling and analysis in this study was performed prior to conditioning with immunosuppressive drugs. She initially made a good recovery; however, donor chimerism developed after the initial response (reduced MEFL value), and she clinically declined after 6 months. She was given a repeat transplant 9 months after the initial BMT from the same donor and fully engrafted, leading to clinical improvement. At the end of the present study, the patient was stable and under continuous review.
Human blood collection and isolation of mononuclear cells.
Venous blood was collected into EDTA tubes, maintained at room temperature, and analyzed within 72 hours (optimal for maintaining cell viability; data not shown). Consent or assent was obtained from all subjects, with ethical approval in place in each clinical center. Control samples were obtained by voluntary donation with informed consent, or from a commercial provider where informed consent/assent was given at the time of collection. The investigators were blinded to patient identity. Whole blood was loaded onto Histopaque-1077 (Sigma-Aldrich), and mononuclear cells were isolated according to the manufacturer’s instructions. The mononuclear fraction was washed twice with Dulbecco PBS (D-PBS) before counting.
Flow cytometry.
Mononuclear cells (1 × 10⁶, in duplicate) were incubated with PE-conjugated mouse anti-human CD19 antibody (clone LT19; Abcam) in D-PBS for 30 minutes on ice in the dark. The reaction was stopped with 100 μl 10% BSA, and cells were spun (5 minutes at 800 g), then either resuspended in 0.5 ml FACS buffer (0.1% BSA, 0.02M NaN3 in 1× PBS) or stained with 1 ml of 200 nM Lysotracker-green DND-26 (Invitrogen) in D-PBS for 10 minutes in the dark at room temperature. Cells were centrifuged for 5 minutes at 800 g, resuspended in 0.5 ml FACS buffer, and kept on ice for a maximum of 1 hour prior to flow cytometric analysis (BD Biosciences FACSCanto II). The cytometer was calibrated using Cytometer Setup and Tracking beads (BD), and compensation was performed using cells stained with Lysotracker and anti-mouse CompBeads (BD) stained with PE antibody using FACSDiva software (BD). Samples were acquired with gating on singlets (FSC-H versus FSC-A) and CD19+ events. In total, 50,000 singlet events and 10,000 singlet gate CD19+ events were collected. The mean fluorescence of the CD19+ events was calculated using FACSDiva software (BD). MEFL was calculated using 8-peak Rainbow calibration beads (BD) using the fluorescein equivalent values provided by the manufacturer. See Supplemental Figure 8 for details of FACS profile and analysis.
HPLC analysis.
HPLC analysis of GSLs was performed according to previously published methods (24).
Oxysterol measurements.
The methodology was according to published protocols (8). Lysotracker and oxysterol measurements were performed on the same clinical samples for each data point.
Statistics.
Logistic regression models were used to compare proportions, Wilcoxon-Mann-Whitney and Kruskal-Wallis tests were used to compare medians, and ANOVA was used to compare means. Linear regression models (including those with splines) were fitted with maximum likelihood methods; nonlinear regression models were fitted using least squares methods. Latent class finite mixture regression models were fitted using the R package flexmix (25) to define components of total clinical score as a function of age; the number of components was chosen by minimizing the Bayesian Information Criterion. Piecewise linear regression models were fitted using the R package SiZer (26). Adjusted P values for pairwise comparisons were obtained using the Benjamini-Hochberg correction (27). All calculations were performed in the R language and environment for statistical computing (version 2.14.2; http://www.R-project.org). Graphs with error bars represent mean ± SD. A P value less than 0.05 was considered significant.
Study approval.
All animal studies were approved by the UK Home Office for the conduct of regulated procedures under licence (Animal Scientific Procedures Act, 1986). Studies of NPC patients from the UK (06/MRE02/85), Germany (S-032/2012), and the United States (06-CH-0186) were approved by the appropriate REC/IRB. Patient 7 in the HPβCD study was covered by ethics approval TRT585600308651 (Madrid, Spain). Written informed consent and, if applicable, assent were obtained.
Supplementary Material
Acknowledgments
We thank the patients and their families for participating in this study, members of the University of Oxford Department of Pharmacology for control blood donations, and our control pediatric blood sample donors. We also thank the Hadley Hope Foundation for funding control blood draws from anonymous pediatric and adult donors through a commercial provider in the United States. The flow cytometer was funded by The Wellcome Trust (084631). D. te Vruchte was supported by Action Medical Research (SP4203 and SP3775), with interim and additional support from the Niemann-Pick Disease Group UK and unrestricted educational grants from Actelion. A.O. Speak was funded by the UK Medical Research Council (MRC; GO700851). D.A. Smith was supported by SOAR-NPC and the Niemann-Pick Research Foundation (NPRF). N. Al Eisa was supported by King Saud bin Abdulaziz University for Health Sciences and the Ministry of Higher Education, Kingdom of Saudi Arabia. This work was supported in part by the intramural research program of the Eunice Kennedy Shriver National Institute of Child Health and Human Development and a Bench to Bedside grant supported by the Office of Rare Diseases and NIH Clinical Center (to F.D. Porter). N.M. Yanjanin was supported by Ara Parseghian Medical Research Foundation (APMRF) and Dana’s Angels Research Trust (DART). The University College London Institute of Child Health receives a portion of its funding from the Department of Health’s NIH Research Biomedical Research Centres funding scheme. M. Cortina-Borja’s work on this study was undertaken at the Centre for Paediatric Epidemiology and Biostatistics at University College London, which benefits from funding support from the MRC in its capacity as the MRC Centre of Epidemiology for Child Health (supported by MRC grant G0400546). F.M. Platt is a Royal Society Wolfson Research Merit Award holder. We dedicate this manuscript to the memory of our colleague and greatly missed friend, Ed Wraith.
Footnotes
Conflict of interest: Michael Beck receives unrestricted grants, travel support, and honoraria from Genzyme, Shire, Biomarin, and Actelion. Forbes D. Porter receives speaker honoraria, consultancy, and unrestricted grants from Actelion. Christian J. Hendriksz receives unrestricted grants, research agreements, travel support, and/or honoraria from Genzyme, Shire, Biomarin, Synegeva, GlaxoSmithKline, Amicus, and Actelion. Eugen Mengel and Frances M. Platt receive speaker fees, research grants, and consultant fees from Actelion.
Citation for this article: J Clin Invest. 2014;124(3):1320–1328. doi:10.1172/JCI72835.
References
- 1.Heard JM, Bruyere J, Roy E, Bigou S, Ausseil J, Vitry S. Storage problems in lysosomal diseases. Biochem Soc Trans. 2010;38(6):1442–1447. doi: 10.1042/BST0381442. [DOI] [PubMed] [Google Scholar]
- 2.Wraith JE. Lysosomal disorders. Semin Neonatol. 2002;7(1):75–83. doi: 10.1053/siny.2001.0088. [DOI] [PubMed] [Google Scholar]
- 3.Lachmann RH, et al. Treatment with miglustat reverses the lipid-trafficking defect in Niemann-Pick disease type C. Neurobiol Dis. 2004;16(3):654–658. doi: 10.1016/j.nbd.2004.05.002. [DOI] [PubMed] [Google Scholar]
- 4.Vanier MT. Niemann-Pick disease type C. Orphanet J Rare Dis. 2010;5:16. doi: 10.1186/1750-1172-5-16. [DOI] [PMC free article] [PubMed] [Google Scholar]
- 5.Patterson MC, Vecchio D, Prady H, Abel L, Wraith JE. Miglustat for treatment of Niemann-Pick C disease: a randomised controlled study. Lancet Neurol. 2007;6(9):765–772. doi: 10.1016/S1474-4422(07)70194-1. [DOI] [PubMed] [Google Scholar]
- 6.Patterson MC, Hendriksz CJ, Walterfang M, Sedel F, Vanier MT, Wijburg F. Recommendations for the diagnosis and management of Niemann-Pick disease type C: An update. Mol Genet Metab. 2012;106(3):330–344. doi: 10.1016/j.ymgme.2012.03.012. [DOI] [PubMed] [Google Scholar]
- 7.Porter FD, et al. Cholesterol oxidation products are sensitive and specific blood-based biomarkers for Niemann-Pick C1 disease. Sci Transl Med. 2011;2(56):56ra81. doi: 10.1126/scitranslmed.3001417. [DOI] [PMC free article] [PubMed] [Google Scholar]
- 8.Jiang X, et al. A sensitive and specific LC-MS/MS method for rapid diagnosis of Niemann-Pick C1 disease from human plasma. J Lipid Res. 2011;52(7):1435–1445. doi: 10.1194/jlr.D015735. [DOI] [PMC free article] [PubMed] [Google Scholar]
- 9.te Vruchte D, Jeans A, Platt FM, Sillence DJ. Glycosphingolipid storage leads to the enhanced degradation of the B cell receptor in Sandhoff disease mice. J Inherit Metab Dis. 2010;33(3):261–270. doi: 10.1007/s10545-010-9109-3. [DOI] [PMC free article] [PubMed] [Google Scholar]
- 10.Yanjanin NM, et al. Linear clinical progression, independent of age of onset, in Niemann-Pick disease, type C. Am J Med Genet B Neuropsychiatr Genet. 2010;153B(1):132–140. doi: 10.1002/ajmg.b.30969. [DOI] [PMC free article] [PubMed] [Google Scholar]
- 11.Macallan DC, et al. B-cell kinetics in humans: rapid turnover of peripheral blood memory cells. Blood. 2005;105(9):3633–3640. doi: 10.1182/blood-2004-09-3740. [DOI] [PubMed] [Google Scholar]
- 12.Chien YH, et al. Long-term efficacy of miglustat in paediatric patients with Niemann-Pick disease type C. J Inherit Metab Dis. 2013;36(1):129–137. doi: 10.1007/s10545-012-9479-9. [DOI] [PubMed] [Google Scholar]
- 13.Di Rocco M, Dardis A, Madeo A, Barone R, Fiumara A. Early miglustat therapy in infantile niemann-pick disease type C. Pediatr Neurol. 2012;47(1):40–43. doi: 10.1016/j.pediatrneurol.2012.04.005. [DOI] [PubMed] [Google Scholar]
- 14.Patterson MC, et al. Long-term miglustat therapy in children with Niemann-Pick disease type C. J Child Neurol. 2010;25(3):300–305. doi: 10.1177/0883073809344222. [DOI] [PubMed] [Google Scholar]
- 15.Vanier MT. [Niemann-Pick C disease: history, current research topics, biological and molecular diagnosis]. Arch Pediatr. 2010;17(suppl 2):S41–S44. doi: 10.1016/S0929-693X(10)70010-5. [DOI] [PubMed] [Google Scholar]
- 16.Willenborg M, et al. Mannose 6-phosphate receptors, Niemann-Pick C2 protein, and lysosomal cholesterol accumulation. J Lipid Res. 2005;46(12):2559–2569. doi: 10.1194/jlr.M500131-JLR200. [DOI] [PubMed] [Google Scholar]
- 17.Storch J, Xu Z. Niemann-Pick C2 (NPC2) and intracellular cholesterol trafficking. Biochim Biophys Acta. 2009;1791(7):671–678. doi: 10.1016/j.bbalip.2009.02.001. [DOI] [PMC free article] [PubMed] [Google Scholar]
- 18. Bonney DK, et al. Successful allogeneic bone marrow transplant for Niemann-Pick disease type C2 is likely to be associated with a severe ‘graft versus substrate’ effect. J Inherit Metab Dis. 2010. 33 suppl 171 173 . 10.1007/s10545-010-9060-3 [DOI] [PubMed] [Google Scholar]
- 19.Davidson CD, et al. Chronic cyclodextrin treatment of murine Niemann-Pick C disease ameliorates neuronal cholesterol and glycosphingolipid storage and disease progression. PLoS One. 2009;4(9):e6951. doi: 10.1371/journal.pone.0006951. [DOI] [PMC free article] [PubMed] [Google Scholar]
- 20.Stein VM, et al. Miglustat improves purkinje cell survival and alters microglial phenotype in feline Niemann-Pick disease type C. J Neuropathol Exp Neurol. 2012;71(5):434–448. doi: 10.1097/NEN.0b013e31825414a6. [DOI] [PMC free article] [PubMed] [Google Scholar]
- 21.Chen FW, Li C, Ioannou YA. Cyclodextrin induces calcium-dependent lysosomal exocytosis. PLoS One. 2010;5(11):e15054. doi: 10.1371/journal.pone.0015054. [DOI] [PMC free article] [PubMed] [Google Scholar]
- 22.Loftus SK, et al. Murine model of Niemann-Pick C disease: mutation in a cholesterol homeostasis gene. Science. 1997;277(5323):232–235. doi: 10.1126/science.277.5323.232. [DOI] [PubMed] [Google Scholar]
- 23.Wraith JE, et al. Recommendations on the diagnosis and management of Niemann-Pick disease type C. Mol Genet Metab. 2009;98(1–2):152–165. doi: 10.1016/j.ymgme.2009.06.008. [DOI] [PubMed] [Google Scholar]
- 24.Neville DC, et al. Analysis of fluorescently labeled glycosphingolipid-derived oligosaccharides following ceramide glycanase digestion and anthranilic acid labeling. Anal Biochem. 2004;331(2):275–282. doi: 10.1016/j.ab.2004.03.051. [DOI] [PubMed] [Google Scholar]
- 25.Grün B, Leisch F. Fitting finite mixtures of generalized linear regressions in R. Comput Stat Data Anal. 2007;51(11):5247–5252. doi: 10.1016/j.csda.2006.08.014. [DOI] [Google Scholar]
- 26.Sonderegger DL, Wang H, Clements WH, Noon BR. Using SiZer to detect thresholds in ecological data. Front Ecol Environ. 2009;7:190–195. doi: 10.1890/070179. [DOI] [Google Scholar]
- 27.Benjamini Y, Hochberg Y. Controlling the false discovery rate: a practical and powerful approach to multiple testing. J R Stat Soc Series B Stat Methodol. 1995;57(1):289–300. [Google Scholar]
Associated Data
This section collects any data citations, data availability statements, or supplementary materials included in this article.