

Abstract
Using the Illumina 450K array and a stringent statistical analysis with age and gender correction, we report genome-wide differences in DNA methylation between pathology-free regions derived from human multiple sclerosis–affected and control brains. Differences were subtle, but widespread and reproducible in an independent validation cohort. The transcriptional consequences of differential DNA methylation were further defined by genome-wide RNA-sequencing analysis and validated in two independent cohorts. Genes regulating oligodendrocyte survival, such as BCL2L2 and NDRG1, were hypermethylated and expressed at lower levels in multiple sclerosis–affected brains than in controls, while genes related to proteolytic processing (for example, LGMN, CTSZ) were hypomethylated and expressed at higher levels. These results were not due to differences in cellular composition between multiple sclerosis and controls. Thus, epigenomic changes in genes affecting oligodendrocyte susceptibility to damage are detected in pathology-free areas of multiple sclerosis–affected brains.
Multiple sclerosis is an inflammatory disease of the CNS occurring in 0.1% of the population and with a complex, as yet not completely understood pathogenic mechanism. Large-scale genome-wide association studies (GWAS) have been used to identify susceptibility loci1–3. However, the odds ratio for individual SNPs are relatively low and the risk allele frequency is variable across the loci2. This observation, together with the relatively low concordance rate in monozygotic twins, the presence of a strong gender bias, the geographical distribution of incidence and the influence of migration on disease onset4, has suggested the importance of epigenetic changes in modulating disease susceptibility and its course.
Epigenetics defines the persistent modulation of gene expression in a manner that is not dependent on changes in DNA sequence and is a term that is widely used to describe mechanisms of transcriptional and translational regulation within the cell. It includes the study of modifications of DNA nucleotides (for example, methylation), post-translational modifications of lysine and arginine residues in the tail of nucleosomal histones, and microRNAs. Epigenetic changes are cell- and tissue-specific and allow selective gene expression in different organs by modulating the specialized expression of transcriptional programs, even though all cells of an organism share the same DNA.
DNA methylation is the process by which methyl groups are added to cytosines and is most commonly associated with gene imprinting and X chromosome inactivation. This regulatory mechanism has been well characterized in cancer, where the balance between oncogene and anti-oncogenes is modulated by methylation. Increased DNA methylation at tumor suppressor genes decreases their expression, while hypomethylation at oncogenes increases their expression and shifts the balance toward cancer5. The critical role of DNA methylation in the brain has been demonstrated by its association with the neurological disorders Rett syndrome, which involves mutations in the methyl-cytosine binding protein MECP2 (ref. 6), and ICF syndrome, associated with mutations in the DNA methyltransferase DNMT3B (ref. 7). Additional studies in neuropsychiatric disorders have suggested the association of subtle changes in DNA methylation with the pathogenic process. A study by Dempster et al.8, for instance, identified several sites of differential DNA methylation in discordant twins with schizophrenia or with bipolar disorders. Indeed, even for the most significant changes, the reported difference between cases and controls was less than 10% (ref. 8), thus suggesting that very small differences have important functional implications for brain physiology and pathology.
Within this conceptual framework, we asked whether DNA methylation was altered in the brain regions free of pathology in multiple sclerosis. A previous study on DNA methylation in blood samples using reduced representation bisulfite sequencing from three pairs of discordant twins in which only one had multiple sclerosis did not reveal any difference in common among the twin pairs9. However, given the tissue specificity of epigenetic changes, documented by previously reported differences in DNA methylation between blood and brain10, we sought to answer the question of whether tissue free of pathological lesions or infiltrates in multiple sclerosis–affected brains could harbor molecular changes in DNA methylation. Previously reported differences in nucleosomal histone acetylation or citrullination detected in normal-appearing white matter (NAWM) of multiple sclerosis–affected brains11,12 compared to control brains suggested the possibility that epigenetic changes might modulate gene expression.
This study was designed in two phases. First, we assessed the occurrence of genome-wide methylation differences using the Illumina 450K array and related transcriptomic changes using RNA-sequencing analysis (RNA-seq) in a discovery cohort of brain samples from multiple sclerosis patients and from unaffected controls. Second, we validated the results in independent cohorts of samples to verify the reproducibility of the differences in DNA methylation and the consistency of the transcriptional changes. Overall, we uncovered subtle but statistically significant and functionally relevant differences in DNA methylation in pathology-free areas of the multiple sclerosis–affected brains compared to controls.
RESULTS
DNA methylation analysis of multiple sclerosis–affected brains
From an initial pool of brain bank samples for NAWM of multiple sclerosis–affected and control brains, we selected those characterized by short post-mortem interval, RNA integrity preservation and high DNA quality (as assessed by spectrophotometric absorbance A260/A280 ratio and electrophoretic profile). These samples, herein termed the discovery cohort, included DNA from the NAWM, characterized by a lack of inflammatory infiltrates (Supplementary Fig. 1a) and absence of demyelination (Supplementary Fig. 1b), of 28 multiple sclerosis patients, and from the brains of 19 patients without neurological disease and therefore classified as controls (Supplementary Table 1). We conducted genome-wide analysis of DNA methylation in these samples using the Illumina Infinium HumanMethylation450 BeadChip, which allows methylation-specific hybridization to an array of ~485,000 CpG sites spanning the entire human genome13. DNA was isolated and subject to sodium bisulfite treatment to generate methylation-specific base changes before hybridization. Batch effects were minimized by randomized placement of multiple sclerosis and controls across the arrays. Potential false positives were controlled by removing probes with low signal intensity (detection P value > 0.01) and those that overlapped common SNPs (see Online Methods). Methylation values for individual CpG sites in each sample were measured as β-values, which represent the ratio of the methylated hybridization signal intensity to the sum of both methylated and unmethylated signals after background subtraction. As regulatory methylation changes generally encompass multiple CpGs, we sought to identify regions of the genome with differential DNA methylation between multiple sclerosis and controls, rather than focusing on isolated changes in individual CpGs. To that end, we used a 1-kb sliding window analysis, a variation of the tiling region analysis that has been optimized for DNA methylation analysis14. This was followed by multiple hypothesis test correction by calculating the false discovery rate (FDR). Differentially methylated regions (DMRs) were defined as those windows significant at a 1% FDR. Overlapping regions were merged to form a non-redundant set. To justify the selection of the 1-kb sliding window, we extended a ±5-kb window around each CpG within a given DMR and calculated the Pearson correlation coefficient for each CpG (central CpG) and its neighbor within each respective window. This approach revealed that a 1-kb window (±500 bp) around the central CpG showed the strongest level of correlation (Supplementary Fig. 2).
To define whether differences in DNA methylation between multiple sclerosis and controls could be attributed to the disease state itself or other variables, such as age, gender and disease duration, we performed a correlation analysis to model the effect of each variable. While disease duration showed minimal correlation with the DMRs (Supplementary Fig. 3), gender and age had a greater effect, which is consistent with previous reports15,16. We also designed a likelihood ratio test to differentiate the role of disease status on methylation from age and gender in these DMRs (see Online Methods). This age- and gender-corrected analysis identified 220 hypomethylated DMRs (containing 1,235 CpGs) and 319 hypermethylated DMRs (containing 1,292 CpGs) that were statistically significant at a P < 0.05 after FDR correction.
To determine whether the DNA methylation values in multiple sclerosis and control samples independently segregated, we performed principal component analysis (PCA) using β-values of CpGs in statistically significant DMRs, which revealed a clear separation between the two groups (Fig. 1a). We then compared the distribution of hypomethylated and hypermethylated DMRs to that of the CpG distribution in the Illumina 450K array (Fig. 1b,c), which covers 99% of annotated RefSeq genes and shows a wide distribution of probes among CpG islands, shores (2 kb flanking the islands), shelves (2 kb flanking the shores) and sea (regions outside the previous three categories). We noted that hypomethylated DMRs in samples from multiple sclerosis–affected brains were preferentially located in CpG shores rather than shelves. Hypermethylated DMRs were also preferentially distributed in shores rather than islands. Thus, differential methylation between multiple sclerosis and controls showed an overall enriched distribution in CpG shores (P < 10−5; Fig. 1b), characterized by the presence of gene regulatory regions with dynamic DNA methylation patterns and functional consequences for gene expression17,18. DMRs were preferentially found in genomic locations previously associated with enhancers and defined by intermediate methylation (Supplementary Fig. 4a), rather than in regions with extreme methylation values (<0.2 or >0.8). Notably, the overall distribution of the DMRs relative to RefSeq genes (Fig. 1c) revealed a significant enrichment of hypomethylated CpGs in regions immediately surrounding transcriptional start sites (P < 10−80). Hypermethylated CpGs were preferentially distributed in gene bodies (P < 10−10). Within each gene, the methylation changes in contiguous CpGs displayed concordant changes, either hypermethylation (Fig. 2a) or hypomethylation (Fig. 2b).
Figure 1.
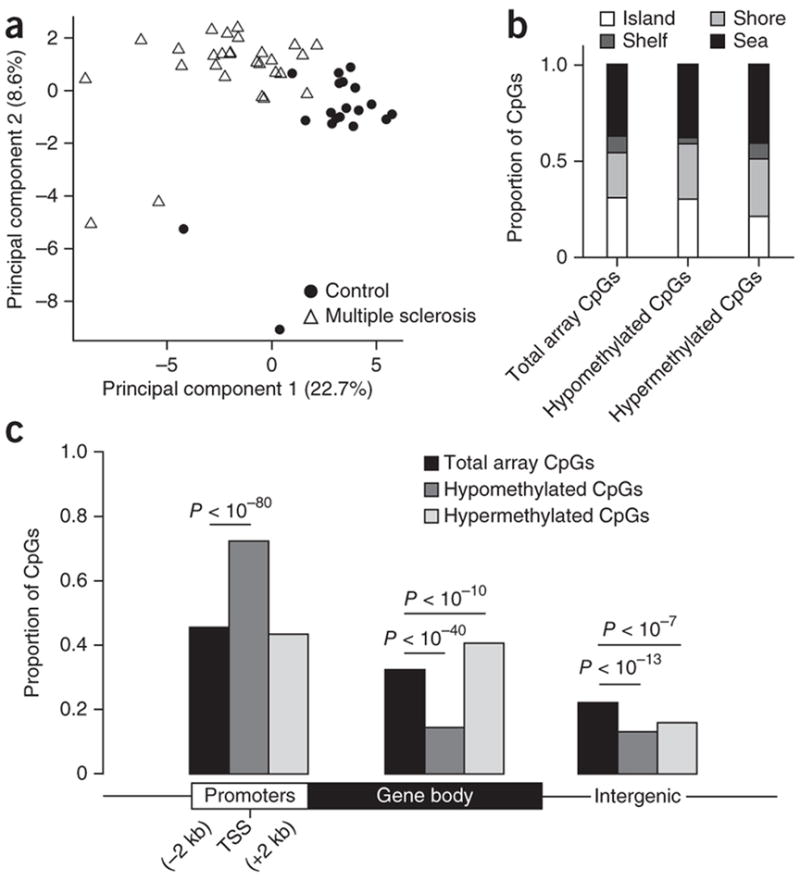
Differential distribution of DNA methylation in multiple sclerosis–affected brains. (a) Principal component analysis of 28 multiple sclerosis cases (triangles) and 19 controls (circles) based on methylation levels of all CpGs within DMRs identified by a sliding window analysis. Plotted are the first and second principal components. Percentage of variation explained by each is given in parentheses. (b,c) Distribution of CpG sites in CpG islands, shores, shelves and sea (b) and relative to RefSeq gene promoters, gene bodies and intergenic regions (c). CpGs in hypomethylated and hypermethylated DMRs are compared to all autosomal CpGs on the Illumina array using Pearson’s chi-squared test.
Figure 2.

Changes in DNA methylation are concordant within a differentially methylated region. (a) Plot of DNA methylation for individual CpGs within a hypermethylated DMR in intron 1 of NDRG1. Above the plot is the complete gene structure, with dotted lines indicating the zoomed region containing the DMR shown in the plot. Methylation for individual multiple sclerosis cases and controls is plotted in red and black, respectively, with red and black lines connecting the mean methylation for each consecutive CpG assayed. (b) Plot of hypomethylated CpGs in intron 2 of LRRC27. Plot as described in a. Arrowheads indicate CpGs that were assayed in c. (c) Methylation for individual CpGs assessed using MassARRAY EpiTYPER. Plots are as shown in a. Below the plot is the local DNA sequence surrounding each CpG. Arrowheads indicate CpGs with corresponding Illumina probes in b. (d) Pearson’s correlation between methylation measured by the Illumina array and Sequenom assay (n = 39 DNA brain samples). Plot shows data for the CpG with the highest cross-platform correlation; however, all CpGs tested showed correlation coefficients r > 0.6. (e) Summary of Pearson’s correlations of CpG methylation at sites measured by both Illumina array and Sequenom assays.
To technically verify that the changes in methylation detected by the Illumina array were reliable and accurate, we used an independent approach called Sequenom EpiTYPER, which uses mass spectrometry to quantify methylated and unmethylated cytosines, following bisulfite conversion. We randomly selected DMRs with a range of methylation differences, as low as 2% and as high as 16%, to perform EpiTYPER analysis. At CpGs tested by both the Illumina array and Sequenom assay, we observed strong correlations (P < 0.01) between the two methods (Fig. 2d,e). We also detected concordant changes for neighboring CpGs that were not included on the Illumina array (Fig. 2c). This provided further verification of the Illumina array data and validated the presence of concordant changes in contiguous CpGs across the genome.
DNA methylation changes are subtle and widely distributed
To avoid the potentially confounding influence of X inactivation on DNA methylation patterns on the X chromosome between males and females20, we focused our analysis on autosomal probes. The vast majority of both hypomethylated and hypermethylated CpGs revealed subtle changes, within the range of modifications consistent with reported environment-gene interactions (Supplementary Fig. 4b). We represented the genome-wide map of all autosomal DMRs (for the complete annotated lists, refer to Supplementary Table 2) as a circular ideogram, composed of concentric circles depicting the entire autosome complement, with chromosomal location annotated in a clockwise manner and statistical significance indicated by radial arrangements and color codes (Fig. 3). Because assigning DMRs to RefSeq genes on the basis of the proximity to the nearest gene is not considered the most accurate method21,22, we overlapped our data set with DNase I hypersensitive sites as reported by Sheffield et al.22. We considered only the DMRs within gene(s) associated with the overlapping DNase I hypersensitive sites. In Figure 3 only those genes containing statistically significant DMRs between MS and control samples (FDR <0.005) are plotted.
Figure 3.

Circos plot of genome-wide DNA methylation changes between brains of individuals with multiple sclerosis and controls without neurological disease. Circular representation of the genome. The black innermost ring (with vertical lines) represents autosome ideograms (annotated is the chromosomal number), with the pter-qter orientation in a clockwise direction. Small red lines represent the centromeres within each chromosome. The dots inside and outside of the ideogram represent the Fisher’s method −log10(P value) for each 1-kb window analyzed. Black dots outside the ideograms mark hypermethylated windows (green dots denote significant hypermethylated windows), while dots inside mark hypomethylated windows (red dots denote significant hypomethylated windows). Each dot also marks the location of the Illumina 450K probe distribution along the genome. The second outermost black circle represents baseline (zero) and the β-value difference between multiple sclerosis and controls for significant windows after age and gender correction. Green lines signify hypermethylated regions and red hypomethylated, with the length of each line representing the difference level. The last two circles show the RefSeq genes associated with differentially methylated regions: inner circle, genes associated with hypomethylated DMRs (red); outer, genes associated with hypermethylated DMRs (green). Only genes with a FDR q value <0.005 are shown.
To begin addressing the functional significance of the widespread changes in DNA methylation, we performed a gene ontology analysis of the data set, which revealed distinct functional categories for the hyper- and hypomethylated DMR-associated gene lists (Table 1). While the hypermethylated DMRs identified broad processes, including actin filament–based processes and biological regulation, the hypomethylated DMRs were detected in categories associated with immune response, lymphocyte mediated immunity and organ morphogenesis (Table 1). Among the hypermethylated genes, we recognized several oligodendrocyte-specific genes (for example, MBP, SOX8), including those regulating survival (for example, NDRG1, BCL2L2). Despite our focus on autosomes, a gender-specific analysis of the X chromosome in male and female subgroups identified DMRs associated with two genes (Supplementary Table 2) in males and a separate set of two genes in females. The female subgroup included a hypermethylated DMR neighboring GJB1, encoding the gap junction molecule connexin 32, which is involved in oligodendrocyte function. Together, these data suggest the existence of a trend for hypermethylation in genes implicated in oligodendrocyte function and hypomethylation in genes implicated in immune-related function.
Table 1.
Gene ontology characterization of DMR-associated genes in multiple sclerosis
| GOBPID | Description | P-value | Gene names |
|---|---|---|---|
| Genes associated with hypermethylated DMRs (439) | |||
| GO:0030029 | Actin filament–based process | 0.0004 | ALDOA, ATP1A2, BCAR1, BRK1, CDK5, CORO1A, CSF3, DLC1, DTNBP1, FGD2, FMNL1, MLST8, MYBPC3, MYH6, MYH7, MYO1F, OBSCN, PDGFA, PRKCZ, SHC1, SIPA1L1, SSH3, TPM3 (23) |
| GO:0009116 | Nucleoside metabolic process | 0.0006 | ADA, AGAP1, ALDOA, ARHGEF16, ATP1A1, ATP1A2, ATP1A4, ATP5H, BIN1, DAB2IP, DLC1, FGD2, LDHC, MACROD1, MLST8, MYBPC3, MYH6, MYH7, NME4, NT5C, PLXNB1, PTPRN2, RASA3, SEPT9, SIPA1L1, TBCD, TK1 (27) |
| GO:0065007 | Biological regulation | 0.0092 | ACSBG1, ACSL1, ACTR8, ADA, AGAP1, AGPAT1, AGRP, AKAP8, ALDH3A1, ALDOA, AMH, ANGPT2, APBB1IP, APEX, ARHGEF16, ATF6B, ATP11A, ATP1A1, ATP1A2, ATP1A4, ATP6V0E1, ATRIP, BBS2, BCAR1, BCL2L2, BIN1, BIRC5, BPI, BRD4, BRK1, C4B, CACNA1D, CASKIN1, CBX4, CCL17, CCL22, CD37, CD59, CDH1, CDK5, CHST3, CHURC1, CLASP1, CLIC5, CORO1A, CREB5, CRY2, CSF3, CSNK1E, CX3CL1, CXXC5, CYP21A2, DAB2IP, DAND5, DCPS, DHRS3, DLC1, DLL1, DOK4, DOT1L, DSCAML1, DTNBP1, DYRK1B, E2F6, E4F1, EDN2, EFS, ENTPD2, ERCC3, F7, FAM109A, FGD2, FGFR3, FMNL1, GBX1, GDF10, GPR114, GPR56, GTF2H1, GYLTL1B, HDAC11, HEG1, HEXIM1, HEXIM2, HIGD1A, HIST3H3, HLA-DMA, IL17RB, IL25, IL34, INO80E, INPP5J, INTS1, IRAK2, ITPKB, JARID2, LIMD1, LMF1, LPCAT1, MAB21L2, MADD, MAML3, MAP3K14, MAPK3, MBP, MCF2L, MED24, MEIS2, MLLT10, MLST8, MT1A, MT1E, MT1F, MT1G, MT1M, MT2A, MT4, MTCH1, MTSS1L, MUSK, MYBPC3, MYH6, MYH7, MYO1F, NARFL, NCOR2, NDRG1, NLRP3, NOTCH4, NR1H3, NUP210, OBSCN, OTX2, PABPN1, PAG1, PBX2, PCSK6, PDGFA, PEG10, PHF21A, PIK3R1, PLEKHG3, PLLP, PLXNB1, POLD4, POLR2C, POU2F1, PPARA, PPIL2, PPP1R13B, PPP4C, PRAM1, PRDM16, PRKCH, PRKCZ, PTGDS, PTPRN2, RAD9A, RAI1, RASA3, RBP1, RFX5, RIN2, RNF187, RPA1, RRM2, RXRA, SACS, SEMA4C, SETD1A, SHC1, SHISA5, SIPA1L1, SLC17A7, SLC22A17, SLC39A13, SLC7A8, SMAD6, SOX1, SOX8, SPI1, SPOCK2, SREBF1, SSH3, SSTR5, SUN1, TACC3, TBCD, TBX6, TEAD2, TEF, TEP1, THRA, TLN2, TNRC6C, TPM3, TRAF2, TSNARE1, UBE2L3, USP19, VAC14, WHSC1, WISP1, WISP2, WNK2, ZBTB47, ZFP1, ZIC1, ZNF135, ZNF256, ZNF329, ZNF362, ZNF414, ZNF418, ZNF488, ZNF606, ZNF664, ZNF687 (218) |
| Genes associated with hypomethylated DMRs (495) | |||
| GO:0006955 | Immune response | 1.1 × 10⁻⁷ | ADAMDEC1, AIF1, AIRE, B2M, BPI, C1QA, C1QB, C1QC, C4BPA, C4BPB, CCR6, CD19, CD37, CD4, CD7, CD81, CFD, DLG1, FCER2, HAMP, HLA-DMA, HLA-DMB, HLA-DOA, HLA-DOB, HLA-DQA2, HLA-DQB2, HLA-F, IRF6, IRF8, IRF9, JAK1, JAK3, KYNU, LAG3, LAT, LBP, LCP2, LGMN, LST1, LTA, LTB, MBL2, MICB, NCR3, OSM, PSMB8, PTPN22, RARA, RNF31, SECTM1, SLAMF7, STXBP2, TAP1, TAP2, TAPBP, TNF, TNIP2 (57) |
| GO:0002449 | Lymphocyte-mediated immunity | 3.7 × 10⁻⁶ | B2M, C1QA, C1QB, C1QC, C4BPA, C4BPB, DLG1, FCER2, HLA-DMA, LAG3, LTA, MBL2, NCR3, SLAMF7, TAP1, TAP2, TNF (17) |
| GO:0002443 | Leukocyte-mediated pathway | 4.4 × 10⁻⁶ | B2M, C1QA, C1QB, C1QC, C4BPA, C4BPB, DLG1, FCER2, HLA-DMA, LAG3, LAT, LTA, MBL2, NCR3, SLAMF7, STXBP2, TAP1, TAP2, TNF (19) |
| GO:0001906 | Cell killing | 8.6 × 10⁻⁶ | B2M, FCER2, HAMP, LAG3, MBL2, NCR3, SLAMF7, STXBP2, TAP1, TAP2 (10) |
| GO:0035295 | Organ morphogenesis | 9.7 × 10⁻⁵ | BHLHE23, CTSZ, DLG1, DLL1, DLX1, DLX2, EDARADD, EPHB4, FOXL2, GLI1, GNAS, HOXC11, HOXC13, HOXC4, HOXC8, HOXC9, HOXD10, HOXD11, HOXD13, HOXD3, HOXD4, HOXD8, HOXD9, MSX1, PHLDA2, PPP1R13L, PTCD2, RARA, RUNX3, SOX1, SOX8, TBX3, TEAD2, TGM1, TH, TNF, TWIST1, WNT2, ZIC1 (39) |
GOBPID, gene ontology biological process identifier. Numerals in parentheses indicate the number of genes in the category.
Transcriptional effects of DNA methylation changes
To begin understanding the transcriptional consequences of differential DNA methylation, we used RNA-seq and performed an unbiased, genome-wide transcriptome analysis of multiple sclerosis and control samples of the discovery cohort. To identify the relationship between changes in DNA methylation and gene expression, we compared the P value for each DMR against the P value from the RNA-seq data (Supplementary Table 3) for corresponding genes in the two data sets. A direct comparison of the hypo- and hypermethylated DMRs with the upregulated and downregulated transcripts (Table 2) revealed a statistically significant correlation between hypomethylated DMRs and increased gene transcripts (P = 1 × 10⁻¹⁸) and between hypermethylated DMRs and decreased transcripts (P = 9.8 × 10⁻⁵). We generated a quadrant plot to better depict this analysis (Fig. 4a). Among transcripts that were upregulated in multiple sclerosis samples compared to controls, we detected CTSZ and LGMN, two cysteine proteases that are involved in immune regulation but also have additional biological functions in neural cells (Fig. 4b). Among the downregulated genes we detected CRY2, a gene involved in circadian rhythm, and BCL2L2, which has been shown to regulate neuronal and oligodendrocyte survival (Fig. 4b). A comparison of our data set with previously published studies further revealed a remarkable degree of overlap between the data sets, despite the different methods of analysis and sample collection (Table 2).
Table 2.
Overlap between differentially expressed genes with associated DMRs and previous microarray studies of multiple sclerosis and control NAWM samples
| Upregulated RNA-seq (979) | Downregulated RNA-seq (1,201) | |||
|---|---|---|---|---|
| Hypomethylated DMRs (495) | 50 P = 1.0 × 10⁻¹⁸ |
ARHGAP22, C10orf54, C17orf62, C1QA, C1QB, C1QC, CD37, CD4, CD48, CD84, CEPT1, CFD, CHI3L2, CNPPD1, CTSD, CTSZ, DAPP1, DOK3, FAM46A, FERMT3, GPR84, GSDMD, HLA-DOA, IRF9, LGMN, LSP1, MFNG, MGAT1, MRPL23, MRPS22, MSX1, NAPSB, NOL12, OSCAR, PATL2, PCK2, RBM14-RBM4, RBM4, RIN3, SECTM1, SGCE, SLC17A9, SP110, STIP1, STXBP2, TBL2, TRIM10, TSSC4, UBE2Z, VPS26A | 20 P = 0.049 |
AIFM2, ANO2, CLYBL, CPAMD8, DNAJB14, FLRT1, HLA-F, HOXC8, IRF6, KIFC1, KYNU, OSBPL5, PFKFB2, PITRM1, PPP1R13L, PTPN14, SYT8, TTC22, VWF, ZNF365 |
| Hypermethylated DMRs (439) | 18 P = 0.008 |
AFMID, ATP6V0E1, BIRC5, C9orf142, CD37, FGD2, INO80E, MSLN, MYO1F, OTX2, PPP4C, RNF185, SDF2L1, SGCE, SLC47A2, SPI1, SYNGR2, UBE2L3 | 24 P = 9.8 × 10⁻⁵ |
ATP1A1, ATP1A1OS, ATP1A2, ATP1A4, BCL2L2, CRY2, DAB2IP, FLRT1, MED24, NOTCH4, OBSCN, OSBPL5, PPT2, PRDM16, RBP2, SEC14L1, SH2D4B, SIPA1L1, TPM3, UBAP2L, WDR37, WHSC1, WNK2, ZSCAN18 |
| Graumann et al.49 (349) | 14 P = 0.039 |
ADORA3, BCL2L1, CCR1, CSF1, CSK, CTSD, DDIT3, IRF9, MSX1, NGFR, PLAUR, SERPINA1, TGB2, UBE2A | 37 P = 1.5 × 10⁻¹¹ |
ATP1A1, BCL2L2, CAMK4, CDH3, CNTN1, DDR2, EGFR, ELAVL4, ERBB4, ERG, FLT1, FLT3, GABRB1, GRM5, HIVEP2, ICAM1, ITSN1, KCNA2, MAPK10, MAPK9, MCAM, NF1, NF2, NTRK2, PAK1, PDGFRB, PKD1, PPP2R2B, PRKAR1A, PRKCB, PTPN11, PTPRG, RAB6A, RASA1, SMARCA2, SMARCA4, TFRC |
| Lindberg et al.50 (47) | 13 P = 3.6 × 10⁻¹¹ |
ARPC1B, CASP1, DOK1, FCER1G, FOLR2, GDPD5, HCK, IRF5, LY86, MAX, MMP2, NCF4, TGB2 | 3 P = 0.150 |
ASB1, DDR2, ZNF365 |
Numerals indicate the number of genes in the category.
Figure 4.

Identification of genes with coordinated changes in DNA methylation and gene expression. (a) Quadrant plot of DMRs and expression of associated genes. On the x axis is the −log10 Fisher’s P value (see Online Methods) for differentially methylated regions; on the y axis, −log10 P value of differential expression for associated genes. Vertical dashed lines indicate a threshold of 5% FDR and horizontal dashed lines indicate a threshold corresponding to P < 0.05. The four quadrants shown are (i) hypermethylated and upregulated in multiple sclerosis (open green circles), (ii) hypermethylated and downregulated in multiple sclerosis (filled green circles), (iii) hypomethylated and upregulated in multiple sclerosis (filled red circles) and (iv) hypomethylated and downregulated in multiple sclerosis (open red circles). A select number of genes are shown as position references. (b) Box-and-whisker plot of normalized log2 expression for several upregulated and downregulated genes associated with a DMR. Whiskers indicate 1.5 times the interquartile range; bottom and top of the boxes, first and third quartiles, respectively; center lines, second quartile. Open circles represent measurements outside of the range defined by the whiskers. MS, multiple sclerosis.
We had already screened the samples for the absence of any pathological process and lack of inflammatory cells, but we could not discount the possibility that multiple sclerosis tissue could have been characterized by differences in cellular composition. We addressed this issue in two manners: first, we used the CETS R package23 to evaluate the neuronal and glial proportion of each sample (Fig. 5a); and second, we used our RNA-seq data set to calculate the average transcript values of genes specific for distinct cell lineages (Fig. 5b), including astrocytes (GFAP), microglia (AIF1), neurons (RBFOX3) and oligodendrocytes (OLIG2). These analyses revealed no significant correlations between any given cell type and the differences detected between multiple sclerosis and control samples. To further support the transcriptional data, we also conducted immunohistochemistry on the same samples, which confirmed lack of HLA-DR immunoreactivity, indicative of the absence of active microglia (Fig. 5c), and the presence of comparable numbers of OLIG2+ cells (Fig. 5d,e). Therefore, the transcript levels of CTSZ (Fig. 5f) and the corresponding immunoreactivity pattern of this cysteine protease (Fig. 5g) could not be attributed to the presence of microglial cells in the normal tissue, but rather must be attributed to increased levels of RNA and proteins in neuronal and glial cells. We also examined the transcript (Fig. 5h) and protein expression of hypermethylated genes such as NDRG1 (Fig. 5i) and BCL2L2 (Fig. 5j). In both cases, we detected decreased immunoreactivity in the multiple sclerosis– sample NAWM compared to the controls. Together, these data suggested that hyper- and hypomethylation occurred in functionally distinct gene categories and resulted in lower levels of proteins involved in oligodendrocyte survival and higher levels of cysteine proteases involved in proteolytic processing.
Figure 5.
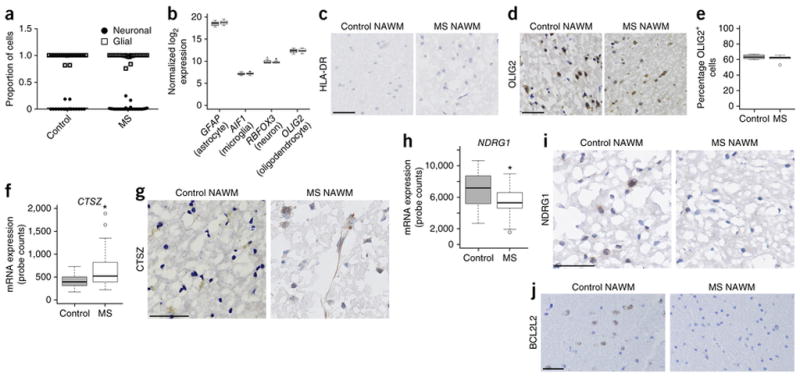
Cell composition does not affect changes detected by immunohistochemistry. (a) Scatter plot of neuronal (circle) and glial (square) cell contributions to the methylation signature for each individual sample from control and multiple sclerosis–affected brains. (b) Box and whisker plot of normalized log2 expression for GFAP, AIF1, RBFOX3 and OLIG2. In b,f,h, whiskers indicate 1.5 times the interquartile range; bottom and top of the boxes, first and third quartiles, respectively; center lines, second quartile. (c) Representative HLA-DR for control (n = 5 brain samples) and multiple sclerosis (n = 10 brain samples) sections. Scale bar, 50 μm. (d) Representative OLIG2 staining for control (n = 5 brain samples) and multiple sclerosis (n = 10 brain samples) sections. Scale bar, 50 μm. (e) Percentage of OLIG2+ cells in these sections. Whiskers indicate 1.5 times the interquartile range. (f) Expression (normalized NanoString assay counts) for CTSZ (control n = 18 RNA brain samples, multiple sclerosis n = 26 RNA brain samples; *P < 0.05). Whiskers indicate 1.5 times the interquartile range. (g) Representative CTSZ staining for control (n = 5 brain samples) and multiple sclerosis (n = 10 brain samples) sections. Scale bar, 50 μm. (h) Expression (normalized NanoString assay counts) for NDRG1 (control n = 17 samples, multiple sclerosis n = 26 samples; *P < 0.05). Whiskers indicate 1.5 times the interquartile range. (i) Representative NDRG1 staining for control (n = 5 brain samples) and multiple sclerosis (n = 10 brain samples) sections. Scale bar, 50 μm. (j) Representative BCL2L2 staining for control (n = 5 brain samples) and multiple sclerosis (n = 10 brain samples) sections. Scale bar, 50 μm. MS, multiple sclerosis.
Validation of changes in an independent cohort
We tested the reproducibility of the methylation differences identified in the discovery cohort in an independent validation cohort of samples (Supplementary Table 4). We focused our analysis on significant DMRs with correlative changes with gene expression and assessed methylation in specific genomic locations using EpiTYPER analysis (Fig. 6a). The finding of significant changes in DNA methylation in the second independent validation cohort strengthened the reliability of the DMR identified in the discovery cohort. Those changes were consistent in terms of directionality of change (i.e., methylation status) and average methylation difference between multiple sclerosis and control (Supplementary Fig. 5). As in the technical verification, neighboring CpGs not included on the Illumina array demonstrated similar concordant changes (Supplementary Fig. 5).
Figure 6.

Validation of methylation and gene expression changes in an independent cohort. (a) Summary of Sequenom assays for DNA methylation differences tested in an independent cohort (control n = 20 DNA samples, multiple sclerosis n = 10 DNA samples). Listed are CpGs that overlap probes tested by the Illumina array. (b) Quantitative PCR of CTSZ (P = 0.021) and HAGHL (P = 0.048) in a second cohort of NAWM samples. Bar graphs (mean ± s.e.m.) show relative transcript abundance as compared to control after normalization (*P < 0.05). (c) Gene expression of NDRG1 (P = 0.0309) and LGMN (P = 0.0209) from an unpublished microarray study, showing relative transcript levels (mean ± s.e.m.) as compared to control after normalization (*P < 0.05). MS, multiple sclerosis.
We further assessed the reproducibility of the association between DNA methylation and transcriptional consequences by performing quantitative PCR for several genes in the validation cohort (Fig. 6b). Genes such as CTSZ and HAGHL showed significant (P < 0.05) differences between multiple sclerosis and control samples similar to those detected in the discovery cohort by RNA-seq (Fig. 6b). In a small third cohort of samples, independent of the first two (Supplementary Table 5), we further validated the consistency of the transcriptional consequences by comparing the expression of NDRG1 and LGMN between multiple sclerosis and control NAWM (Fig. 6c). For BCL2L2, the differences in expression in the second and third cohort showed trends that matched the RNA-seq data (i.e., downregulation in multiple sclerosis samples), although they did not reach significance, likely owing to the reduced sample size (data not shown).
DISCUSSION
The association of geographic location, parent-of-origin effect24, vitamin D levels25, smoking26 and diet27,28 with disease onset is supported by epidemiological studies, although the possibility cannot be discounted that the same parameters might also modulate disease course29. It is becoming increasingly clear that, under physiological conditions, environmental influences epigenetically modulate gene expression in normal tissue, by affecting modification of chromatin components (for example, histones), microRNAs and subtle changes in DNA methylation. It is therefore conceivable that pathology-free areas in a diseased brain might harbor epigenomic changes that might determine the ability to respond to the pathological process.
In this study, we focused on DNA methylation in NAWM because this modification has been shown to be affected by environmental stimuli. Potential confounders, such as post-mortem interval and batch effect, were controlled by selecting only those samples with short intervals and DNA and RNA integrity preservation and by implementing sample randomization. The choice of the material to study was very important, as we wanted to investigate changes occurring in DNA methylation in the absence of inflammatory infiltrates and independent of ongoing pathology. In this study, we employed Illumina technology to analyze the differential methylation of over 485,000 CpG sites throughout the entire human genome and used stringent statistical criteria to define differential methylation patterns between multiple sclerosis and controls. Although the array contains only ~2% of the total CpGs present in the genome, it includes representation of 99% of RefSeq genes, and therefore its use in comparative studies of human tissue is expected to become widespread. We identified hypo- and hypermethylated DMRs by comparing the methylation state of multiple sclerosis samples and controls (i.e., β-values) of CpGs within a 1-kb region. We also took into consideration the effect of gender, age and disease duration on the loci identified by our analysis. However, only age and gender showed widespread statistically significant effects and were corrected for, using a likelihood ratio test. The minimal effect of disease duration and the lack of correlation with widespread differences in methylation was important because it argued against the potential accrual of disease-related changes over time. The effect of therapy, although of great interest, could not be assessed in this study.
The identified differences in methylation between multiple sclerosis and controls were subtle but consistent throughout the genome. We did not observe all-or-none methylation changes but rather subtle concordant changes (either higher or lower β-value average) in multiple CpGs distributed at specific gene loci. These small-scale modifications are in line with previously reported environmental influences on DNA methylation. This is in sharp contrast with results in cancer specimens, where the pathological process has entirely disrupted the physiology of the cells and therefore it is not unusual to detect very large differences in DNA methylation. A potential interpretation of these findings is a model of cumulative changes in a given cell, putting it at a heightened risk for damage. There are precedents for small changes of DNA methylation resulting in measurable functional outcomes. One example is the DNA methylation status of the paternally expressed gene 10 (PEG10) and its association with low birth weight30. A 5–10% change of methylation in the imprinted PEG10 gene was associated with significant differences in birth weight and a concomitant 1.5-fold decrease in gene expression in low birth weight babies30. Other studies investigating the pathogenic role of DNA methylation in Alzheimer’s disease31 and rheumatoid arthritis32 have similarly reported small but significant changes. As in our findings, these studies did not observe changes in genomic regions at the extreme ends of methylation values (<0.2 or >0.8) but rather at intermediate methylation levels, a range that has been previously associated with active distal regulatory regions, such as enhancers19. Taken together, these findings can be extrapolated to our study and allow us to propose that small differences in methylation are indicative of environmental regulation of gene expression and result in decreased expression of genes modulating oligodendrocyte survival.
In addition, the detected methylation differences correlated with transcriptional and translational consequences in functionally distinct gene categories, as supported by the immunohistochemical changes. The reliability of these changes was further demonstrated by validating DNA methylation and gene expression changes in an independent validation cohort of pathology-free areas from multiple sclerosis and control brains.
Hypermethylated DMRs and decreased transcript levels were detected for genes regulating oligodendrocyte and neuronal function, including BCL2L2, a member of the antiapoptotic BCL2 family of proteins33; HAGHL, a gene encoding the enzyme hydroxyacylglutathione hydrolase–like and highly expressed in the brain34; and NDRG1, a gene involved in oligodendrocyte response to stress35. The product of the BCL2L2 gene is the mitochondrial protein BCL-W, whose antiapoptotic activity has been attributed to its ability to sequester the pro-apoptotic BAX. Low levels of BCL-W were associated with increased neuronal death in cultures treated with β-amyloid36, in mice with epileptic seizures37 and in rats with photothrombotic ring stroke38. Conversely, overexpression of Blc2l2 was shown to be protective against axonal degeneration39.
Hypomethylation was detected in genes encoding cysteine proteases, including CTSZ and LGMN, which were also characterized by increased transcripts. The cathepsin family includes several members that are classified into distinct subgroups on the basis of the amino acid at the active site: aspartate protease (cathepsins D and E), serine protease (cathepsin G) or cysteine protease (cathepsins B, C, F, H, L, S and Z and legumain). The role of these enzymes has been mainly studied in the context of antigen presentation40, with cathepsin S absolutely required for antigen processing of myelin basic protein. CTSZ encodes for cathepsin Z (also known as cathepsin X or cathepsin P), a secreted carboxypeptidase that was originally identified from a brain cDNA library41 and found to map to a chromosomal location separate from all other cysteine protease genes. Originally thought to be exclusively expressed in the immune cells, CTSZ has been shown to be upregulated in several different organs, including the brain, where it cleaves mutant huntingtin42, and in several tumors (reviewed in ref. 43). Because it can cleave the C terminal of proteins, CTSZ has been implicated in several processes, depending on substrate specificity. Cleavage of the C terminal of enolase, for instance, has been functionally linked to impaired neuronal survival44, while cleavage of the integrin receptor has been shown to affect migration45 and cell adhesion46 and can contribute to metastatic infiltration of tumors. The detection of cathepsin Z in glial cells has been also reported in other studies performed in brains affected by Alzheimer’s disease and in the brains of aged C57BL/6 mice, where its expression was found to be higher in cerebellum and spinal cord, and its levels increase with age in neurons, astrocytes and microglial cells, but not in oligodendrocytes47. In our study, CTSZ expression was barely detectable in NAWM from the frontal cortex of human control brains, and its expression was higher in multiple sclerosis–affected brains, where it appeared to localize to neurons and glial cells. LGMN encodes legumain (also known as asparaginyl endopeptidase, or AEP), an endopeptidase with the ability to cleave MBP and generate immunogenic peptides48.
The finding that hypo- and hypermethylated genes occur in functionally distinct gene ontology categories suggests that hypo- and hypermethylation may occur in distinct cell types. It is intriguing to speculate that alterations in distinct cell types might converge on pathways regulating the ability of oligodendrocytes to respond to damage and enhancing myelin protein processing by antigen-presenting cells. Together, these data propose a model of disease associated with molecular changes in DNA methylation, occurring in gene categories modulating the vulnerability of the brain tissue to the pathological process.
ONLINE METHODS
Sample preparation
Unidentified post-mortem brain frontal lobe specimens were obtained from the UK Multiple Sclerosis Tissue Bank and the Human Brain and Spinal Fluid Resource Center at UCLA after obtaining approval of the Institutional Review Board at both institutions. Tissue blocks were bisected and divided into samples for histology and samples for DNA and RNA extraction. NAWM was dissected from surrounding tissue on a benchtop cold plate (TECA) cooled to −20 °C.
For histology, the blocks were sectioned into 5-μm slices and mounted on glass slides for further analysis. For DNA, samples were isolated using standard phenol-chloroform extraction and ethanol precipitation. DNA purity was assessed by measuring the A260/A280 ratio using a NanoDrop (Thermo Scientific) and DNA quality checked by agarose gel electrophoresis for a strong band at high molecular weight. We performed PCR to check for cross-contamination of female samples using the following primers: TTTY7 forward primer ATTCCCTTGAGGGTCGTCTT, reverse primer GGGCACTCTTCCATCATCTT; TSPY forward primer TCCCCTGACAGATCCTATGTAA, reverse primer TGCTGTATTAGGTAAA ATCTGATGCT.
For RNA, samples were isolated using TRIzol (Invitrogen) extraction and isopropanol precipitation. RNA samples were resuspended in water and further purified with RNeasy columns with on-column DNase treatment (Qiagen). RNA purity was assessed by measuring the A260/A280 ratio using a NanoDrop and RNA quality checked using an Agilent 2100 Bioanalyzer (Agilent Technologies).
From an initial 64 samples, we screened for post-mortem interval (31 h or less), lack of inflammatory infiltrates or plaques, preserved RNA integrity (RIN ≥7) and high DNA quality (as assessed by A260/A280 ratio and electrophoretic profile). We selected for subsequent analysis only 28 multiple sclerosis patients and 19 controls without neurological disease that passed all quality control metrics.
A second cohort of multiple sclerosis samples was provided by R.D. and B.D.T. from the Lerner Research Institute at the Cleveland Clinic. A second set of controls was provided by V.H. from the Brain Bank at Icahn School of Medicine at Mount Sinai. These samples were processed for DNA and RNA as noted above.
No statistical methods were used to predetermine sample size, as the number of available NAWM samples was a limiting factor in selecting total sample size.
DNA methylation analysis
1.25 μg of human genomic DNA was sodium bisulfite–treated using an EZ DNA Methylation Kit (Zymo Research). The converted DNA was analyzed on an Infinium HumanMethylation450 BeadChip (Illumina) following the manufacturer’s guidelines. To minimize batch effects, cases and controls were randomly distributed to different arrays. Methylation values for individual CpG sites in each sample were obtained as β-values, calculated as the ratio of the methylated signal intensity to the sum of both methylated and unmethylated signals after background subtraction (β-values range from 0 to 1, corresponding to completely unmethylated and fully methylated sites, respectively).
Data processing and statistical analysis
Data were collected randomly but not assessed blindly. Data distribution was assumed to be normal, but this was not formally tested. Illumina array data were processed using the Methylation Module of GenomeStudio v1.9 software using default parameters. In each individual, probes with a detection P value > 0.01 were removed (mean n = 348). 482,421 probe sequences (50-mer oligonucleotides) were remapped to the reference human genome hg18 (NCBI36) using BSMAP51, allowing up to 2 mismatches and 3 gaps; we retained unique sequences for 470,681 autosomal probes and 11,122 probes mapping to the X chromosome (chrX). β-values from the remaining probes were quantile normalized using the normalizeQuantile function in the aroma.light R package52. As X chromosome inactivation causes gender differences in methylation patterns on chrX, the probes on this chromosome were normalized for males and females separately and independently of autosomal probes. Probes that overlapped SNPs identified by the 1000 Genomes Project (minor allele frequency ≥ 0.05) within 5 bp upstream of the targeted CpG (n = 9,409 for autosomes; n = 101 for chrX) were discarded, as such variants can introduce biases in probe performance. The remaining 461,272 autosomal and 11,021 chrX probe sequences were annotated on the basis of their position relative to RefSeq genes using BEDTools v2.17 (ref. 53). We defined promoter regions as ±2 kb from transcriptional start sites (TSS), gene body regions as transcription start to transcription end after excluding the first 2 kb of the gene, and intergenic regions as those not annotated by the preceding categories. We also annotated individual CpG in context with CpG island (using UCSC annotation in hg18), CpG shore (±2 kb of island), CpG shelf (±2 kb of shore) and CpG sea (regions outside the previous three categories).
For each probe, β-values in multiple sclerosis cases were compared against controls using two one-sided Student’s t-tests: p(multiple sclerosis < controls) and p(multiple sclerosis > controls). To identify differentially methylated regions (DMRs), we used a 1-kb sliding window based on the start coordinate of each probe, starting at the first probe and moving down consecutively to the last probe on each chromosome, and applied Fisher’s method to combine P values for each 1-kb region on the basis of all probes within each window14. Significant DMRs were selected at a 1% FDR on autosomes and 5% FDR on chrX (ref. 54). DMRs where methylation values for multiple sclerosis were less than controls for the majority of individual CpGs were considered hypomethylated; otherwise, they were annotated as hypermethylated.
We designed a likelihood ratio model to differentiate the influence of disease status on methylation from confounding variables such as age and gender in these DMRs. As a test model, we performed linear regression using age, gender and disease status as independent variables (test model for methylation: age + gender + disease status). This model was tested against the reduced (or null) model by using only age and gender as independent variables (reduced model for methylation: age + gender). This test results in more significant P values when disease status plays a major role in methylation variation. To combine P values for each 1-kb region on the basis of all probes within each window, we applied Fisher’s method as described above. We considered DMRs of this subset with a FDR q-value < 0.05 in favor of the test model incorporating disease status as significantly associated with multiple sclerosis.
The positional distribution of autosomal probes within DMRs with respect to CpG feature and RefSeq genes was compared to the overall distribution of all filtered autosomal probes on the array, and enrichment P values were determined by Pearson’s chi-squared test.
To compare the relationship between CpGs within the DMRs with neighboring CpGs, we set each CpG in the DMR as a ‘central’ CpG and extended a 10-kb window (±5 kb) around each one. We used Pearson correlation to identify the pairwise relationship between the central CpG and neighboring CpGs within each window. For gene-specific methylation blocks, we compared CpGs overlapping the gene promoter and gene body.
Principal component analysis was performed using the plotSampleRelations function from lumi package. Principal components 1 and 2 were used to observe spread of the samples using only the β-values from CpGs in significant DMRs.
To identify genes associated with each DMR, as assigning them to the nearest gene is not always the most accurate method21,22, we overlapped them with DNase I hypersensitive sites (DHSs) characterized as showing significant correlations with the expression levels of nearby genes in 112 ENCODE cell lines22 and annotated the DMRs with the gene(s) associated with the overlapping DHSs.
To determine the contribution of sample cellular heterogeneity to the DNA methylation signatures that we identified, we used the CETS R package23 to quantify the neuronal and glial proportions for each sample.
Detection of methylation changes by Sequenom EpiTYPER
Differentially methylated regions identified by the array analysis were verified and independently validated using MassARRAY EpiTYPER assays (Sequenom). Genomic DNA was sodium bisulfite–treated using an EpiTect Bisulfite Kit (Qiagen). Primers were designed using EpiDesigner software and used to amplify DMRs: AKAP6 forward primer TTTTTTTTGTGTGTGGTATGTGG, reverse primer CAAAA TCAAATTAACCTATATCCACTCC; ARHGAP22 forward primer GGGTTTA TGTGGTTAGGGTTATTTT, reverse primer CTCCAACTCTACACTCCTCA AAAAC; BCL2L2 forward primer TGTTTTAAGTTGTTTGGAGTTAAAGG, reverse primer ACTTTATAACCTTTCTTTCCCTTCC; CRY2 forward primer ATTTTAGAGAGGGGAGGGGTAGTAT, reverse primer AACACCTATTAAC CAACAACATCAA; CTSZ forward primer TGTTTGTTATGGTTTTTGGGTT TAT, reverse primer AAACAACTCTCCAACCTTACTCTCC; CX3CL1 forward primer GTGGTAGGAGAGGAGGTTTTTGTAT, reverse primer ACCCTATT TATACCCAAATCAAACC; GATA3 forward primer GTGTGTGTGTATGAG TTTGGTTAAAG, reverse primer TCATACAAATAATAACACCAACTAAA; LRRC27 forward primer TGATGTGTTAATTTGTTTTTGAAATG, reverse primer ACTAACCCAACACACCACTATTTCT; MBL2 forward primer AGAT ATATTTGGGGGAAGAGGGAG, reverse primer CCAAACATCAAAAAACTC TCAACTC; MGAT1 forward primer AAGGGTTGTTGTTATGTGATTAGGA, reverse primer CCTAACTATACTCCCCACCAAATCT; NDRG1 forward primer TTTTTGAGTTATATTTGGAATGGGA, reverse primer AAAAATTCCTAAC AAAATTTTACCTACC; SBF1 forward primer GAGGAGGTTGGTTTTGGG TTAGTAG, reverse primer AATCAAAACTTCAAATAAAAACCCC; SLC47A2 forward primer TTATTTTTTAGATTAGATTGGAGGGG, reverse primer TA TTACCAAATTACCCCCAACAAAA. Forward primers were designed with a 10-mer tag (AGGAAGAGAG) and reverse primers designed with a T7-promoter tag (CAGTAATACGACTCACTATAGGGAGAAGGCT), as per the manufacturer’s guidelines. PCR products were then processed as previously described to determine methylation levels55.
Like the Illumina array, the MassARRAY system provides a methylation level between 0 (completely unmethylated) and 1 (fully methylated). CpGs overlapping silent peaks, outside the mass spectrometry analytical window (low or high mass), or lacking sufficient coverage (methylation level determined for <90% of samples) were filtered out before subsequent analysis. For experimental verification, Pearson’s correlation (r) was used to evaluate concordance between methylation levels yielded by the array analysis and Sequenom assays. For validation experiments, two one-sided Student’s t-tests and a Fisher’s method P-value were determined as above for adjacent CpGs within an amplicon.
Gene expression analysis
Approximately 250 ng of total RNA for 20 multiple sclerosis and 11 control samples were used for library construction by the TruSeq RNA Sample Prep Kit (Illumina) according to manufacturer’s instructions. RNA-seq libraries were sequenced using the Illumina HiSeq 2000 instrument as per the manufacturer’s instructions. The RNA-seq data were analyzed as previously described56. Briefly, high-quality reads were aligned to the human reference genome (hg18), RefSeq exons, splicing junctions and contamination databases (ribosome and mitochondria sequences) using the BWA alignment algorithm57. The read count for each RefSeq transcript was extracted using uniquely aligned reads to exon and splicing-junction regions for each transcript. Transcripts were filtered for a minimum read count of 10 in at least 90% of the samples. The raw read counts were inputted into DESeq2 version 1.0.16 (ref. 58) for calculation of normalized signal for each transcript and to ascertain differential gene expression with associated P values (Wald test). The P value for each DMR was compared against the P value from the RNA-seq data for corresponding genes (see above for DMR-to-gene association) by plotting a quadrant plot where the quadrants represent a 2 × 2 combination of P values for hypo- or hyper-methylated DMRs and up- or downregulated genes.
For NanoString nCounter analysis of gene expression, 100 ng of total RNA was hybridized with a custom NanoString code set: ALDH3A1: TACCTGGACAAG GATCTGTACCCAGTAATCAATGGGGGTGTCCCTGAGACCACGGAGCT GCTCAAGGAGAGGTTCGACCATATCCTGTACACGGGCAGCA, ATP11A: ATGCCATGAACCAGTGTCCTGTTCATTTCATTCAGCACGGCAAGCTCG TTCGGAAACAAAGTCGAAAGCTGCGAGTTGGGGACATTGTCATGGTT AAGGA, CCR6: CTTTAACTGCGGGATGCTGCTCCTGACTTGCATTAGCA TGGACCGGTACATCGCCATTGTACAGGCGACTAAGTCATTCCGGCTCC GATCCAGAACACTA, CREB5: ATCTGATGAATCCCAGGAGTGGAGCAAG AGGCAGATTTTGGACACGGTTATGAGAATGACAGAAACTGCCTAAAG CATTTATGCTCTGGCATTCGTCCCT, CTSZ: GGACACCACATATATAAAC CATGTCGTTTCTGTGGCTGGGTGGGGCATCAGTGATGGGACTGAGTA CTGGATTGTCCGGAATTCATGGGGTGAACCATGG, GABRA5: CTGGGC AACGTATTTGAATAGGGAGCCGGTGATAAAAGGAGCCGCCTCTCCAA AATAACCGGCCACACTCCCAAACTCCAAGACAGCCATACTTCCAGCG, NAV2: ACCTAGTGCTGCCTGATTGGTGAACATTGACTTCAAGTAGCATA GCCCTTGTGTGACTCACAACTCCGTGTCCTTCCTAAAGTTTCGGGAAG CAGGGTTG, NDRG1: CGCCTACATCCTAACTCGATTTGCTCTAAACAAC CCTGAGATGGTGGAGGGCCTTGTCCTTATCAACGTGAACCCTTGTGC GGAAGGCTGGATGGACTGG, PGK1: GCAAGAAGTATGCTGAGGCTGTC ACTCGGGCTAAGCAGATTGTGTGGAATGGTCCTGTGGGGGTATTTGA ATGGGAAGCTTTTGCCCGGGGAACCAAAGC, POLR2A:TTCCAAGAAG CCAAAGACTCCTTCGCTTACTGTCTTCCTGTTGGGCCAGTCCGCTCGA GATGCTGAGAGAGCCAAGGATATTCTGTGCCGTCTGGAGCAT, RPL19: CCAATGCCCGAATGCCAGAGAAGGTCACATGGATGAGGAGAATGAGG ATTTTGCGCCGGCTGCTCAGAAGATACCGTGAATCTAAGAAGATCGAT CGCCA, RPLP0: CGAAATGTTTCATTGTGGGAGCAGACAATGTGGGCTC CAAGCAGATGCAGCAGATCCGCATGTCCCTTCGCGGGAAGGCTGTGG TGCTGATGGGCAAGAA. Sample processing and mRNA quantifications were performed according to manufacturer’s protocols, as described previously59. A two-tailed Student’s t-test was performed to assess statistical differences between the average values in each group.
For qRT-PCR, RNA was reverse transcribed with qScript cDNA Supermix (Quanta, 95048) and qRT-PCR was performed using Perfecta Sybr Fast Mix Rox 1250 (Quanta, 101414-278) at the Mount Sinai Shared Resource Facility. Primers used for quantitative PCR: AIFM2 forward primer ACGGTTCATCGTGGTGGTG, reverse primer TTGGGAGTGAATGAGAGTGACC; ATP1A1 forward primer AGGTCTTTGTAACAGGGCAGTG, reverse primer CTGCAACTGCCCG CTTAAG; BCL2L2 forward primer TGACTGGATCCACAGCAGTG, reverse primer TCAGCACTGTCCTCACTGATG; CTSZ forward primer CGCAA TGTGGATGGTGTCAAC, reverse primer ACGCTCCCTTCCTCTTGATG; DHX32 forward primer GCCACTGTGACTTCATGAACAG, reverse primer GATTTCCATCATTATCCAGTGC; GAPDH forward primer TGTTGCC ATCAATGACCCCTT, reverse primer CTCCACGACGTACTCAGCG; HAGHL forward primer ATGTACCTGGTCATCGAGGAG, reverse primer CACAGCGGTCAGAGACACC; RPLP0 forward primer GCGACCTGGAA GTCCAAC, reverse primer GTCTGCTCCCACAATGAAAC; SBF1 forward primer CGGACTACTTCGTGCTGGTG, reverse primer TTGTCCTCCC AGTCCTTCTC. After normalization to the geometric mean of DHX32, GAPDH and RPLP0, the average values for each transcript were calculated as based on the values obtained in all the samples included for each condition. A two-tailed Student’s t-test was performed to assess statistical differences between the average values in each group.
Gene ontology analysis and data set signature comparison
To identify enriched gene functions associated with the DMRs, we computed hypergeometric P values for over-representation of each biological process gene ontology (GO) category. For the annotation, genome-wide annotation for human, org.Hs.eg.db, was used in the Bioconductor GOstats package.
Differentially expressed genes identified by RNA-seq (P < 0.05, Wald test) were compared with genes associated with DMRs or with two previously published multiple sclerosis gene expression data sets49,50. The significance of their overlaps was measured by Fisher’s exact test using all Entrez genes as the background.
Immunohistochemistry
Five-micrometer frozen sections were stained with hematoxylin and eosin or with Luxol fast blue to assess specimen quality, presence of infiltrates and myelin content. Immunohistochemical staining was performed at the Mount Sinai Shared Resource Facility with an avidin-biotin technique (Vector Labs). After fixation in ice-cold acetone for 10 min, intrinsic peroxidase activity was blocked by incubation with 3% H2O2 in PBS for 15 min. Antigen retrieval was achieved with microwave pretreatment using citric acid buffer (pH 6.0). Nonspecific antibody binding was inhibited with whole horse serum (MP Biomedicals) and 2% BSA in PBS for 1 h before incubation with rabbit polyclonal anti-CTSZ (1:200, antibodies-online ABIN761561), mouse monoclonal anti-HLA-DR (1:100, Novus Biologicals NB100-78094), rabbit polyclonal anti-NDRG1 (1:100, Novus Biologicals NBP1-95851) or rabbit polyclonal anti-Olig2 (1:100, Abcam ab81093). An anti-rabbit or anti-mouse biotinylated immunoglobulin secondary antibody (1:200, Vector Labs) was applied and staining developed with Vectastain ABC Reagent and peroxidase substrate solution. Ten fields of view at 40× magnification were imaged randomly throughout the NAWM for each sample and a minimum of 500 cells were counted for each sample. The percentage of OLIG2-positive cells was determined and Student’s t-test performed to identify no significant difference between control and multiple sclerosis samples.
Supplementary Material
Acknowledgments
We are grateful to all the members of the Casaccia and Sharp laboratory for technical help, to C. Watson for assistance with the CETS analysis, to F. Zhang and W. Zhang for advice and assistance with the RNA-seq alignment, to F. Lublin and G. John for critical reading of the manuscript and to P.L. De Jager (Brigham and Women’s Hospital), S. Baranzini (University of California at San Francisco) and N. Schaeren-Wiemers (University Hospital, Basel) for discussions. The work has been funded by Icahn School of Medicine seed funds and grants from the US National Institutes of Health (NIH) NINDS (R01NS052738-06 and R37NS042925-10) to P.C., from NIH NIDA (R01DA033660) and NIH NHGRI (R01HG006696) to A.J.S., from NIH NIMH (R01MH090948-01) to J.Z., from NIH NINDS (R01NS38667) to B.D.T. and from NIH NIA (P01AG02219), NIH NIMH (P50MH066392) and VA-MIRECC to V.H. J.L.H. is the recipient of NIH Fellowship F31NS077504-01 and a scholarship from the Foundation of the Consortium of Multiple Sclerosis Centers’ MS Workforce of the Future. The content is solely the responsibility of the authors and does not necessarily represent the official views of the NIH. We thank R. Reynolds and the UK Multiple Sclerosis Tissue Bank at Imperial College London (funded by the UK MS Society, grant no. 910/09) for the provision of multiple sclerosis tissue samples, as well as the Human Brain and Spinal Fluid Resource Center, Veterans Affairs West Los Angeles Healthcare Center, which is sponsored by NINDS, NIMH, National Multiple Sclerosis Society and Department of Veterans Affairs.
Footnotes
Accession codes. Gene Expression Omnibus: GSE40360.
Note: Any Supplementary Information and Source Data files are available in the online version of the paper.
AUTHOR CONTRIBUTIONS
J.L.H. isolated the DNA and RNA; designed and conducted the array, verification, validation and expression studies; and drafted the manuscript. P.G. and A.J.S. conducted statistical analyses and drafted the manuscript. T.H.T. performed the immunohistochemistry and M.J.D. assisted with the histology and immunohistochemistry analysis. S.Y. and J.Z. performed the gene ontology analysis. V.H. provided the second cohort of controls without neurological disease. R.D. and B.D.T. provided the second cohort of multiple sclerosis samples and expression analysis from a third cohort. P.C. conceived and designed the study and wrote the manuscript.
COMPETING FINANCIAL INTERESTS
The authors declare no competing financial interests.
Reprints and permissions information is available online at http://www.nature.com/reprints/index.html.
References
- 1.Hafler DA, et al. Risk alleles for multiple sclerosis identified by a genomewide study. N Engl J Med. 2007;357:851–862. doi: 10.1056/NEJMoa073493. [DOI] [PubMed] [Google Scholar]
- 2.Sawcer S, et al. Genetic risk and a primary role for cell-mediated immune mechanisms in multiple sclerosis. Nature. 2011;476:214–219. doi: 10.1038/nature10251. [DOI] [PMC free article] [PubMed] [Google Scholar]
- 3.Patsopoulos NA, et al. Genome-wide meta-analysis identifies novel multiple sclerosis susceptibility loci. Ann Neurol. 2011;70:897–912. doi: 10.1002/ana.22609. [DOI] [PMC free article] [PubMed] [Google Scholar]
- 4.Ebers GC. Environmental factors and multiple sclerosis. Lancet Neurol. 2008;7:268–277. doi: 10.1016/S1474-4422(08)70042-5. [DOI] [PubMed] [Google Scholar]
- 5.Esteller M. Epigenetics in cancer. N Engl J Med. 2008;358:1148–1159. doi: 10.1056/NEJMra072067. [DOI] [PubMed] [Google Scholar]
- 6.Amir RE, et al. Rett syndrome is caused by mutations in X-linked MECP2, encoding methyl-CpG-binding protein 2. Nat Genet. 1999;23:185–188. doi: 10.1038/13810. [DOI] [PubMed] [Google Scholar]
- 7.Hansen RS, et al. The DNMT3B DNA methyltransferase gene is mutated in the ICF immunodeficiency syndrome. Proc Natl Acad Sci USA. 1999;96:14412–14417. doi: 10.1073/pnas.96.25.14412. [DOI] [PMC free article] [PubMed] [Google Scholar]
- 8.Dempster EL, et al. Disease-associated epigenetic changes in monozygotic twins discordant for schizophrenia and bipolar disorder. Hum Mol Genet. 2011;20:4786–4796. doi: 10.1093/hmg/ddr416. [DOI] [PMC free article] [PubMed] [Google Scholar]
- 9.Baranzini SE, et al. Genome, epigenome and RNA sequences of monozygotic twins discordant for multiple sclerosis. Nature. 2010;464:1351–1356. doi: 10.1038/nature08990. [DOI] [PMC free article] [PubMed] [Google Scholar]
- 10.Bock C, et al. DNA methylation dynamics during in vivo differentiation of blood and skin stem cells. Mol Cell. 2012;47:633–647. doi: 10.1016/j.molcel.2012.06.019. [DOI] [PMC free article] [PubMed] [Google Scholar]
- 11.Mastronardi FG, et al. Increased citrullination of histone H3 in multiple sclerosis brain and animal models of demyelination: a role for tumor necrosis factor-induced peptidylarginine deiminase 4 translocation. J Neurosci. 2006;26:11387–11396. doi: 10.1523/JNEUROSCI.3349-06.2006. [DOI] [PMC free article] [PubMed] [Google Scholar]
- 12.Pedre X, et al. Changed histone acetylation patterns in normal-appearing white matter and early multiple sclerosis lesions. J Neurosci. 2011;31:3435–3445. doi: 10.1523/JNEUROSCI.4507-10.2011. [DOI] [PMC free article] [PubMed] [Google Scholar]
- 13.Sandoval J, et al. Validation of a DNA methylation microarray for 450,000 CpG sites in the human genome. Epigenetics. 2011;6:692–702. doi: 10.4161/epi.6.6.16196. [DOI] [PubMed] [Google Scholar]
- 14.Bock C. Analysing and interpreting DNA methylation data. Nat Rev Genet. 2012;13:705–719. doi: 10.1038/nrg3273. [DOI] [PubMed] [Google Scholar]
- 15.Hernandez DG, et al. Distinct DNA methylation changes highly correlated with chronological age in the human brain. Hum Mol Genet. 2011;20:1164–1172. doi: 10.1093/hmg/ddq561. [DOI] [PMC free article] [PubMed] [Google Scholar]
- 16.Numata S, et al. DNA methylation signatures in development and aging of the human prefrontal cortex. Am J Hum Genet. 2012;90:260–272. doi: 10.1016/j.ajhg.2011.12.020. [DOI] [PMC free article] [PubMed] [Google Scholar]
- 17.Irizarry RA, et al. The human colon cancer methylome shows similar hypo- and hypermethylation at conserved tissue-specific CpG island shores. Nat Genet. 2009;41:178–186. doi: 10.1038/ng.298. [DOI] [PMC free article] [PubMed] [Google Scholar]
- 18.Doi A, et al. Differential methylation of tissue- and cancer-specific CpG island shores distinguishes human induced pluripotent stem cells, embryonic stem cells and fibroblasts. Nat Genet. 2009;41:1350–1353. doi: 10.1038/ng.471. [DOI] [PMC free article] [PubMed] [Google Scholar]
- 19.Stadler MB, et al. DNA-binding factors shape the mouse methylome at distal regulatory regions. Nature. 2011;480:490–495. doi: 10.1038/nature10716. [DOI] [PubMed] [Google Scholar]
- 20.Sharp AJ, et al. DNA methylation profiles of human active and inactive X chromosomes. Genome Res. 2011;21:1592–1600. doi: 10.1101/gr.112680.110. [DOI] [PMC free article] [PubMed] [Google Scholar]
- 21.Noonan JP, McCallion AS. Genomics of long-range regulatory elements. Annu Rev Genomics Hum Genet. 2010;11:1–23. doi: 10.1146/annurev-genom-082509-141651. [DOI] [PubMed] [Google Scholar]
- 22.Sheffield NC, et al. Patterns of regulatory activity across diverse human cell types predict tissue identity, transcription factor binding, and long-range interactions. Genome Res. 2013;23:777–788. doi: 10.1101/gr.152140.112. [DOI] [PMC free article] [PubMed] [Google Scholar]
- 23.Guintivano J, Aryee MJ, Kaminsky ZA. A cell epigenotype specific model for the correction of brain cellular heterogeneity bias and its application to age, brain region and major depression. Epigenetics. 2013;8:290–302. doi: 10.4161/epi.23924. [DOI] [PMC free article] [PubMed] [Google Scholar]
- 24.Ebers GC, et al. Parent-of-origin effect in multiple sclerosis: observations in half-siblings. Lancet. 2004;363:1773–1774. doi: 10.1016/S0140-6736(04)16304-6. [DOI] [PubMed] [Google Scholar]
- 25.Ascherio A, Munger KL, Lunemann JD. The initiation and prevention of multiple sclerosis. Nat Rev Neurol. 2012;8:602–612. doi: 10.1038/nrneurol.2012.198. [DOI] [PMC free article] [PubMed] [Google Scholar]
- 26.Hedström AK, Baarnhielm M, Olsson T, Alfredsson L. Exposure to environmental tobacco smoke is associated with increased risk for multiple sclerosis. Mult Scler. 2011;17:788–793. doi: 10.1177/1352458511399610. [DOI] [PubMed] [Google Scholar]
- 27.Swank RL, Dugan BB. Effect of low saturated fat diet in early and late cases of multiple sclerosis. Lancet. 1990;336:37–39. doi: 10.1016/0140-6736(90)91533-g. [DOI] [PubMed] [Google Scholar]
- 28.von Geldern G, Mowry EM. The influence of nutritional factors on the prognosis of multiple sclerosis. Nat Rev Neurol. 2012;8:678–689. doi: 10.1038/nrneurol.2012.194. [DOI] [PubMed] [Google Scholar]
- 29.Ramagopalan SV, Dobson R, Meier UC, Giovannoni G. Multiple sclerosis: risk factors, prodromes, and potential causal pathways. Lancet Neurol. 2010;9:727–739. doi: 10.1016/S1474-4422(10)70094-6. [DOI] [PubMed] [Google Scholar]
- 30.Lim AL, et al. Epigenetic state and expression of imprinted genes in umbilical cord correlates with growth parameters in human pregnancy. J Med Genet. 2012;49:689–697. doi: 10.1136/jmedgenet-2012-100858. [DOI] [PubMed] [Google Scholar]
- 31.Bakulski KM, et al. Genome-wide DNA methylation differences between late-onset Alzheimer’s disease and cognitively normal controls in human frontal cortex. J Alzheimers Dis. 2012;29:571–588. doi: 10.3233/JAD-2012-111223. [DOI] [PMC free article] [PubMed] [Google Scholar]
- 32.Liu Y, et al. Epigenome-wide association data implicate DNA methylation as an intermediary of genetic risk in rheumatoid arthritis. Nat Biotechnol. 2013;31:142–147. doi: 10.1038/nbt.2487. [DOI] [PMC free article] [PubMed] [Google Scholar]
- 33.Ross AJ, et al. BCLW mediates survival of postmitotic Sertoli cells by regulating BAX activity. Dev Biol. 2001;239:295–308. doi: 10.1006/dbio.2001.0445. [DOI] [PubMed] [Google Scholar]
- 34.Principato GB, Rosi G, Talesa V, Bocchini V, Giovannini E. Purification of S-2-hydroxyacylglutathione hydrolase (glyoxalase II) from calf brain. Biochem Int. 1984;9:351–359. [PubMed] [Google Scholar]
- 35.Melotte V, et al. The N-myc downstream regulated gene (NDRG) family: diverse functions, multiple applications. FASEB J. 2010;24:4153–4166. doi: 10.1096/fj.09-151464. [DOI] [PubMed] [Google Scholar]
- 36.Yao M, Nguyen TV, Pike CJ. β-amyloid-induced neuronal apoptosis involves c-Jun N-terminal kinase-dependent downregulation of Bcl-w. J Neurosci. 2005;25:1149–1158. doi: 10.1523/JNEUROSCI.4736-04.2005. [DOI] [PMC free article] [PubMed] [Google Scholar]
- 37.Murphy B, et al. Bcl-w protects hippocampus during experimental status epilepticus. Am J Pathol. 2007;171:1258–1268. doi: 10.2353/ajpath.2007.070269. [DOI] [PMC free article] [PubMed] [Google Scholar]
- 38.Hu XL, Olsson T, Johansson IM, Brannstrom T, Wester P. Dynamic changes of the anti- and pro-apoptotic proteins Bcl-w, Bcl-2, and Bax with Smac/Diablo mitochondrial release after photothrombotic ring stroke in rats. Eur J Neurosci. 2004;20:1177–1188. doi: 10.1111/j.1460-9568.2004.03554.x. [DOI] [PubMed] [Google Scholar]
- 39.Cosker KE, Pazyra-Murphy MF, Fenstermacher SJ, Segal RA. Target-derived neurotrophins coordinate transcription and transport of bclw to prevent axonal degeneration. J Neurosci. 2013;33:5195–5207. doi: 10.1523/JNEUROSCI.3862-12.2013. [DOI] [PMC free article] [PubMed] [Google Scholar]
- 40.Chapman HA. Endosomal proteolysis and MHC class II function. Curr Opin Immunol. 1998;10:93–102. doi: 10.1016/s0952-7915(98)80038-1. [DOI] [PubMed] [Google Scholar]
- 41.Santamaría I, Velasco G, Pendas AM, Fueyo A, Lopez-Otin C. Cathepsin Z, a novel human cysteine proteinase with a short propeptide domain and a unique chromosomal location. J Biol Chem. 1998;273:16816–16823. doi: 10.1074/jbc.273.27.16816. [DOI] [PubMed] [Google Scholar]
- 42.Ratovitski T, Chighladze E, Waldron E, Hirschhorn RR, Ross CA. Cysteine proteases bleomycin hydrolase and cathepsin Z mediate N-terminal proteolysis and toxicity of mutant huntingtin. J Biol Chem. 2011;286:12578–12589. doi: 10.1074/jbc.M110.185348. [DOI] [PMC free article] [PubMed] [Google Scholar]
- 43.Kos J, Jevnikar Z, Obermajer N. The role of cathepsin X in cell signaling. Cell Adh Migr. 2009;3:164–166. doi: 10.4161/cam.3.2.7403. [DOI] [PMC free article] [PubMed] [Google Scholar]
- 44.Obermajer N, Doljak B, Jamnik P, Fonovic UP, Kos J. Cathepsin X cleaves the C-terminal dipeptide of alpha- and gamma-enolase and impairs survival and neuritogenesis of neuronal cells. Int J Biochem Cell Biol. 2009;41:1685–1696. doi: 10.1016/j.biocel.2009.02.019. [DOI] [PubMed] [Google Scholar]
- 45.Jevnikar Z, Obermajer N, Bogyo M, Kos J. The role of cathepsin X in the migration and invasiveness of T lymphocytes. J Cell Sci. 2008;121:2652–2661. doi: 10.1242/jcs.023721. [DOI] [PubMed] [Google Scholar]
- 46.Obermajer N, Jevnikar Z, Doljak B, Kos J. Role of cysteine cathepsins in matrix degradation and cell signalling. Connect Tissue Res. 2008;49:193–196. doi: 10.1080/03008200802143158. [DOI] [PubMed] [Google Scholar]
- 47.Wendt W, Zhu XR, Lubbert H, Stichel CC. Differential expression of cathepsin X in aging and pathological central nervous system of mice. Exp Neurol. 2007;204:525–540. doi: 10.1016/j.expneurol.2007.01.007. [DOI] [PubMed] [Google Scholar]
- 48.Beck H, et al. Cathepsin S and an asparagine-specific endoprotease dominate the proteolytic processing of human myelin basic protein in vitro. Eur J Immunol. 2001;31:3726–3736. doi: 10.1002/1521-4141(200112)31:12<3726::aid-immu3726>3.0.co;2-o. [DOI] [PubMed] [Google Scholar]
- 49.Graumann U, Reynolds R, Steck AJ, Schaeren-Wiemers N. Molecular changes in normal appearing white matter in multiple sclerosis are characteristic of neuroprotective mechanisms against hypoxic insult. Brain Pathol. 2003;13:554–573. doi: 10.1111/j.1750-3639.2003.tb00485.x. [DOI] [PMC free article] [PubMed] [Google Scholar]
- 50.Lindberg RL, et al. Multiple sclerosis as a generalized CNS disease–comparative microarray analysis of normal appearing white matter and lesions in secondary progressive MS. J Neuroimmunol. 2004;152:154–167. doi: 10.1016/j.jneuroim.2004.03.011. [DOI] [PubMed] [Google Scholar]
- 51.Xi Y, Li W. BSMAP: whole genome bisulfite sequence MAPping program. BMC Bioinformatics. 2009;10:232. doi: 10.1186/1471-2105-10-232. [DOI] [PMC free article] [PubMed] [Google Scholar]
- 52.Sun Z, et al. Batch effect correction for genome-wide methylation data with Illumina Infinium platform. BMC Med Genomics. 2011;4:84. doi: 10.1186/1755-8794-4-84. [DOI] [PMC free article] [PubMed] [Google Scholar]
- 53.Quinlan AR, Hall IM. BEDTools: a flexible suite of utilities for comparing genomic features. Bioinformatics. 2010;26:841–842. doi: 10.1093/bioinformatics/btq033. [DOI] [PMC free article] [PubMed] [Google Scholar]
- 54.Benjamini Y, Hochberg Y. Controlling the false discovery rate: a practical and powerful approach to multiple testing. J R Stat Soc Series B Stat Methodol. 1995;57:289–300. [Google Scholar]
- 55.Thompson RF, Suzuki M, Lau KW, Greally JM. A pipeline for the quantitative analysis of CG dinucleotide methylation using mass spectrometry. Bioinformatics. 2009;25:2164–2170. doi: 10.1093/bioinformatics/btp382. [DOI] [PMC free article] [PubMed] [Google Scholar]
- 56.Huber AK, et al. Genetically driven target tissue overexpression of CD40: a novel mechanism in autoimmune disease. J Immunol. 2012;189:3043–3053. doi: 10.4049/jimmunol.1200311. [DOI] [PMC free article] [PubMed] [Google Scholar]
- 57.Li H, Durbin R. Fast and accurate short read alignment with Burrows-Wheeler transform. Bioinformatics. 2009;25:1754–1760. doi: 10.1093/bioinformatics/btp324. [DOI] [PMC free article] [PubMed] [Google Scholar]
- 58.Anders S, Huber W. Differential expression analysis for sequence count data. Genome Biol. 2010;11:R106. doi: 10.1186/gb-2010-11-10-r106. [DOI] [PMC free article] [PubMed] [Google Scholar]
- 59.Geiss GK, et al. Direct multiplexed measurement of gene expression with color-coded probe pairs. Nat Biotechnol. 2008;26:317–325. doi: 10.1038/nbt1385. [DOI] [PubMed] [Google Scholar]
Associated Data
This section collects any data citations, data availability statements, or supplementary materials included in this article.