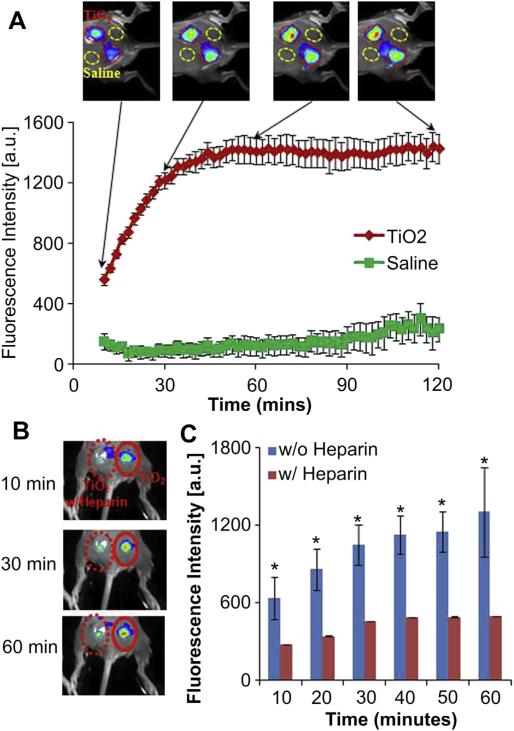
Fig. 3.
(A) The merged fluorescence and white light images (top panel) show the accumulation of fibrin-affinity probes at the TiO2 injection sites, but not the control site (saline injection). The mean fluorescence intensities at the TiO2 injection sites, but not saline injection sites, increased with time (bottom panel). (B) In vivo fluorescence imaging post-injection illustrates the diminishing accumulation of fibrin-affinity probes around TiO2 with heparin treatment in comparison with TiO2 alone within 1 h. (C) Quantification of fluorescence intensities within 1 h. Each mouse in test groups (n = 4) was treated with the probe (60 μL, 0.5 mg/mL). Error bars represent standard deviation (s.d.), * denotes p < 0.05. (For interpretation of the references to color in this figure legend, the reader is referred to the web version of this article.)

