Abstract
Heat shock protein 90 (Hsp90) has an important role in many cancers. Biochemical inhibitors of Hsp90 are in advanced clinical development for the treatment of solid and hematological malignancies. At the cellular level, their efficacy is diminished by the fact that Hsp90 inhibition causes activation of heat shock factor 1 (HSF1). We report a mechanism by which HSF1 activation diminishes the effect of Hsp90 inhibitors geldanamycin and 17-allylaminogeldanamycin (17-AAG, tanespimycin). Silencing HSF1 with siRNA or inhibiting HSF1 activity with KRIBB11 lowers the threshold for apoptosis in geldanamycin and 17-AAG-treated cancer cells. Autophagy also mitigates the actions of Hsp90 inhibitors. Blocking autophagy with 3-methyladenine (3-MA), bafilomycin A1, or beclin 1 siRNA also lower the threshold forapoptosis. Exploring a potential relationship between HSF1 and autophagy, we monitored autophagosome formation and autophagic flux in control and HSF1-silenced cells. Results show HSF1 is required for autophagy in Hsp90 inhibitor-treated cells. The reduction in autophagy in observed HSF1-silenced cells correlates with enhanced cell death. We monitored the expression of genes involved in the autophagic cascade, showing HSF1 promotes autophagy. Sequestosome 1 (p62/SQSTM1), a protein involved in the delivery of autophagic substrates and nucleation of autophagosomes, is an HSF1-regulated gene. Gene silencing was used to evaluate the significance of p62/SQSTM1 in Hsp90 inhibitor resistance. Cells where p62/SQSTM1 was silenced showed a dramatic increase in sensitivity to Hsp90 inhibitors. Results highlight importance of HSF1 and HSF1-dependent p62/SQSTM1 expression in resistance Hsp90 inhibitors, revealing the potential of targeting HSF1 to improve the efficacy of Hsp90 inhibitors in cancer.
Keywords: autophagy, HSF1, Hsp90, p62/SQSTM1, cancer
1. Introduction
Heat shock protein 90 (Hsp90) is a molecular chaperone that regulates the stability and function of a diverse range of client proteins. In normal cells, Hsp90 is involved in protein folding and cellular homeostasis. However, in tumor cells it supports the expression of oncogenes, inhibits cell death processes and drives tumorigenesis [1, 2]. For this reason, Hsp90 has been aggressively pursued as a chemotherapeutic target and Hsp90 inhibitors represent an emerging class of anticancer drugs. Several agents are now in advanced clinical trials for breast cancer, multiple myeloma, lymphoma and prostate cancer [3–8].
By disrupting the interactions of Hsp90 with a range of client proteins, Hsp90 inhibitors exert cytotoxic effects on tumor cells at low- to mid-nanomolar concentrations. Despite their targeted nature and high potency, the use of Hsp90 inhibitors as chemotherapeutics is impaired by the activation of heat shock factor 1 (HSF1), which is a tumor-promoting transcription factor. This is because Hsp90 binds to and represses HSF1 activity under non-stressed conditions [9]. Hsp90 inhibitors disrupt the Hsp90-HSF1 complex, resulting in the nuclear translocation of HSF1 and expression of target genes. This is critical because HSF1 features in several hallmarks of cancer, including malignant transformation, proliferation and enhanced cell survival [10]. Accordingly, high expression of HSF1 is a poor prognostic indicator in several cancers [11–13]. Also, HSF1 is known to mediate resistance to chemotherapeutics, including the platinum-based agents cisplatin and carboplatin [14, 15]. Here we show that HSF1 also drives resistance to the prototypic Hsp90 inhibitors geldanamycin and 17-allylamino-geldanamycin (17-AAG, tanespimycin) and define an underlying mechanism.
Autophagy is a homeostatic process that, like HSF1, is exploited by cancer cells to promote growth and survival under adverse conditions. Autophagy is a highly-regulated pathway that results in the degradation of macromolecules and organelles. During autophagy, cellular components destined for removal are sequestered within double membrane vesicles called autophagosomes. Their subsequent fusion with lysosomes leads to the degradation of their contents by lysosomal acid hydrolases. In addition to removing cellular aggregates and damaged organelles, autophagy also generates recycled building blocks for the synthesis of new macromolecules and provides an alternative energy source for cell survival under conditions of metabolic stress [16]. Furthermore, like HSF1, autophagy has been shown to mediate resistance to a variety of chemotherapeutic drugs, including doxorubicin, melphalan, cisplatin, 5-fluorouracil and vincristine [17–19].
Since both processes promote cancer cell viability and chemoresistance, we hypothesized that autophagy and HSF1-mediated gene expression are functionally related. We therefore utilized several approaches, including siRNA, biochemical inhibitors (of both HSF1 and autophagy), and high-content imaging. Together, our data illustrate how HSF1 expression is critical for supporting autophagic flux and promoting cell survival following treatment with Hsp90 inhibitors. Our results also underscore the possible utility of suppressing HSF1 as a means to improve the therapeutic efficacy of Hsp90 inhibitors.
2. Materials and Methods
2.1 Cell culture and treatment
RKO, A549 and MCF-7 cell lines were all obtained from American Type Culture Collection (ATCC). RKO were cultured in RPMI 1640 supplemented with 10% fetal bovine serum (Atlas), 1% antibiotic/antimycotic (Thermo), and 25 mM HEPES buffer (Life Technologies). Cells were maintained in a humidified incubator at 37°C at 5% CO2 for no more than 30 passages. A549 and MCF-7 were cultured as above in DMEM. The Hsp90 inhibitors geldanamycin and 17-Nallylamino-17-demethoxygeldanamycin (17-AAG) were obtained from Sigma-Aldrich. KRIBB11, 3-methyledenine (3-MA) and Bafilomycin A1 were obtained from Calbiochem. For cell culture treatments, test compounds were dissolved in dimethyl sulfoxide (DMSO) and added to culture media for a final concentration of 0.1% DMSO. For vehicle control, 0.1% DMSO alone was used.
2.2 Viability assays
Cells were seeded in 96-well plates at a density of 7.5 × 10³ per well, allowed to adhere overnight, then treated with 0.1% DMSO (vehicle control) or test compounds geldanamycin, 17-AAG or KRIBB11 at concentrations indicated in the text. After 48 h, cells were washed once with phosphate-buffered saline (PBS), then 2 µM Calcein-AM (Molecular Probes) in PBS was added and incubated at room temperature for 30 minutes. Fluorescence was read using a BioTek Synergy MX multiwell plate reader with λex = 494 nm, λem = 517 nm. Data points represent mean values of Calcein-AM fluorescence normalized to vehicle-treated (0.1% DMSO) control. Error bars are standard deviations for n = 8 samples.
2.3 siRNA transfections
Cells were seeded at 25% confluence in 10 cm dishes. After adhering overnight, the cells were washed once with PBS and media was replaced with OptiMEM (Life Technologies). Transfections were performed using 0.2 nmol of either negative control siRNA (Stealth MED GC #1, Life Technologies); HSF1: 5’-UGC ACC AGC UGC UUC CCU GAA UCC G-3’; Beclin 1: 5’-UAA UCU AGG AGA GGA GCC AUU AU U-3’; Hsp70-1: 5’-CAG AAG UGU CAA GAG GUC AUC UCG U-3’; or p62/SQSTM1: 5’-GAG GAA UUG ACA AUG GCC AUG UCC U-3’, and 10 µl Lipofectamine 2000 (Life Technologies). Cells were split after 24 h at a ratio of 1:4, then transfected a second time the following day. Cells were again split, allowed 24 h to adhere then treated as indicated.
2.4 Luciferase assay
For monitoring HSF1-dependent gene expression, a firefly luciferase reporter construct was generated by cloning five tandem repeats of the consensus heat shock element (HSE; TTCnnGAA) into the plasmid pGL4.27 (pGL4.27-HSE). As a control, cells were co-transfected with a plasmid that constitutively expresses Renilla luciferase (pRL-SV40). Transient transfections of reporter constructs were performed using Lipofectamine 2000 in Opti-MEM. Analysis of luciferase was performed using the Dual-Glo Luciferase Assay System (Promega) following manufacturer’s instructions.
2.5 GFP constructs and transfections
For visualizing autophagosomes, an expression construct containing the human LC3B gene fused at 5’ end to the GFP gene (pSELECT-GFP-LC3) and control plasmid expressing GFP alone (pSELECT-NGFP-zeo) were both obtained from InvivoGen. For stable transfections of GFPLC3B and NGFP control, cells at 70% confluence in 10 cm dishes were transfected with either the pSELECT-GFP-LC3 construct or control pSELECT-NGFP-zeo using Lipofectamine 2000 in Opti-MEM. After 24 h, serial dilutions of transfected cells were split into 96 well plates containing 250 µg/ml of zeocin in RPMI 1640. Stable clones were selected for 3 weeks prior to conducting experiments.
2.6 Fluorescence microscopy
Cells stably expressing either the GFP-LC3 or NGFP control plasmids were seeded on 384-well plates and allowed to adhere overnight in RPMI media containing 250 µg/ml of zeocin. Cells at 60% confluence were treated with 0.1% DMSO (vehicle control) or test compounds geldanamycin or 17-AAG at concentrations indicated in the text. After 8 h, cells were stained with 1 nM Hoechst 33342 (nuclear stain) for 30 min at 37°C. Cells were visualized using the Operetta High Content Imaging System (Perkin Elmer) at 40× magnification under excitation/emission filters 591/618 nm (GFP) and 350/461 nm (Hoechst 33342). The resulting images were analyzed using Columbus software (Perkin Elmer) and autophagosomes were quantified by counting the number of spots per cell. Data represent mean values of puncta per cell for 4,000 cells per condition and error bars represent standard deviations. Statistical analysis was performed by t-Test assuming equal variances. Representative confocal microscopy images were also processed using Volocity 3D image analysis software (Perkin Elmer) to obtain composites of three stacked images.
2.7 Protein extraction and Western Blotting
Total proteins were collected using M-PER Lysis Buffer (Thermo) containing mammalian protease and phosphatase inhibitors (Sigma). Lysates were centrifuged at 14,000×g for 10 minutes and stored at −20°C. Protein concentrations were determined by Bradford assay (Bio-Rad). For Western blotting, equal quantities of protein were resolved by SDS-PAGE and then transferred onto a 0.2 µm nitrocellulose membrane (Bio-Rad). Membranes were blocked (Sea Block, Thermo) prior to incubation with primary antibodies. Following incubation with primary and secondary antibodies, proteins were detected using the LICOR Odyssey Infrared Imaging System. Primary antibodies were obtained from the following sources: Hsp40 from BD Biosciences; actin and p62/SQSTM1 from Santa Cruz Biotechnology; Phospho-Ser326 HSF1 from Fisher Scientific; LC3B, HSF1, Hsp90, ATG3, ATG5, ATG7, ATG12, Beclin 1 and PARP from Cell Signaling Technologies; Caspase-3 and cleaved Caspase-3 from AbCam. Hsp70 was obtained from both BD Biosciences (Fig. 2) and Cell Signaling Technologies (Fig. 7). All secondary antibodies were obtained from LiCor. Quantification of Western blots was performed by near-IR densitometry using Image Studio ver.2.0 software (LiCor). Western blot images shown are representative from n ≥ 3.
Fig. 2.
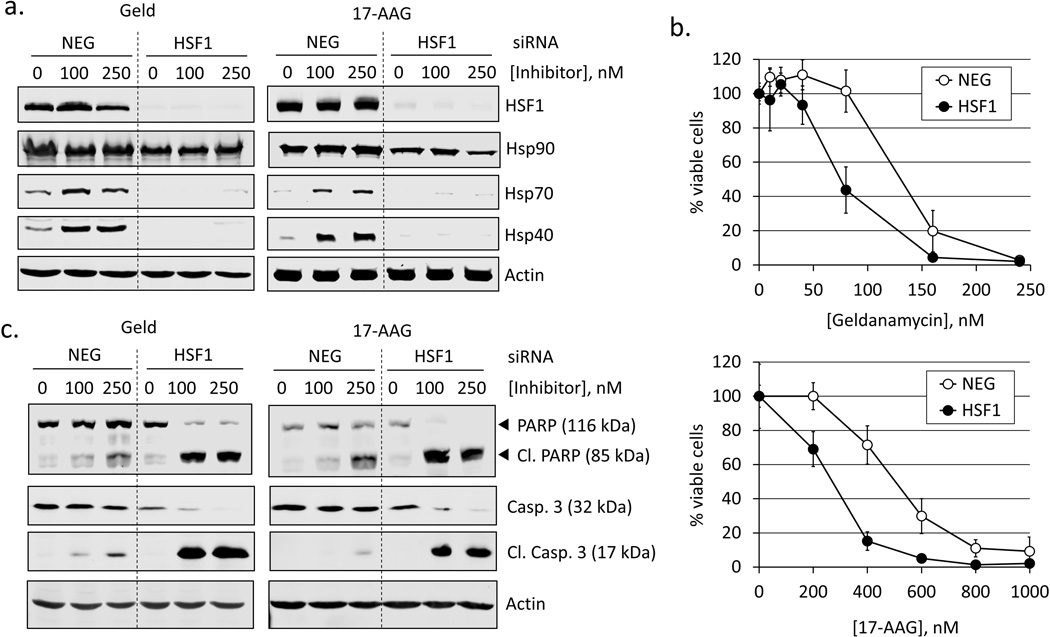
Silencing HSF1 attenuates Hsp40 and Hsp70 expression and sensitizes cells to Hsp90 inhibitors. a. RKO cells transfected with either a negative control (NEG) or HSF1 siRNA (HSF1) were treated with geldanamycin or 17-AAG (100, 250 nM) for 8 h and total proteins extracted. Western blot was performed for HSF1, Hsp90, Hsp70, Hsp40 and actin (loading control). Blots are representative of n = 3. b. siRNA-transfected RKO cells were treated for 24 h with geldanamycin or 17-AAG (100, 250 nM) and total proteins analyzed by Western blot for PARP and caspase-3 cleavage. c. Concentration-response curves for cell viability in siRNA-transfected RKO cells treated for 48 h with geldanamycin (10–250 nM) or 17-AAG (200–1000 nM). Data points represent mean values of Calcein-AM fluorescence normalized to vehicle-treated (0.1% DMSO) control. Error bars are standard deviations for n = 8.
Fig. 7.
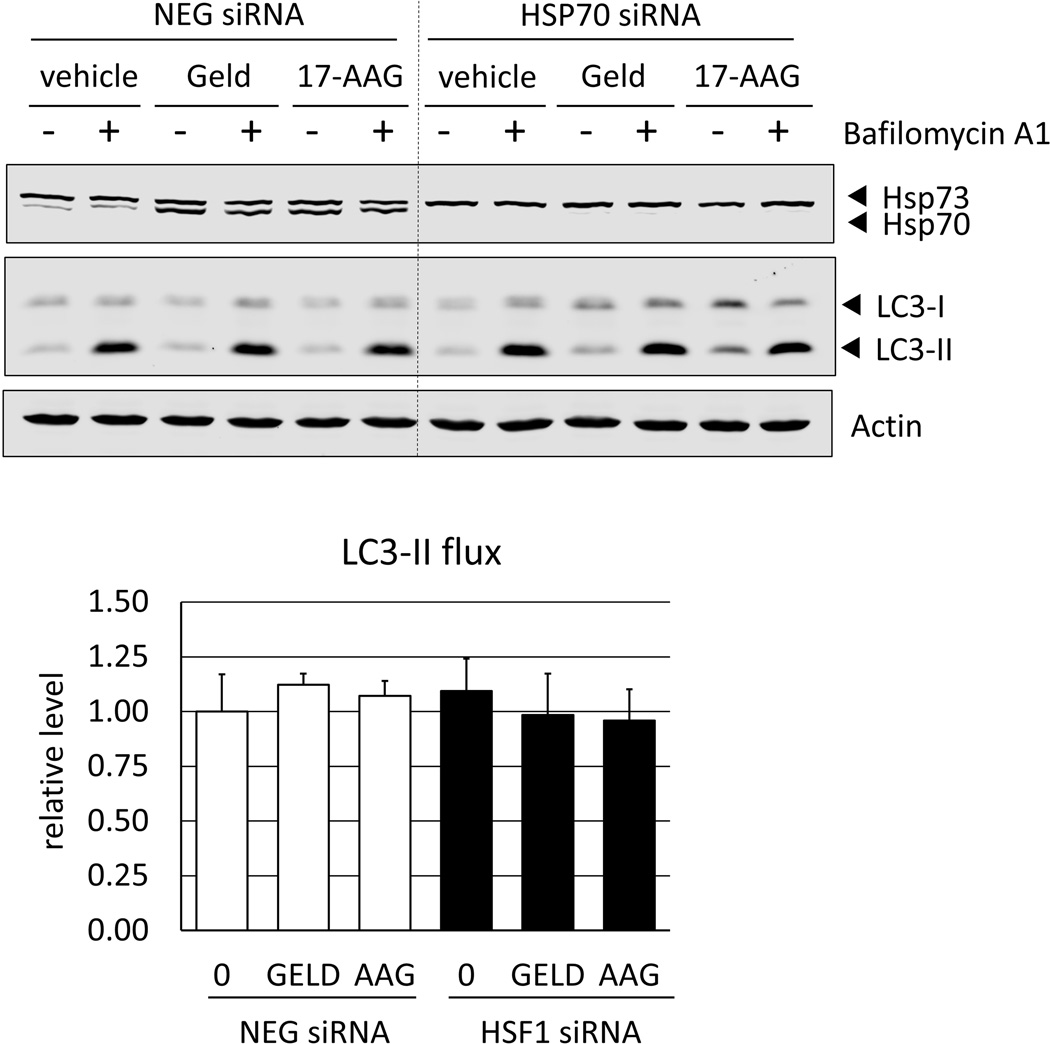
Hsp70 is dispensable for autophagic flux in Hsp90 inhibitor-treated cells. RKO cells transfected with either a negative control (NEG) or Hsp70 siRNA (HSP70) were treated with geldanamycin or 17-AAG (250 nM) for 8 h. Bafilomycin A1 (400 nM) was added for the last 4 h of treatment where indicated. LC3 flux was calculated as the difference in densitometry values in the presence (+) and absence (−) of bafilomycin A1, after normalization to actin (loading control). Hsp70 immunoblots show inducible Hsp70 (Hsp70-1) as well as constitutive Hsp73 (Hsc70), which is not HSF1-dependent. Flux values are presented in bar graph, relative to vehicle-treated control (NEG) cells. Error bars represent standard deviations for n = 4 experiments and Western blots shows representative data, showing no statistically significant (p<0.05) differences between vehicle (DMSO)-treated and inhibitor-treated samples.
2.8 RNA extraction and Real Time PCR
Cells were scraped and collected by centrifugation and cell pellets were resuspended in 1 ml of TRIzol (Sigma) and incubated at room temperature for 5 min. 200 µl of CHCl3 was added and mixed by vigorous shaking. After centrifugation at 14,000×g, the aqueous phase was transferred to a separate 1.5 ml tube and equal volume of 70% EtOH was added. Total RNA was then collected using RNeasy RNA collection kit (Qiagen). Digestion of trace DNA was performed by incubation with DNase using DNA free reagent (Ambion). RNA samples were quantified by absorbance at λ260 and λ280 and diluted in nuclease-free water to 100 ng/µl. 1 µg of total RNA was used in each reverse transcription reaction with iScript reagent (Bio-Rad). One-tenth of each reaction volume (2 µl) was used per well in subsequent real time PCR analysis, using iQ SYBR Green Supermix (Bio-Rad). Primer sequences used were HSPA1A (Hsp70-1): forward 5’-GCCAACAAGATCACCATCAC-3’, reverse 5’-GCTCAAACTCGTCCTTCTC-3’; DNAJA4 (Hsp40): forward 5’-AAT GCC CAT CTA CAA AGC AC-3’, reverse 5’-CAA AAC TCC TTC AGC TCC AC-3’; DNAJB1 (Hsp40): forward 5’-TGA AGA AGG GGT GGA AAG AAG-3’, reverse 5’-GGC AGG ATA AAT GAC ATC AGA G-3’; p62/SQSTM1: forward 5’-GAT CCG AGT GTG AAT TTC CTG-3’, reverse 5’-ATC CGA CTC CAT CTG TTC C-3’; 18S rRNA (control) forward 5’-GCC CGA GCC GCC TGG ATA CC-3’, reverse 5’-TCA CCT CTA GCG GCG CAA TAC G-3’. Real time reactions were performed using a Bio-Rad CFX96 Real Time thermocycler. Standard curves were generated by PCR of target sequences previously cloned into pGEM-T (Promega) in dilution series from 10−1 to 10−6 fmol/well. Data represented graphically show mean starting quantities in fmol per µg of total RNA. Error bars are standard deviations for n = 4 samples. For Real-time expression data showing “normalized expression”, target gene CT values (A) and GAPDH CT values (B) were both expressed as exponents of 2, and data represented as the ratio of 2A/2B, or 2(A−B). To obtain fold-change values, the average target gene CT value for experimental samples (X) was subtracted from the average GAPDH CT value (G) for experimental samples, and expressed as an exponent of 2, yielding the value 2(G−X). The average target gene CT value for control samples (X′) was subtracted from the average GAPDH CT value (G′) for control samples, and expressed as an exponent of 2, yielding the value 2(G′−X′). Fold change was then determined as the inverse ratio of normalized experimental to normalized control sample values, being expressed as 1/(2(G−X)/2(G′−X′)), or 1/(2(G−X) − (G′−X′)).
2.9 Autophagic flux
Flux was monitored by the addition of either bafilomycin A1 (400 nM) or 0.1% DMSO (vehicle) for 4 h. Protein extracts were analyzed by Western blot for LC3-II (autophagosome protein), p62 (autophagic substrate). Densitometry values from near-IR analysis were normalized to beta actin (loading control). Flux was determined by subtracting control (vehicle-treated) samples from bafilomycin A1-treated samples, thus reflecting the amount of LC3-II or p62 that accumulated in the 4 h following bafilomycin A1 addition. Data are represented graphically from n = 4 experiments, relative to NEG-siRNA control cells without Hsp90 inhibitor addition and error bars represent standard deviations.
3. Results
3.1 Hsp90 inhibitors activate HSF1 and promote HSF1-dependent gene expression
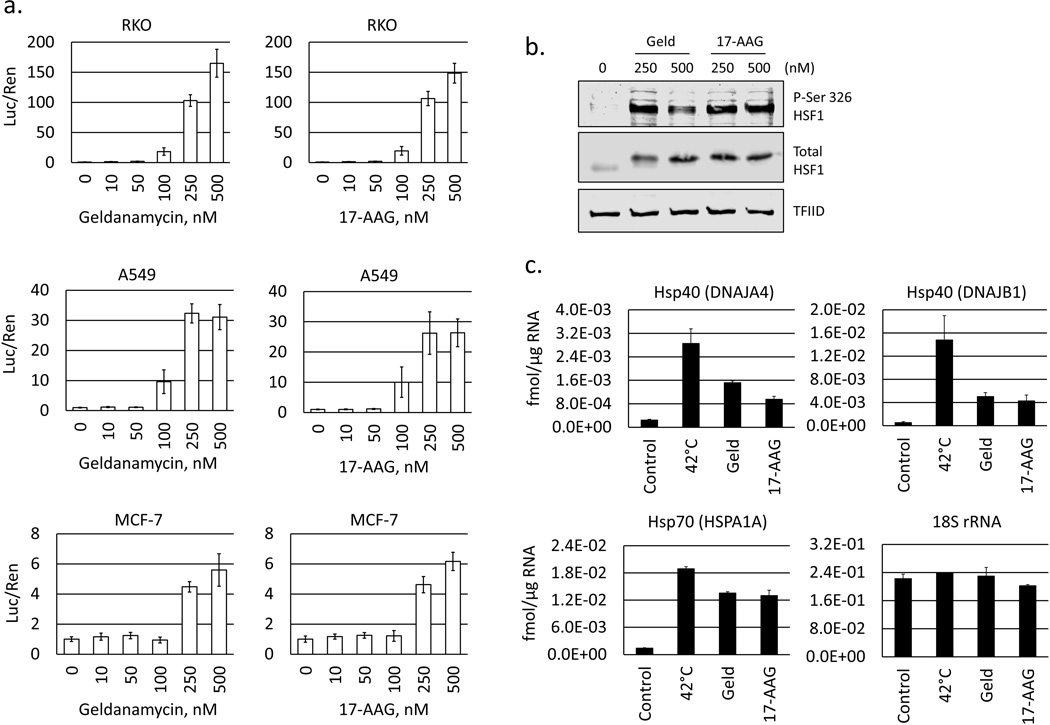
Luciferase reporter assays were used to monitor HSF1-mediated gene expression following treatment with the Hsp90 inhibitors geldanamycin or 17-AAG [20, 21]. A firefly luciferase construct (pGL4.27-HSE) was generated bearing five tandem repeats of a conserved HSF1binding element (TTCnnGAA). Three separate cell lines were transiently co-transfected with the pGL4.27-HSE reporter and a constitutive, SV40-driven Renilla construct (pRL-SV40). Following treatment with geldanamycin or 17-AAG, we observed a significant, concentration-dependent increase in normalized luciferase values (Firefly/Renilla) confirming the activation of HSF1 in Hsp90-inhibitor treated cells. Cell lines included RKO (colorectal cancer); A549 (non-small cell lung cancer); and MCF-7 (breast cancer). In all cell types geldanamycin and 17-AAG both caused a dramatic increase in normalized luciferase values, showing that HSF1 activation by Hsp90 inhibitors is not cell-line restricted (Fig. 1a). Because of the more robust activation demonstrated in the RKO cell line, these cells were used throughout this study.
Fig. 1.
Hsp90 inhibitors activate HSF1 and increase heat shock protein expression. a. HSF1 luciferase reporter construct (pGL4.27-HSE) and a Renilla control plasmid were co-transfected into RKO, A549 and MCF-7 then treated for 4 h with vehicle (0.1% DMSO), geldanamycin, or 17-AAG (10–500 nM). Bar graphs show mean ratios of luciferase to Renilla luminescence for each cell type, normalized to vehicle control. Error bars indicate standard deviations. b. Western blot of nuclear extracts from RKO cells treated for 1 h with geldanamycin or 17-AAG (250, 500 nM) for P-Ser-326 HSF1, total HSF1, and TFIID (loading control). c. Real-time PCR analysis of HSF1 target genes DNAJA4m DNAJB1, and HSPA1A in RKO cells at 37°C (control), 42°C (heat shock, 6 h), or treated at 37°C with geldanamycin or 17-AAG (250 nM) for 6 h. Bar graphs indicate mean starting quantities in fmol per µg of total RNA. Error bars are standard deviations for n = 4.
HSF1 protein is excluded from the nucleus during non-stressed conditions, but undergoes nuclear translocation when activated. To verify that Hsp90 inhibitors activate HSF1 in the RKO cell line, cells were treated with of geldanamycin or 17-AAG for 1 h at 250–500 nM. Nuclear proteins were extracted following drug treatment and analyzed by Western blot. The marked increase HSF1 levels in nuclear extracts confirms that Hsp90 inhibitors cause a rapid and robust translocation of HSF1 (Fig. 1b). The activation of HSF1 is also characterized by phosphorylation on various residues. Among these residues, Ser326 is believed to contribute to HSF1 transcriptional activity [22]. Accordingly, we observe a strong increase in pSer326 levels by Western blot in cells treated with Hsp90 inhibitors, suggesting an enhanced capacity for transactivation.
To determine the effects of geldanamycin and 17-AAG on the expression of known HSF1 target genes, total RNA was extracted and analyzed by quantitative real time PCR (qRT-PCR) for HSPA1A (Hsp70-1); DNAJA4 (Hsp40) and DNAJB1 (Hsp40). Levels of the 18S ribosomal RNA were simultaneously determined as a loading control. Transcripts of HSF1-target genes were increased 4 to 10-fold by Hsp90 inhibitor treatment, confirming an effect on gene expression profiles (Fig. 1c). As a positive control, gene expression was also analyzed following transient heat-shock (42°C), which is a strong activator of HSF1 transcriptional activity.
3.2 Silencing HSF1 attenuates target gene expression and enhances apoptosis in Hsp90 inhibitor-treated cells
To determine if HSF1 status affects the cellular response to Hsp90 inhibitors, siRNA was used to silence HSF1 expression and the response to Hsp90 inhibitors was evaluated. RKO cells were transfected with either a negative control (NEG) or HSF1-targeted (HSF1) siRNA and treated with geldanamycin or 17-AAG. To confirm silencing of HSF1, total protein extracts were analyzed for HSF1 expression by Western blot. Results show that HSF1 levels were significantly reduced in cells transfected with HSF1 siRNA. Silencing HSF1 suppressed the expression of target proteins. Hsp40 and Hsp70 were induced by Hsp90 inhibitors in control cells, but levels was significantly reduced in HSF1-silenced cells (Fig. 2a). Expression of Hsp90 was also examined by Western blot. Data show a high basal level of Hsp90 in control cells that was only moderately reduced by silencing HSF1. This agrees with the reported finding that Hsp90 expression is primarily regulated through the constitutive binding of HSF2 to the Hsp90 promoter, rather than by HSF1 [23]. These data also show that the molecular target of Hsp90 inhibitors remains expressed in HSF1-silenced cells.
To examine the degree to which HSF1 mediates chemoresistance to Hsp90 inhibitors we compared the concentration-response to drug treatment in control siRNA and HSF1-silenced cells. Cells were treated with varying concentrations of geldanamycin or 17-AAG for 48 h and viability was determined by fluorometric using Calcein-AM. Silencing HSF1 dramatically increased the toxicity of both geldanamycin and 17-AAG, evidenced by a leftward shift in the concentration-response curve (Fig. 2b). To confirm our findings, cells were also analyzed by Western blot for PARP and capsase-3 (Fig. 2c).
3.3 HSF1 inhibitor KRIBB11 synergizes with Hsp90 inhibitor geldanamycin
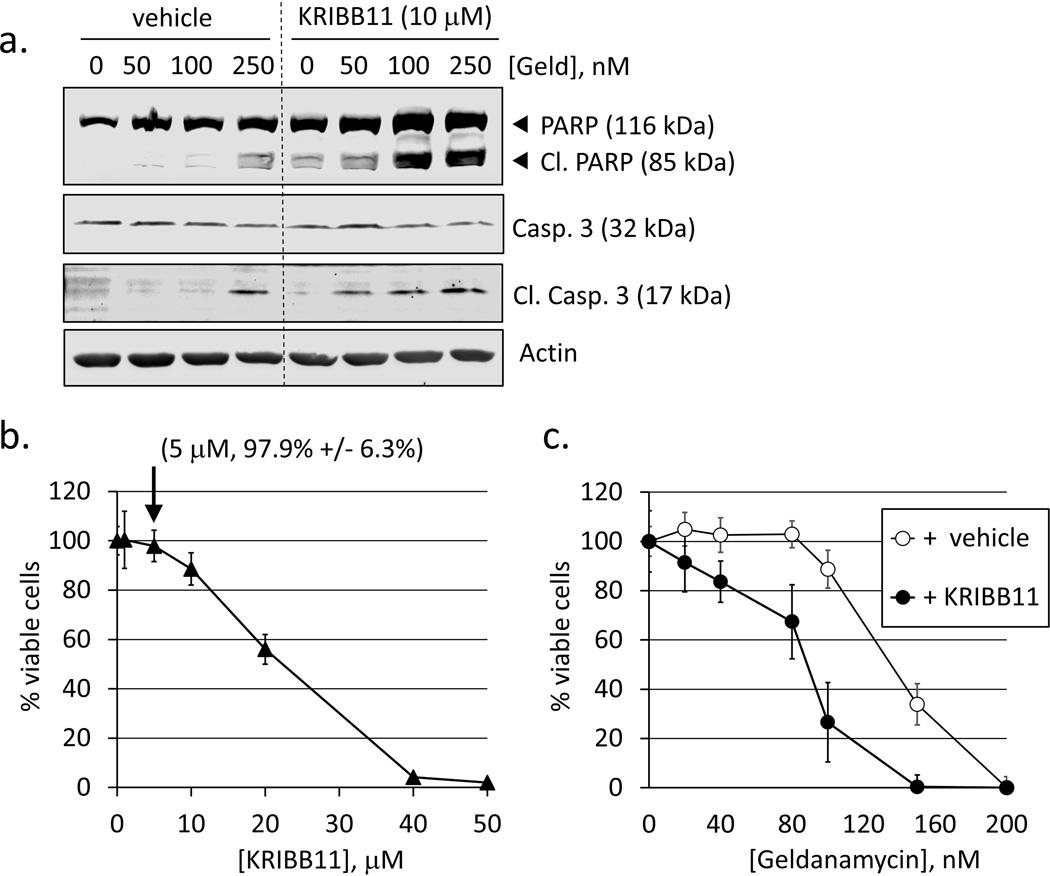
KRIBB11 is a recently discovered molecule that that blocks the recruitment of P-TEFb to the HSF1 transcriptional complex and thus prevents HSF1-mediated gene expression [24]. Therefore, inhibition of HSF1 with KRIBB11 is an alternative means to siRNA and a potential therapeutic agent. To determine if KRIBB11 also affects the sensitivity to Hsp90 inhibitors, RKO cells were treated with KRIB11 followed by various concentrations of geldanamycin. Total protein was extracted and analyzed using Western blot for PARP and caspase 3 cleavage as markers of apoptosis. PARP and caspase-3 cleavage was increased in cells treated with KRIBB11, demonstrating that HSF1 suppresses apoptotic cell death when treated with Hsp90 inhibitors (Fig. 3a). These results agree with our data obtained from HSF1-silenced cells. To evaluate the degree to which KRIBB11 synergized with the Hsp90 inhibitor geldanamycin, we first determined the toxicity of KRIBB11 alone. Incubating RKO with KRIBB11 for 48 h showed a toxic threshold of about 10 µM, and an IC50 of 20–30 µM (Fig. 3b). When a sub-toxic concentration of KRIBB11 was used in combination with geldanamycin, a significant leftward shift in the cell viability curve for geldanamycin was observed, showing a synergistic effect between KRIBB11 and the Hsp90 inhibitor (Fig. 3c).
Fig. 3.
Biochemical inhibition of HSF1 activity or inhibition autophagy both sensitize cells to geldanamycin-induced apoptotic cell death. a. RKO were pre-treated with vehicle (0.1% DMSO) or 10 nM KRIBB11 for 1 h followed by geldanamycin (50–250 nM) for 24 h. Total protein extracts were analyzed for PARP and caspase-3 cleavage. b. RKO were treated with KRIBB11 (1–50 nM) for 48 h. Data points represent mean values of Calcein-AM fluorescence normalized to vehicle-treated (0.1% DMSO) control. Error bars are standard deviations for n = 8. Label indicates % viability vs. control for 5 nM KRIBB11) c. Concentration-response curves for cell viability in RKO treated with geldanamycin (20–200 nM) + 0.1% DMSO (vehicle control, open circles) or geldanamycin (20–200 nM) + 5 nM KRIBB11. Error bars are standard deviations for n = 8.
3.4 Inhibition of autophagy enhances cell death in Hsp90 inhibitor-treated cells
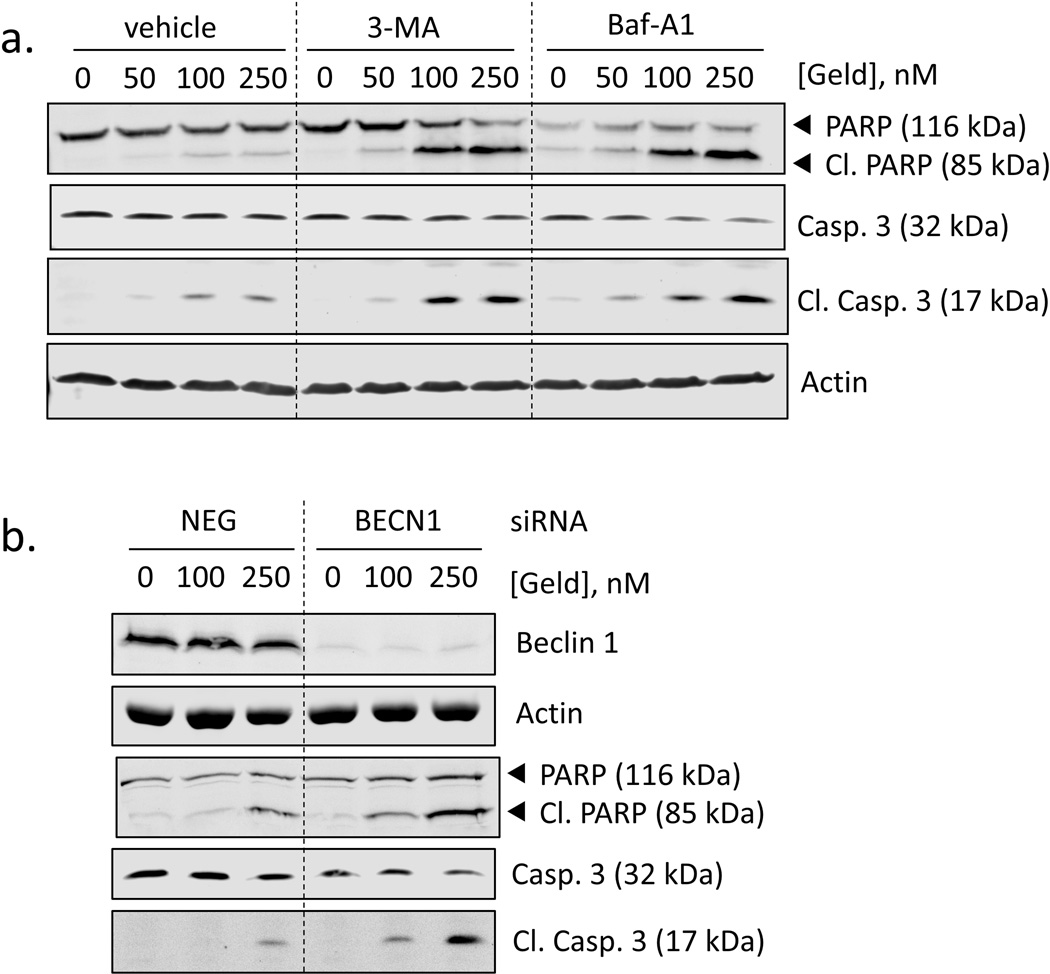
Autophagy either suppresses or facilitates cell death processes depending on the cellular context [16, 25]. To determine if autophagy promotes or suppresses the chemotherapeutic actions of geldanamycin, we used two different biochemical inhibitors of autophagy. We found that the autophagy inhibitors bafilomycin A1 and 3-MA both enhanced cell death by geldanamycin, resulting in higher levels of cleaved PARP and cleaved caspase-3 (Fig. 4a). Notably, in the presence of these inhibitors, the shift in the concentration-responses of PARP and caspase-3 cleavage is comparable to data from HSF1-silenced cells. These results indicate that autophagy suppresses the apoptotic cell death in geldanamycin-treated cells and suggest a possible role for HSF1 in autophagy. To further confirm that autophagy mitigates the toxic effects of Hsp90 inhibitors, we knocked down Beclin 1 with siRNA. Again, we see an increase in apoptotic cell death, indicated by enhanced PARP and caspase-3 cleavage in autophagy-deficient cells (Fig 4b).
Fig. 4.
Inhibition of autophagy sensitizes cells to geldanamycin. a. RKO were pre-treated for 1 h with vehicle (0.1% DMSO), 3-MA (2 mM), or bafilomycin A1 (400 nM) followed by geldanamycin (50–250 nM) for 24 h. b. Beclin 1 expression was silenced in RKO cells using siRNA then treated with geldanamycin (100–250 nM) for 24 h. Total protein extracts were analyzed for PARP and caspase-3 cleavage. Total protein extracts were analyzed for PARP and caspase-3 cleavage. Figures are representative of n = 3.
3.5 HSF1 is essential for autophagy in Hsp90 inhibitor-treated cells
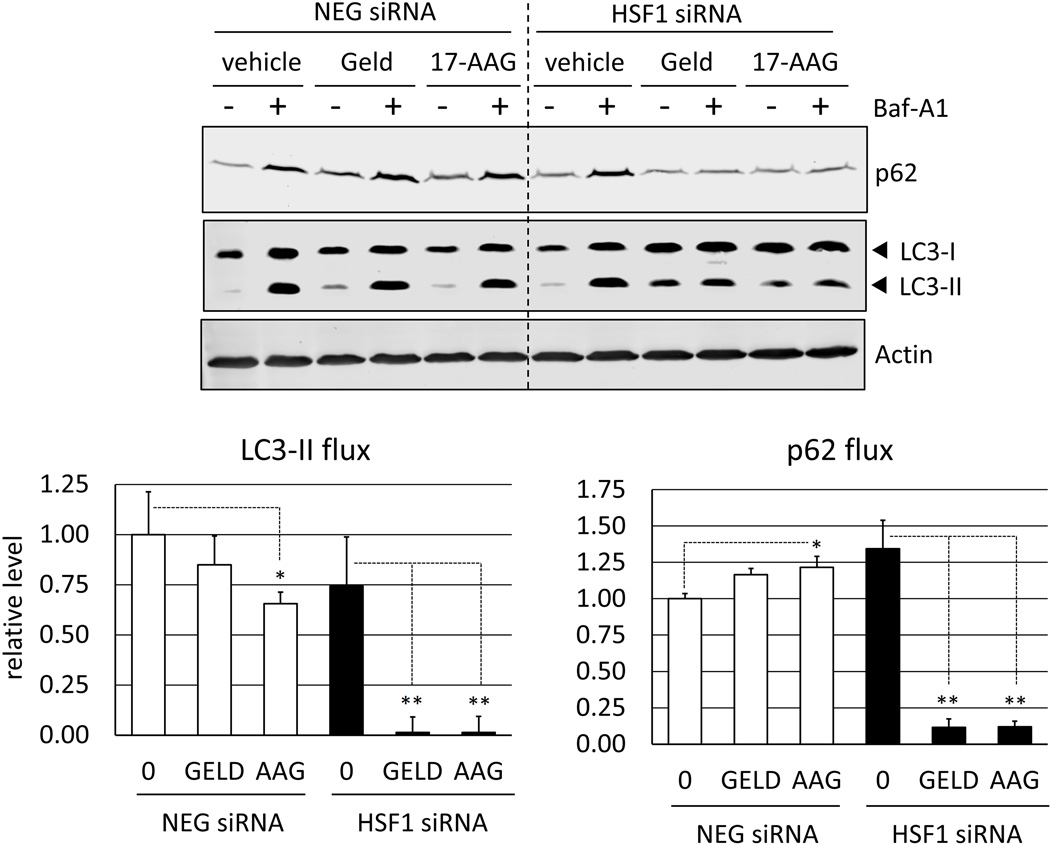
Having observed that bafilomycin A1 and 3-MA sensitize cancer cells to Hsp90 inhibitors, which is similar to the effect of silencing HSF1, we next evaluated the relationship between HSF1 and autophagy. Autophagic flux refers to the capacity of autophagy machinery over a designated time-period. To evaluate autophagic flux, the autophagy inhibitor bafilomycin A1 was used. Bafilomycin A1 inhibits vacuolar-type H+-ATPases, which blocks the maturation of autophagosomes and inhibits the digestion of autophagic substrates [26, 27]. Protein extracts were analyzed for relative levels of LC3-II (a component of autophagosomes) as well as p62 (SQSTM1, an autophagy-specific substrate). We observed a marked increase in LC3-II levels after 4 h of bafilomycin A1 treatment, representing the degree of autophagosome flux during this time period (Fig. 5). Bafilomycin A1 also caused a significant accumulation of p62, reflecting the turnover of autophagic substrate. Notably, the effect of geldanamycin and 17-AAG on autophagic flux was dependent on HSF1 status. In control cells, after 4 h treatment only modest effects on autophagic flux were observed. However, in HSF1-silenced cells, Hsp90 inhibitors caused an almost-complete attenuation in both autophagosome and substrate flux. This demonstrates a critical role for HSF1 in mediating autophagy in geldanamycin and 17-AAG-treated cancer cells, and illustrates that a deficiency in HSF1 causes a severe impairment in autophagic flux.
Fig. 5.
Autophagic flux in control and HSF1-silenced cells. RKO cells transfected with either a negative control (NEG) or HSF1 siRNA (HSF1) were treated with geldanamycin or 17-AAG (250 nM) for 8 h. Bafilomycin A1 (400 nM) was added for the last 4 h of treatment where indicated. LC3 and p62 flux was calculated as the difference in densitometry values in the presence (+) and absence (−) of bafilomycin A1, after normalization to actin (loading control). Flux values for LC3 and p62 are presented in bar graph, relative to vehicle-treated control (NEG) cells. Error bars represent standard deviations for n = 4 experiments and Western blots shows representative data. (*p<0.05; **p<0.0005 vs. DMSO control sample data)
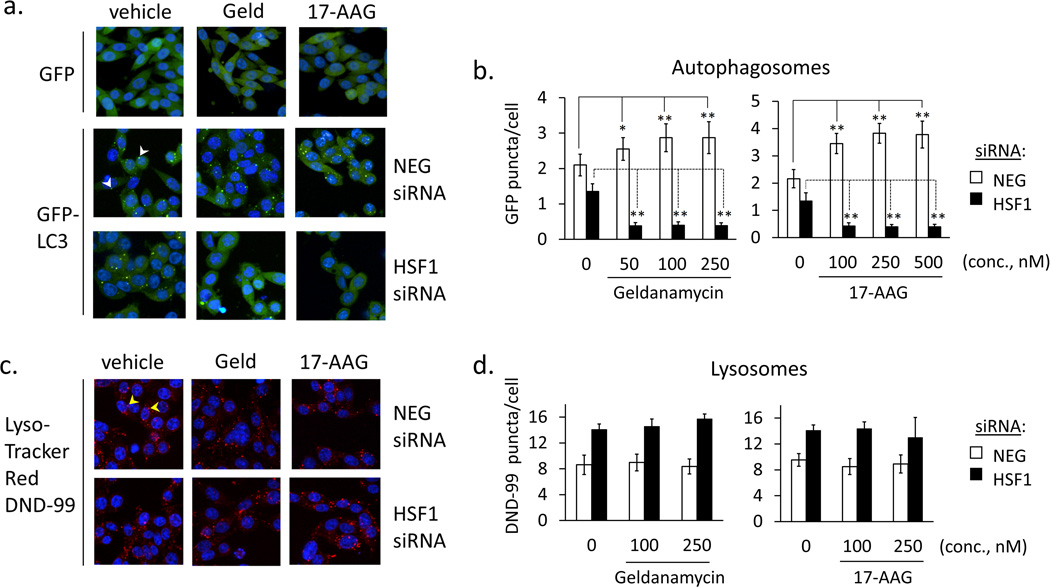
Autophagic flux is the measurement of the rate of autophagosome formation and substrate clearance through the pathway. It is dependent upon the biogenesis of lysosomes, as a source of digestive enzymes, and autophagosomes, which engulf and deliver substrates for digestion [28, 29]. It is important to distinguish effects on lysosomal activity from effects on autophagosome formation, since interfering with either process will compromise autophagy [30]. To evaluate the step at which HSF1 mediates autophagic flux we used high content fluorescence microscopy to monitor both autophagosome and lysosome formation in control and HSF1-deficient cells. To monitor autophagosomes LC3-GFP labeled puncta were counted in control and HSF1-silenced cells using Columbus software analysis of microscopic images.
Compared to control (NEG siRNA) cells, silencing HSF1 caused a moderate (approximate 25%) reduction in autophagosome counts, suggesting that HSF1 contributes to basal autophagosome biogenesis, even in the absence of chemotherapeutic challenge (Fig. 6a). This value is also in agreement with the level of reduction in basal flux (for LC3-II and p62) observed HSF1-silenced cells vs. control, above. After treating HSF1-silenced cells with Hsp90 inhibitors, we observed a dramatic reduction in autophagosome numbers. This effect was not observed in control-treated (vehicle, 0.1% DMSO) cells. These results show that HSF1 has a modest role in supporting basal autophagy, but is indispensable for autophagosome biogenesis following treatment with Hsp90 inhibitors. To monitor lysosomes, cells were stained with the acidophilic dye, LysoTracker Red DND-99 and also monitored by high content imaging. Interestingly, silencing HSF1 led to an increase in the number of lysosomes per cell. However, no significant differences in lysosome counts were observed between vehicle- and drug-treated cells, indicating that unlike autophagosomes, lysosome counts are not affected by Hsp90 inhibitors (Fig. 6b).
Fig. 6.
Autophagosome and lysosome levels in control and Hsp90 inhibitor-treated cells. a. Stable clones of RKO expressing GFP (negative control) or GFP-LC3 (NEG-siRNA or HSF1siRNA transfected) were treated with geldanamycin or 17-AAG (250 nM) for 8 h. Fluorescent images of Hoescht 33342-stained cells were collected by high content screening. Representative images were re-constructed from 3 confocal planes using PE Volocity software. b. Green fluorescent puncta (autophagosomes, white arrowheads) were counted for 4,000 nuclei using PE Columbus software. Bar graphs represent mean values and error bars represent standard deviations (*p<0.005; **p<0.001 vs. DMSO control sample data) c. siRNA-transfected RKO cells were treated with geldanamycin or 17-AAG (250 nM) for 4 h and stained with LysoTracker Red DND-99 and Hoescht 33342. d. Red fluorescent puncta (lysosomes, yellow arrowheads) were counted for 4,000 nuclei using PE Columbus software. Bar graphs represent mean values and error bars represent standard deviations, showing no statistically significant (p<0.05) differences between vehicle (DMSO)-treated and inhibitor-treated samples.
3.6 Inducible Hsp70 is dispensable for autophagic flux in Hsp90 inhibitor-treated cells
Recent data suggest that inducible Hsp70 (Hsp70-1; Hsp72), the product of the HSPA1A gene, has a role in regulating autophagosome formation during stress [31]. We therefore hypothesized that the reduction in Hsp70 expression that is observed in HSF1-silenced cells can explain why autophagy is compromised in this setting. To test this hypothesis, we used siRNA to silence Hsp70, challenged cells with Hsp90 inhibitors then evaluated the impact on autophagic flux of LC3-II. The knockdown of Hsp70 did not affect the degree of LC3-II turnover, specifically in either vehicle- or drug-treated cells (Fig. 7). These data illustrate that Hsp70 is not required for the maintenance of autophagy in Hsp90 inhibitor-treated cells.
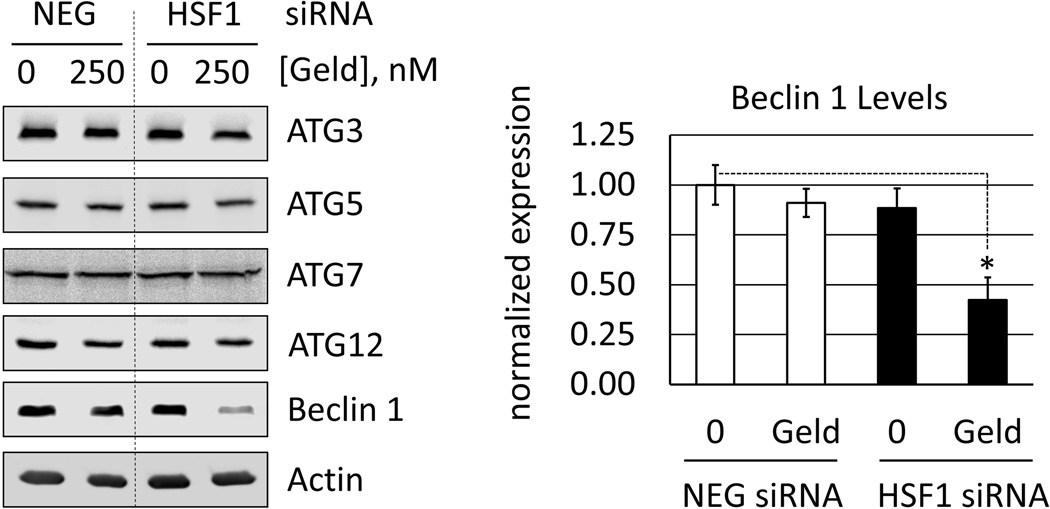
Other recent data suggest that the autophagy-related gene product, ATG7 links HSF1 expression to autophagy in breast cancer cells challenged with carboplatin [14]. To examine this possibility, we analyzed the expression of several ATG proteins in control and HSF1-silenced cells following drug treatment. Our results show no relationship between HSF1 and ATG7 levels (Fig. 8), which indicates to us that other mechanisms link HSF1 to autophagy in the context of Hsp90 inhibitor treatment. We did observe a moderate reduction in Beclin 1 expression in HSF1-silenced cells treated with geldanamycin, but we are unsure as to the significance of this effect with respect to cellular viability.
Fig. 8.
Expression of autophagy-related (ATG) proteins and Beclin 1 in control and HSF1silenced cells. RKO were transfected with negative control (NEG) or HSF1 siRNA (HSF1) and treated with vehicle (0.1% DMSO) or geldanamycin (250 nM) for 6 h. a. Total proteins were analyzed by Western blot. Images are representative from n = 3. b. Analysis of Beclin 1 expression level by Li-Cor Odyssey, normalized to actin (loading control) and displayed relative to NEG siRNA-transfected, DMSO-treated (control) cells. Bar graph represents mean normalized values and error bars represent standard deviations (* = p<0.001).
3.7 HSF1 is necessary for the expression of autophagy protein p62/SQSTM1; silencing p62/SQSTM1 sensitizes cells to Hsp90 inhibitors
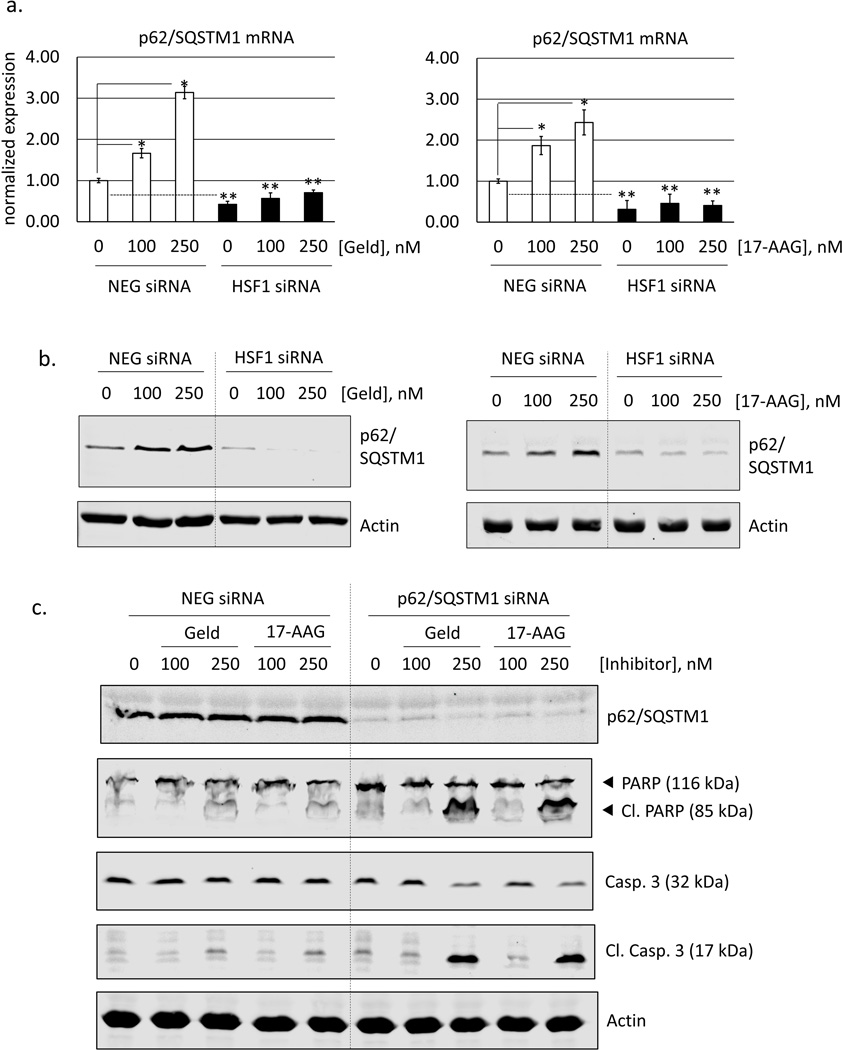
To investigate the mechanistic link between HSF1 and autophagy, we examined microarray data that we previously obtained from HSF1-silenced RKO cells [32]. From these data we identified p62/SQSTM1 as a possible HSF1-regulated gene. Using real-time PCR and Western blot analysis we confirm that HSF1 is necessary for p62/SQSTM1 expression (Fig 9 a, b). In control cells treated with Hsp90 inhibitors, there was an approximate 3-fold increase in p62/SQSTM1 mRNA and protein levels. However, in HSF1-silenced cells, p62/SQSTM1 expression was reduced or absent. Next, we used siRNA to determine the influence of p62/SQSTM1 on cellular viability in Hsp90 inhibitor-streated cells. In fact, silencing p62 sensitized cells to geldanamycin and 17-AAG (Fig 9c), similar to data from HSF1-silenced cells, shown earlier (Fig 2c). Thus, the HSF1-driven expression of p62/SQSTM1 contributes to mitigating the efficacy of Hsp90 inhibitors.
Fig. 9.
HSF1-dependence of p62/SQSTM1 expression, and effect of silencing p62/SQSTM1 on cellular sensitivity to Hsp90 inhibitors. a. Real-time PCR data for p62/SQSTM1 mRNA expression in control (NEG siRNA) and HSF1-silenced (HSF1 siRNA) cells. Values for p62/SQSTM1 amplification were normalized to GAPDH as described in Materials and Methods are expressed relative to vehicle (0.1% DMSO) treated control. Error bars represent standard deviations (n = 4). Asterisks indicates significant difference from control (* = p<0.001 and ** = p<0.005) and b. Analysis of p62/SQSTM1 expression level by Li-Cor Odyssey, normalized to actin (loading control) and displayed relative to NEG siRNA-transfected, DMSO-treated (control) cells.
4. Discussion
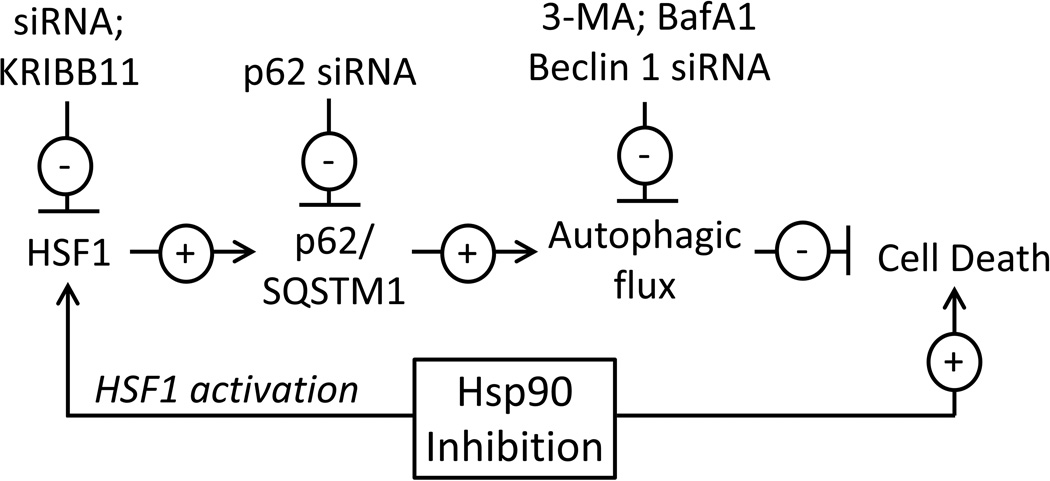
Our data reveal that HSF1 expression influences the cellular sensitivity to the Hsp90 inhibitors, geldanamycin and 17-AAG. Silencing HSF1 or blocking its activity with KRIBB11 increases cell death and highlights the potential benefit of using HSF1 inhibitors and Hsp90 inhibitors in combination chemotherapy. Our data indicate that autophagy mitigates the toxicity of Hsp90 inhibitors, but that autophagy is severely compromised in HSF1-deficiecnt cells. By supporting autophagosome formation and helping to drive autophagic flux, HSF1 antagonizes the cytotoxic effects of Hsp90 inhibitors. We explored several proteins and signaling pathways to determine how HSF1 and autophagy are linked. Using microarray data to identify candidate genes, we finally demonstrate that p62/SQSTM1 is a novel, HSF1-regulated gene that is reduced or absent in HSF1silenced cells. In summary, the activation of HSF1 promotes p62 expression and autophagic flux, which limits the efficacy of Hsp90 inhibitors. A summary of the experiments and conclusions of this report is diagrammed in Fig. 10.
Fig. 10.
Model for HSF1 and autophagy in cellular response to Hsp90 inhibitors. HSF1 is activated by Hsp90 inhibitors and enhances the activity of the transcription factor HSF1, which by promoting the expression of p62/SQSTM1 maintains autophagic and mitigates cell death. Inhibiting HSF1 or autophagy increases cellular sensitivity to cell death following treatment with Hsp90 inhibitors.
Earlier reports have shown that HSF1 expression reduces the cytotoxic effects of several chemotherapeutics. For this reason, inhibiting HSF1 has become a major objective for improving cancer therapy [33, 34]. Various hypotheses to explain the antagonistic role of HSF1 in chemotherapy have emerged. For example, recent work has demonstrated that HSF1 mediates resistance to carboplatin in the MDA-MB-231 and MDA-MB-436 breast cancer cell lines. In addressing this observation, the authors show that the autophagy gene ATG7 is down-regulated in HSF1-silenced cells following carboplatin treatment, while its levels are unchanged in vehicle-treated, HSF1-silenced cells [14]. In the canonical pathway of autophagy, ATG7 mediates the conjugation of ATG5 to ATG12 and participates in the elongation of vesicular membranes during autophagosome biogenesis. For this reason, we also examined the levels of several autophagyrelated genes. However, we did not observe any major differences between control and HSF1silenced cells, with or without drug treatment. We suspect, therefore, that the significance of ATG7 in HSF1-mediated autophagy and drug resistance is cell type and, or- drug class-dependent. It is also noteworthy that cells lacking ATG7 are still capable of forming autophagosomes and performing autophagy-mediated protein degradation [35].
In our experiments, silencing HSF1 leads to a near-complete reduction in Hsp70-1 (Hsp70) expression. This result is significant because Hsp70 has several known roles in cellular stress [36,38]. In the context of autophagy, Hsp70 was recently shown to co-immunoprecipitate with proteins that mediate autophagosome biogenesis. The authors demonstrated that an HDAC inhibitor, panobinostat promotes the acetylation of Hsp70, which then interacts with KAP1 and Vps34. The resulting Ac-Hsp70/KAP1/Vps34 multiprotein complex helps to mediate the nucleation and expansion of autophagosomes [31]. Therefore, a reduction in Hsp70 expression would hypothetically lead to a decrease in Vps34 SUMOylation and reduction in autophagosome formation. For our experiments, we used siRNA to silence Hsp70 then subsequently treated cells with Hsp90 inhibitors. Curiously, silencing Hsp70 had no effect on autophagic flux in either vehicle- or drug-treated cells. This shows that the induction of Hsp70 expression in RKO cells is not necessary for the maintenance of autophagic flux, perhaps on account of high basal Hsc70/Hsp73 expression. Therefore, we hypothesized that other HSF1-regulated genes have a role in autophagy-dependent cell survival in Hsp90 inhibitor-treated cells.
Using earlier microarray data [32], we have identified and confirmed p62/SQSTM1 as an HSF1dependent gene. Our data show that p62/SQSTM1 is strongly induced after Hsp90 inhibitor treatment, but is low or absent in HSF1-silenced cells. Furthermore, when p62/SQSTM1 is silenced with siRNA, the toxicity of Hsp90 inhibitors is enhanced. Like our findings here, other reports have shown that p62/SQSTM1 is essential for autophagy and plays an important role in determining the actions of cisplatin [39, 40].
To summarize, the use of Hsp90 inhibitors to treat cancer is limited by the fact that they elicit HSF1 activation. This results in an enhancement in heat shock gene expression, including Hsp40 and Hsp70 [41, 42]. Our data also indicate that while HSF1 is necessary, Hsp70 is dispensable for autophagic flux. Thus, although Hsp70 inhibitors are currently in development as anticancer agents [43, 44], our results suggest they may have limited use in combination with Hsp90 inhibitors. We demonstrate instead that a biochemical inhibitor of HSF1 significantly enhances cytotoxicity, highlighting the potential utility of HSF1 inhibitors as adjuvants in Hsp90 inhibitor-based chemotherapy. Finally, we demonstrate that the autophagy protein, p62/SQSTM1 is an HSF1regulated gene product that mediates cell survival. Like HSF1, p62/SQSTM1 was recently identified as an indicator of poor outcomes in breast and lung cancers, and participates in driving cell migration and invasion [45–47]. Therefore, by revealing the importance of HSF1 in regulation of p62 expression, these findings have likely significance in several areas of cancer research.
Acknowledgments
Funding was provided by Hawaii IDeA Network for Biomedical Research Excellence (INBRE) project: NCRR Grant 5 P20 RR016467-10 and NIGMS Grant 8 P20 GM103466-11. We also thank Dr. Rajini Rao for a critical reading of this manuscript.
Abbreviations
- Hsp
heat shock protein
- HSF1
heat shock factor 1
- HSE
heat shock element
- DMSO
dimethyl sulfoxide
- 17-AAG
17-N-Allylamino-17-demethoxygeldanamycin
- LC3
microtubule-associated protein 1 light chain 3
- ATG
autophagy-related gene
- SQSTM1
sequestesome 1
Footnotes
Publisher's Disclaimer: This is a PDF file of an unedited manuscript that has been accepted for publication. As a service to our customers we are providing this early version of the manuscript. The manuscript will undergo copyediting, typesetting, and review of the resulting proof before it is published in its final citable form. Please note that during the production process errors may be discovered which could affect the content, and all legal disclaimers that apply to the journal pertain.
References
- 1.Kaplan KB, Li R. A prescription for 'stress'--the role of Hsp90 in genome stability and cellular adaptation. Trends Cell Biol. 2012;22:576–583. doi: 10.1016/j.tcb.2012.08.006. [DOI] [PMC free article] [PubMed] [Google Scholar]
- 2.Whitesell L, Lindquist SL. HSP90 and the chaperoning of cancer. Nat Rev Cancer. 2005;5:761–772. doi: 10.1038/nrc1716. [DOI] [PubMed] [Google Scholar]
- 3.Gartner EM, Silverman P, Simon M, Flaherty L, Abrams J, Ivy P, et al. A phase II study of 17-allylamino-17-demethoxygeldanamycin in metastatic or locally advanced, unresectable breast cancer. Breast Cancer Res Treat. 2012;131:933–937. doi: 10.1007/s10549-011-1866-7. [DOI] [PMC free article] [PubMed] [Google Scholar]
- 4.Modi S, Stopeck A, Linden H, Solit D, Chandarlapaty S, Rosen N, et al. HSP90 inhibition is effective in breast cancer: a phase II trial of tanespimycin (17-AAG) plus trastuzumab in patients with HER2-positive metastatic breast cancer progressing on trastuzumab. Clin Cancer Res. 2011;17:5132–5139. doi: 10.1158/1078-0432.CCR-11-0072. [DOI] [PubMed] [Google Scholar]
- 5.Goldman JW, Raju RN, Gordon GA, El-Hariry I, Teofilivici F, Vukovic VM, et al. A first in human, safety, pharmacokinetics, and clinical activity phase I study of once weekly administration of the Hsp90 inhibitor ganetespib (STA-9090) in patients with solid malignancies. BMC Cancer. 2013;13:152. doi: 10.1186/1471-2407-13-152. [DOI] [PMC free article] [PubMed] [Google Scholar]
- 6.Usmani SZ, Chiosis G. HSP90 inhibitors as therapy for multiple myeloma. Clin Lymphoma Myeloma Leuk. 2011;11(Suppl 1):S77–S81. doi: 10.1016/j.clml.2011.03.027. [DOI] [PubMed] [Google Scholar]
- 7.Oki Y, Copeland A, Romaguera J, Fayad L, Fanale M, Faria Sde C, et al. Clinical experience with the heat shock protein-90 inhibitor, tanespimycin, in patients with relapsed lymphoma. Leuk Lymphoma. 2012;53:990–992. doi: 10.3109/10428194.2011.631236. [DOI] [PubMed] [Google Scholar]
- 8.Oh WK, Galsky MD, Stadler WM, Srinivas S, Chu F, Bubley G, et al. Multicenter phase II trial of the heat shock protein 90 inhibitor, retaspimycin hydrochloride (IPI-504), in patients with castration-resistant prostate cancer. Urology. 2011;78:626–630. doi: 10.1016/j.urology.2011.04.041. [DOI] [PMC free article] [PubMed] [Google Scholar]
- 9.Zou J, Guo Y, Guettouche T, Smith DF, Voellmy R. Repression of heat shock transcription factor HSF1 activation by HSP90 (HSP90 complex) that forms a stress-sensitive complex with HSF1. Cell. 1998;94:471–480. doi: 10.1016/s0092-8674(00)81588-3. [DOI] [PubMed] [Google Scholar]
- 10.Mendillo ML, Santagata S, Koeva M, Bell GW, Hu R, Tamimi RM, et al. HSF1 drives a transcriptional program distinct from heat shock to support highly malignant human cancers. Cell. 2012;150:549–562. doi: 10.1016/j.cell.2012.06.031. [DOI] [PMC free article] [PubMed] [Google Scholar]
- 11.Cen H, Zheng S, Fang YM, Tang XP, Dong Q. Induction of HSF1 expression is associated with sporadic colorectal cancer. World J Gastroenterol. 2004;10:3122–3126. doi: 10.3748/wjg.v10.i21.3122. [DOI] [PMC free article] [PubMed] [Google Scholar]
- 12.Santagata S, Hu R, Lin NU, Mendillo ML, Collins LC, Hankinson SE, et al. High levels of nuclear heat-shock factor 1 (HSF1) are associated with poor prognosis in breast cancer. Proc Natl Acad Sci U S A. 2011;108:18378–18383. doi: 10.1073/pnas.1115031108. [DOI] [PMC free article] [PubMed] [Google Scholar]
- 13.Hoang AT, Huang J, Rudra-Ganguly N, Zheng J, Powell WC, Rabindran SK, et al. A novel association between the human heat shock transcription factor 1 (HSF1) and prostate adenocarcinoma. Am J Pathol. 2000;156:857–864. doi: 10.1016/S0002-9440(10)64954-1. [DOI] [PMC free article] [PubMed] [Google Scholar]
- 14.Desai S, Liu Z, Yao J, Patel N, Chen J, Wu Y, et al. Heat shock factor 1 (HSF1) controls chemoresistance and autophagy through transcriptional regulation of autophagy-related protein 7 (ATG7) J Biol Chem. 2013;288:9165–9176. doi: 10.1074/jbc.M112.422071. [DOI] [PMC free article] [PubMed] [Google Scholar]
- 15.Rossi A, Ciafre S, Balsamo M, Pierimarchi P, Santoro MG. Targeting the heat shock factor 1 by RNA interference: a potent tool to enhance hyperthermochemotherapy efficacy in cervical cancer. Cancer Res. 2006;66:7678–7685. doi: 10.1158/0008-5472.CAN-05-4282. [DOI] [PubMed] [Google Scholar]
- 16.Mathew R, White E. Autophagy, stress, and cancer metabolism: what doesn't kill you makes you stronger. Cold Spring Harb Symp Quant Biol. 2011;76:389–396. doi: 10.1101/sqb.2012.76.011015. [DOI] [PubMed] [Google Scholar]
- 17.Pan Y, Gao Y, Chen L, Gao G, Dong H, Yang Y, et al. Targeting autophagy augments in vitro and in vivo antimyeloma activity of DNA-damaging chemotherapy. Clin Cancer Res. 2011;17:3248–3258. doi: 10.1158/1078-0432.CCR-10-0890. [DOI] [PubMed] [Google Scholar]
- 18.Guo XL, Li D, Hu F, Song JR, Zhang SS, Deng WJ, et al. Targeting autophagy potentiates chemotherapy-induced apoptosis and proliferation inhibition in hepatocarcinoma cells. Cancer Lett. 2012;320:171–179. doi: 10.1016/j.canlet.2012.03.002. [DOI] [PubMed] [Google Scholar]
- 19.Liu L, Yang M, Kang R, Wang Z, Zhao Y, Yu Y, et al. HMGB1-induced autophagy promotes chemotherapy resistance in leukemia cells. Leukemia. 2011;25:23–31. doi: 10.1038/leu.2010.225. [DOI] [PubMed] [Google Scholar]
- 20.Whitesell L, Mimnaugh EG, De Costa B, Myers CE, Neckers LM. Inhibition of heat shock protein HSP90-pp60v-src heteroprotein complex formation by benzoquinone ansamycins: essential role for stress proteins in oncogenic transformation. Proc Natl Acad Sci U S A. 1994;91:8324–8328. doi: 10.1073/pnas.91.18.8324. [DOI] [PMC free article] [PubMed] [Google Scholar]
- 21.Schulte TW, Neckers LM. The benzoquinone ansamycin 17-allylamino-17demethoxygeldanamycin binds to HSP90 and shares important biologic activities with geldanamycin. Cancer Chemother Pharmacol. 1998;42:273–279. doi: 10.1007/s002800050817. [DOI] [PubMed] [Google Scholar]
- 22.Guettouche T, Boellmann F, Lane WS, Voellmy R. Analysis of phosphorylation of human heat shock factor 1 in cells experiencing a stress. BMC Biochemistry. 2005;6:4. doi: 10.1186/1471-2091-6-4. [DOI] [PMC free article] [PubMed] [Google Scholar]
- 23.Wilkerson DC, Skaggs HS, Sarge KD. HSF2 binds to the Hsp90, Hsp27, and c-Fos promoters constitutively and modulates their expression. Cell Stress Chaperones. 2007;12:283–290. doi: 10.1379/CSC-250.1. [DOI] [PMC free article] [PubMed] [Google Scholar]
- 24.Yoon YJ, Kim JA, Shin KD, Shin DS, Han YM, Lee YJ, et al. KRIBB11 inhibits HSP70 synthesis through inhibition of heat shock factor 1 function by impairing the recruitment of positive transcription elongation factor b to the hsp70 promoter. J Biol Chem. 2011;286:1737–1747. doi: 10.1074/jbc.M110.179440. [DOI] [PMC free article] [PubMed] [Google Scholar]
- 25.Tsujimoto Y, Shimizu S. Another way to die: autophagic programmed cell death. Cell Death Differ. 2005;12(Suppl 2):1528–1534. doi: 10.1038/sj.cdd.4401777. [DOI] [PubMed] [Google Scholar]
- 26.Yamamoto A, Tagawa Y, Yoshimori T, Moriyama Y, Masaki R, Tashiro Y. Bafilomycin A1 prevents maturation of autophagic vacuoles by inhibiting fusion between autophagosomes and lysosomes in rat hepatoma cell line, H-4-II-E cells. Cell Struct Funct. 1998;23:33–42. doi: 10.1247/csf.23.33. [DOI] [PubMed] [Google Scholar]
- 27.Yoshimori T, Yamamoto A, Moriyama Y, Futai M, Tashiro Y. Bafilomycin A1, a specific inhibitor of vacuolar-type H(+)-ATPase, inhibits acidification and protein degradation in lysosomes of cultured cells. J Biol Chem. 1991;266:17707–17712. [PubMed] [Google Scholar]
- 28.Zhang XJ, Chen S, Huang KX, Le WD. Why should autophagic flux be assessed? Acta Pharmacol Sin. 2013;34:595–599. doi: 10.1038/aps.2012.184. [DOI] [PMC free article] [PubMed] [Google Scholar]
- 29.Mizushima N, Yoshimori T, Levine B. Methods in mammalian autophagy research. Cell. 2010;140:313–326. doi: 10.1016/j.cell.2010.01.028. [DOI] [PMC free article] [PubMed] [Google Scholar]
- 30.Hansen TE, Johansen T. Following autophagy step by step. BMC Biology. 2011;9:39. doi: 10.1186/1741-7007-9-39. [DOI] [PMC free article] [PubMed] [Google Scholar]
- 31.Yang Y, Fiskus W, Yong B, Atadja P, Takahashi Y, Pandita TK, et al. Acetylated hsp70 and KAP1-mediated Vps34 SUMOylation is required for autophagosome creation in autophagy. Proc. Natl Acad Sci U S A. 2013;110:6841–6846. doi: 10.1073/pnas.1217692110. [DOI] [PMC free article] [PubMed] [Google Scholar]
- 32.Jacobs AT, Marnett LJ. HSF1-mediated BAG3 expression attenuates apoptosis in 4hydroxynonenal-treated colon cancer cells via stabilization of anti-apoptotic Bcl-2 proteins. J Biol Chem. 2009;284:9176–9183. doi: 10.1074/jbc.M808656200. [DOI] [PMC free article] [PubMed] [Google Scholar]
- 33.Whitesell L, Lindquist S. Inhibiting the transcription factor HSF1 as an anticancer strategy. Expert Opin Ther Targets. 2009;13:469–478. doi: 10.1517/14728220902832697. [DOI] [PubMed] [Google Scholar]
- 34.Powers MV, Workman P. Inhibitors of the heat shock response: biology and pharmacology. FEBS Lett. 2007;581:3758–3769. doi: 10.1016/j.febslet.2007.05.040. [DOI] [PubMed] [Google Scholar]
- 35.Nishida Y, Arakawa S, Fujitani K, Yamaguchi H, Mizuta T, Kanaseki T, et al. Discovery of Atg5/Atg7-independent alternative macroautophagy. Nature. 2009;461:654–658. doi: 10.1038/nature08455. [DOI] [PubMed] [Google Scholar]
- 36.Papp E, Nardai G, Soti C, Csermely P. Molecular chaperones, stress proteins and redox homeostasis. BioFactors. 2003;17:249–257. doi: 10.1002/biof.5520170124. [DOI] [PubMed] [Google Scholar]
- 37.Silver JT, Noble EG. Regulation of survival gene hsp70. Cell Stress Chaperones. 2012;17:1–9. doi: 10.1007/s12192-011-0290-6. [DOI] [PMC free article] [PubMed] [Google Scholar]
- 38.Zylicz M, King FW, Wawrzynow A. Hsp70 interactions with the p53 tumour suppressor protein. EMBO J. 2001;20:4634–4638. doi: 10.1093/emboj/20.17.4634. [DOI] [PMC free article] [PubMed] [Google Scholar]
- 39.Ren F, Shu G, Liu G, Liu D, Zhou J, Yuan L, et al. Knockdown of p62/sequestosome 1 attenuates autophagy and inhibits colorectal cancer cell growth. Mol Cell Biochem. 2013 doi: 10.1007/s11010-013-1818-0. [DOI] [PubMed] [Google Scholar]
- 40.Yu H, Su J, Xu Y, Kang J, Li H, Zhang L, et al. p62/SQSTM1 involved in cisplatin resistance in human ovarian cancer cells by clearing ubiquitinated proteins. Eur J Cancer. 2011;47:1585–1594. doi: 10.1016/j.ejca.2011.01.019. [DOI] [PubMed] [Google Scholar]
- 41.Neckers L, Workman P. Hsp90 molecular chaperone inhibitors: are we there yet? Clin Cancer Res. 2012;18:64–76. doi: 10.1158/1078-0432.CCR-11-1000. [DOI] [PMC free article] [PubMed] [Google Scholar]
- 42.Bagatell R, Paine-Murrieta GD, Taylor CW, Pulcini EJ, Akinaga S, Benjamin IJ, et al. Induction of a heat shock factor 1-dependent stress response alters the cytotoxic activity of hsp90-binding agents. Clin Cancer Res. 2000;6:3312–3318. [PubMed] [Google Scholar]
- 43.Powers MV, Jones K, Barillari C, Westwood I, van Montfort RL, Workman P. Targeting HSP70: the second potentially druggable heat shock protein and molecular chaperone? Cell Cycle. 2010;9:1542–1550. doi: 10.4161/cc.9.8.11204. [DOI] [PubMed] [Google Scholar]
- 44.Balaburski GM, Leu JI, Beeharry N, Hayik S, Andrake MD, Zhang G, et al. A modified HSP70 inhibitor shows broad activity as an anticancer agent. Mol Cancer Res. 2013;11:219–229. doi: 10.1158/1541-7786.MCR-12-0547-T. [DOI] [PMC free article] [PubMed] [Google Scholar]
- 45.Galavotti S, Bartesaghi S, Faccenda D, Shaked-Rabi M, Sanzone S, McEvoy A, et al. The autophagy-associated factors DRAM1 and p62 regulate cell migration and invasion in glioblastoma stem cells. Oncogene. 2013;32:699–712. doi: 10.1038/onc.2012.111. [DOI] [PubMed] [Google Scholar]
- 46.Luo RZ, Yuan ZY, Li M, Xi SY, Fu J, He J. Accumulation of p62 is associated with poor prognosis in patients with triple-negative breast cancer. Onco Targets Ther. 2013;6:883–888. doi: 10.2147/OTT.S46222. [DOI] [PMC free article] [PubMed] [Google Scholar]
- 47.Inoue D, Suzuki T, Mitsuishi Y, Miki Y, Suzuki S, Sugawara S, et al. Accumulation of p62/SQSTM1 is associated with poor prognosis in patients with lung adenocarcinoma. Cancer Sci. 2012;103:760–766. doi: 10.1111/j.1349-7006.2012.02216.x. [DOI] [PMC free article] [PubMed] [Google Scholar]


