Abstract
Vitamin D receptor (VDR) mediates vitamin D signaling involved in bone metabolism, cellular growth and differentiation, cardiovascular function, and bile acid regulation. Mice with an intestine-specific disruption of VDR (VdrΔIEpC) have abnormal body size, colon structure, and imbalance of bile acid metabolism. Lithocholic acid (LCA), a secondary bile acid that activates VDR, is among the most toxic of the bile acids that when overaccumulated in the liver causes hepatotoxicity. Because cytochrome P450 3A4 (CYP3A4) is a target gene of VDR-involved bile acid metabolism, the role of CYP3A4 in VDR biology and bile acid metabolism was investigated. The CYP3A4 gene was inserted into VdrΔIEpC mice to produce the VdrΔIEpC/3A4 line. LCA was administered to control, transgenic-CYP3A4, VdrΔIEpC, and VdrΔIEpC/3A4 mice, and hepatic toxicity and bile acid levels in the liver, intestine, bile, and urine were measured. VDR deficiency in the intestine of the VdrΔIEpC mice exacerbates LCA-induced hepatotoxicity manifested by increased necrosis and inflammation, due in part to over-accumulation of hepatic bile acids including taurocholic acid and taurodeoxycholic acid. Intestinal expression of CYP3A4 in the VdrΔIEpC/3A4 mouse line reduces LCA-induced hepatotoxicity through elevation of LCA metabolism and detoxification, and suppression of bile acid transporter expression in the small intestine. This study reveals that intestinal CYP3A4 protects against LCA hepatotoxicity.
Keywords: bile acids, vitamin D receptor, metabolomics
Vitamin D receptor (VDR) is activated by 1α,25-dihydroxy-vitamin D3, an active form of vitamin D3, and mediates vitamin D signaling in numerous physiological and pharmacological processes (1). VDR is abundantly expressed in kidney, intestine, and bone, but is expressed at low levels in most other tissues (2). Deficiency of VDR leads to hypocalcemia, hyperparathyroidism, rickets, osteomalacia, alopecia, uterine hypoplasia, and growth retardation, which might result from repression of calcium absorption due to downregulation of duodenal epithelial calcium channels (3–7). Recently, an intestine-specific VDR knockout mouse model (VdrΔIEpC) was generated that is deficient of VDR in the small intestine and colon. These mice have abnormal body size, colon structure, and feces bile acid composition, and are more susceptible to experimentally-induced inflammatory bowel disease than WT mice (8). Feces metabolomics revealed decreased concentrations of taurine, taurocholic acid, taurodeoxycholic acid (TDCA), and cholic acid in VdrΔIEpC mice. In addition to the spontaneous accumulation of bile acids in VDR-deficient mice, it was reported that VDR ligands inhibit bile acid synthesis and transcription of the gene encoding cholesterol 7α-hydroxylase (CYP7A1) (9, 10). In bile duct-ligated mice, 1α,25-dihydroxy-vitamin D3 administration decreased liver bile acid content, increased the expression of bile acid transporters, and repressed pro-inflammatory cytokine expression (11), which might be through regulation of sulfotransferase 2A1 to control bile acid-disrupted sterol homeostasis (12). Therefore, VDR might play a crucial role in regulation of bile acid metabolism (13).
Lithocholic acid (LCA), a monohydroxy secondary bile acid, is formed by bacterial 7-dehydroxylation of the primary bile acid, chenodeoxycholic acid, and of the secondary bile acid, ursodeoxycholic acid. The consensus emerged that the acute and chronic toxicity of LCA resulted from the administration of pharmacological loads of LCA (14). LCA also appears to induce its own detoxification in the liver. In addition, LCA is a potent activator of VDR (15). VDR controls transcription of the gene encoding sulfotransferase, an enzyme responsible for detoxification of LCA in humans. It was suggested that LCA enters the colonic enterocyte, activates VDR, and thereby induces its own detoxification (15). LCA was also shown to induce hepatic CYP3A4, a target gene regulated by VDR that is involved in bile acid metabolism, notably the oxidation of bile acids (16).
Due to the critical function of VDR in bile acid regulation and the unknown mechanism of bile acid accumulation in VdrΔIEpC mice, VdrΔIEpC mice and VdrΔIEpC mice expressing CYP3A4 were used to investigate the effect of VDR and CYP3A4 on LCA-induced hepatotoxicity and bile acid metabolism. The CYP3A4 transgene was inserted into VdrΔIEpC mice through crossing transgenic-CYP3A4 (Tg-3A4) mice to VdrΔIEpC mice to establish a new line designated VdrΔIEpC/3A4. LCA was administered to these mice and hepatotoxicity and bile acid metabolism and transport evaluated; while metabolomics, a high-throughput technology platform to measure metabolic fluctuations in exogenous and endogenous compounds (17), was employed to investigate bile flux changes in the gastrointestinal system. The results revealed that VDR deficiency in the intestine increases LCA-induced liver necrosis due to over-accumulation of hepatic bile acids. CYP3A4 alleviates LCA-induced hepatotoxicity through the suppression of bile acid transporters and escalation of LCA detoxification.
METHODS
Generation of VdrΔIEpC/3A4 mice
VdrΔIEpC and Tg-3A4 mice were housed in temperature- and light-controlled rooms and were given water and pelleted chow ad libitum. VdrΔIEpC founders were mated to Tg-3A4 mice and the litters were genotyped and divided into four groups: WT (Vdrfl/fl,cre−/3A4−), Tg-3A4 (Vdrfl/fl,cre−/3A4+), VdrΔIEpC (Vdrfl/fl,cre+/3A4−), and VdrΔIEpC/3A4 (Vdrfl/fl,cre+/3A4+). All groups of mice used in this study were obtained from these same littermates. All animal experiments were carried out in accordance with the Institute of Laboratory Animal Resources guidelines and approved by the National Cancer Institute Animal Care and Use Committee.
Experimental design
Two- to three-month-old WT, Tg-3A4, VdrΔIEpC, and VdrΔIEpC/3A4 male mice were fed AIN-93G purified diets for 3 days, followed by LCA (0.6% w/w) mixed in the AIN-93G purified diet for 4 days. Serum samples were collected and mice were euthanized by CO2 asphyxiation. Urine, liver, duodenum, jejunum, ileum, colon, and other tissue samples were harvested and stored at −80°C for analysis.
Assessment of liver injury
For assessment of macroscopic liver damage, liver tissue was flushed with PBS and fixed in 10% buffered formalin. Liver injury was scored by double-blinded analysis on a routine hematoxylin and eosin-stained section according to the morphological criteria previously described (18). Drug-induced liver injury was further evaluated by measuring alanine aminotransferase (ALT) and alkaline phosphatase (ALP) in serum. Briefly, 2 μl of serum was mixed with 200 μl of ALT or ALP assay buffer (Catachem, Bridgeport, CT) in a 96-well microplate, and the oxidation of NADH to NAD+ was monitored at 340 nm for 5 min.
Cholesterol and bile acid uptake measurements
Plasma levels of total cholesterol in serum and liver homogenate were measured in overnight-fasted mice using assay kits from Wako Diagnostics (Richmond, VA). Liver homogenate was extracted as follows: 20 mg liver was homogenized with 200 μl extraction buffer [50 mM Tris/HCL, 1% Triton X-100 (v/v)]. One microliter of supernatant was used for the measurements as described for serum analysis according to the manufacturer's protocol (Wako USA, Richmond, VA). To measure the hepatic and enteric bile acid levels, 20 mg of frozen liver or mucosa cells scraped from the entire intestine were homogenized in 400 μl of 75% ethanol, incubated at 50°C for 2 h, and then centrifuged. The supernatant (aqueous fraction) was retained, evaporated, and resuspended in 200 μl of 0.9% saline. Twenty microliters were used for bile acid quantification using the VetSpec bile acids kit (Catachem, Oxford, CT).
RNA analysis
Hepatic and intestinal RNA was extracted using TRIzol reagent (Invitrogen, Carlsbad, CA) and quantitative (q)PCR performed using cDNA generated from 1 μg of total RNA with SuperScript II reverse transcriptase (Invitrogen). Primers for qPCR were designed using the Primer Express software (Applied Biosystems, Foster City, CA) and sequences are available upon request. qPCR reactions were carried out using SYBR Green PCR master mix (SuperArray, Frederick, MD) by using an ABI Prism 7900HT sequence detection system (Applied Biosystems). Values were quantitated using the comparative cycle threshold method, and results were normalized to mouse β-actin.
Metabolomics analysis of urine, bile, and tissue homogenates
Urine samples were processed by mixing 40 μl of urine with 160 μl of 50% aqueous acetonitrile and centrifuging at 18,000 g for 10 min to remove protein and particulates. Liver tissues (100 mg) were homogenized on the ice, and 1 ml acetonitrile:water (50% v:v) was added for denaturation of protein. After multiple centrifugations, supernatants were collected. Bile samples were denatured by a 100-fold dilution with acetonitrile:water (66% v:v) and supernatants processed for liquid chromatography analysis. The homogenates of small intestine tissues (duodenum, jejunum, and ileum) were prepared and diluted with 1:20 acetonitrile:water (50% v:v). Supernatants were injected into an ultra-performance liquid chromatography (UPLC) system (Waters Corporation, Milford, MA) and metabolites separated by a gradient ranging from water to 95% aqueous acetonitrile containing 0.1% formic acid over a 10 min run. An Acquity UPLCTM BEH C18 column (Waters Corporation) was used to separate chemical components at 35°C. The mobile phase flow rate was 0.5 ml/min with an aqueous acetonitrile gradient containing 0.1% formic acid over a 10 min run (0% acetonitrile for 0.5 min to 20% acetonitrile by 5 min to 95% acetonitrile by 9 min, then equilibration at 100% water for 1 min before the next injection). The QTOF PremierTM mass spectrometer was operated in the positive electrospray ionization mode. Capillary voltage and cone voltage were maintained at 3 KV and 20 V, respectively. Source temperature and desolvation temperature were set at 120°C and 350°C, respectively. Nitrogen was used as both cone gas (50 l/h) and desolvation gas (600 l/h), and argon was used as collision gas. For accurate mass measurements, the TOFMS was calibrated with sodium formate solution (range m/z 100–1,000) and monitored by the intermittent injection of the lock mass sulfadimethoxine ([M+H]+ = m/z 311.0814) in real-time. Mass chromatograms and mass spectral data were acquired and processed by MassLynx software (Waters Corporation) in centroid format.
Quantitation of metabolites
LCA, LCA metabolites, and bile acid standards were purchased from Sigma-Aldrich. Quantitation of bile acid metabolites was performed using an ACQUITY UPLC system coupled with a XEVO triple-quadrupole tandem mass spectrometer (Waters Corporation). The detection and quantitation of biomarkers were accomplished by multiple reaction monitoring mass spectrometry.
Metabolomic data analysis
Chromatographic and spectral data were deconvoluted by MarkerLynx software (Waters Corporation). A multivariate data matrix containing information on sample identity, ion identity (retention time and m/z), and ion abundance was generated through centroiding, deisotoping, filtering, peak recognition, and integration. The intensity of each ion was calculated by normalizing the single ion counts versus the total ion counts in the whole chromatogram. The data matrix was further exported into SIMCA-PTM software (Umetrics, Kinnelon, NJ) and transformed by mean-centering and Pareto scaling, a technique that increases the importance of low abundance ions without significant amplification of noise. Principal components of serum were generated by principal components analysis (PCA) to represent the major latent variables in the data matrix and were described in a scores scatter plot.
In vitro incubation system for investigation of intestinal LCA phase I metabolism
Mouse intestinal microsomes obtained from WT and Tg-3A4 mice were prepared. The phase I incubation system (200 μl) contained 50 mM Tris-HCl buffer solution (pH 7.4), 0.5 mg/ml mouse intestinal microsomes, 5 mM MgCl2, 100 μM LCA, and 1 mM freshly prepared NADPH. After 0.5 h incubation at 37°C, the reaction was stopped using 200 μl cold 50% aqueous methanol containing 5 μM chlorpropamide. After centrifuging at 14,000 g for 20 min, a 5 μl aliquot of the supernatant was injected into a UPLC-ESI-QTOFMS. An Acquity C18 BEH UPLC column (Waters Corporation) was employed to separate components in serum, urine, feces, and microsomal incubation samples. The mobile phase consisted of water containing 0.1% formic acid (A) and acetonitrile containing 0.1% formic acid (B). The following gradient condition was used: 100% A for 0.5 min, increased to 100% B over the next 7.5 min, and returned to 100% A in the last 2 min. The flow rate of the mobile phase was set at 0.5 ml/min. Data were collected in negative ion mode on a Waters QTOF Premier mass spectrometer, which was operated in full-scan mode at m/z 50–850. Nitrogen was used as both cone gas (50 l/h) and desolvation gas (600 l/h). Source desolvation temperatures were set at 120°C and 350°C, respectively. The capillary voltage and cone voltage were 3,000 and 20 V, respectively.
Western blotting
Mouse ileums were lysed with RIPA lysis buffer [150 mM NaCl, 0.5% Triton X-100, 50 mM Tris-HCl (pH 7.4), 25 mM NaF, 20 mM EGTA, 1 mM DTT, 1 mM Na3VO4, and protease inhibitor cocktail] for 30 min on ice, followed by centrifugation at 14,800 g for 15 min. Protein concentrations were measured with bicinchoninic acid (BCA) reagent. Protein (30–60 μg) was electrophoresed on a 4–15% gradient Tris-HCl gel (Bio-Rad, Hercules, CA) and transferred onto a polyvinylidene difluoride membrane in Tris-glycine buffer (pH 8.4) containing 20% methanol. The membrane was blocked with 5% fat-free dry milk in phosphate-buffered saline containing 0.1% Tween-20 (PBST) for 1 h. The membranes were probed with primary antibodies and horseradish peroxidase-conjugated secondary antibodies using standard Western blotting procedures. Proteins were visualized using the Femto signal chemiluminescent substrate (Pierce) under the image analyzer (Alpha Innotech Corp., San Leandro, CA). The antibody to mouse apical sodium-dependent bile acid transporter (ASBT) was generously supplied by Paul A. Dawson, Wake Forest University School of Medicine.
Statistics
Experimental values are expressed as mean ± SD. Statistical analysis was performed with two-tailed Student's t-tests with P < 0.05 considered statistically significant.
RESULTS
LCA-induced hepatotoxicity is alleviated in VdrΔIEpC mice with CYP3A4 insertion
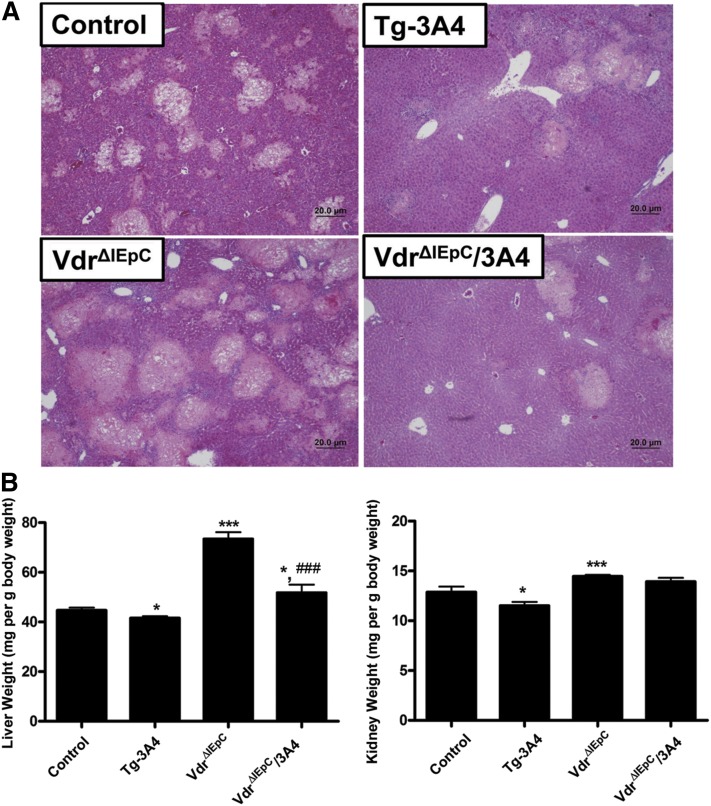
While the body weights of the VdrΔIEpC mice are low, the body weights of the VdrΔIEpC/3A4 mice are similar to the WT controls. The body weights of VdrΔIEpC mice ranged from 16 to 20 g at 8 weeks of age, while the body weights of VdrΔIEpC/3A4 mice ranged from 22 to 29 g, which is similar to the WT C57BL/6 mice on the same genetic background, thus suggesting that CYP3A4 rescues some of the abnormal phenotype of the VdrΔIEpC mice (8). To investigate bile acid metabolism in VdrΔIEpC/3A4 mice, LCA was administered for 4 days. LCA causes intrahepatic cholestasis and damage to the bile canaliculi in rodents (19). Histological results revealed that LCA caused severe hepatotoxicity with areas of necrosis of irregular distribution with some dilatation of centrolobular venules with inflammatory and neutrophil infiltration in WT, Tg-3A4, VdrΔIEpC, and VdrΔIEpC/3A4 mice (Fig. 1A). Liver injury was lower in Tg-3A4 mice compared with WT mice, and markedly reduced in VdrΔIEpC/3A4 mice compared with VdrΔIEpC mice as demonstrated by the reduced severity of lesion score (P < 0.05), coagulation necrosis (P < 0.05), biliary proliferation, inflammation cell infiltration, and portal inflammation (supplementary Fig. I) Hepatotoxicity was most severe in VdrΔIEpC mice compared with WT mice, and VdrΔIEpC/3A4 mice compared with Tg-3A4 mice. Liver and kidney weights relative to body weights were high in VdrΔIEpC mice, and these levels were lower in the VdrΔIEpC/3A4 mice. Tg-3A4 mice alone showed a slight but significant decrease in liver weight versus body weight and kidney weight versus body weight compared with controls (Fig. 1B).
Fig. 1.
Histological analysis of liver toxicity. A: Microscopic observation revealed that LCA administration caused severe hepatotoxicity with areas of necrosis of irregular distribution with some dilatation of centrolobular venules with inflammatory and neutrophil infiltration in WT, Tg-3A4, VdrΔIEpC, and VdrΔIEpC/3A4 mice. Liver injury is alleviated in Tg-3A4 compared with WT mice, as well as reduced in VdrΔIEpC/3A4 mice compared with VdrΔIEpC mice. B: Liver weight versus body weight and kidney weight versus body weight in VdrΔIEpC and VdrΔIEpC/3A4 mice. *P < 0.05 compared with control in same group; ***P < 0.001 compared with control in same group; ###P < 0.001 compared with VdrΔIEpC in same group.
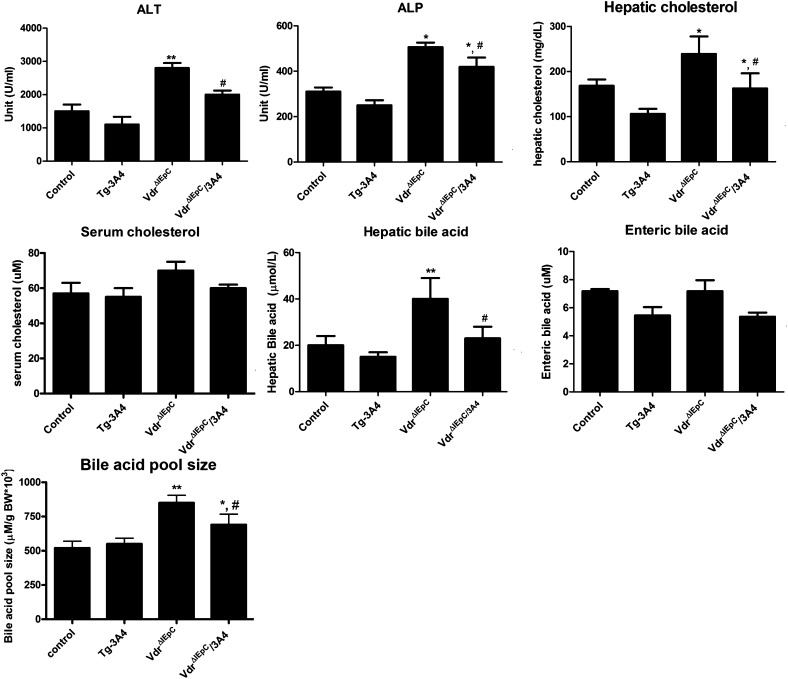
Upon treatment with LCA, VdrΔIEpC mice with or without the CYP3A4 gene had increased ALT and ALP values compared with WT and Tg-3A4 mice. The VdrΔIEpC/3A4 mice had decreased ALT and ALP compared with VdrΔIEpC mice, although there was a tendency toward lower without significant differences of ALT and ALP between control and Tg-3A4 mice (Fig. 2). These data suggested that intestinal VDR deficiency results in greater LCA hepatoxicity and that CYP3A4 alleviates the hepatotoxicity induced by LCA in the intestinal Vdr-null background. Due to the potential effect of LCA hepatic metabolism, cholesterol and bile acid levels in liver and serum were measured. There were no significant differences in serum cholesterol levels between the four groups. In contrast, hepatic cholesterol was significantly increased in VdrΔIEpC mice, and decreased in VdrΔIEpC/3A4 mice (Fig. 2). Similarly, hepatic bile acids were increased in VdrΔIEpC mice and decreased in VdrΔIEpC/3A4 mice. However, enteric bile acids extracted from epithelial cells scraped from the entire intestine showed no significant difference between these mice, despite the slight increase of bile acids in VdrΔIEpC mice compared with the other groups (Fig. 2). Moreover, the bile acid pool size was higher in VdrΔIEpC mice compared with VdrΔIEpC/3A4 mice, and the bile acid pool size in both groups of mice was higher than control and Tg-3A4 mice, while there was no significant difference between control and Tg-3A4 mice (Fig. 2). The mechanism for the lower bile acid pool in the VdrΔIEpC/3A4 mice is not known; it may be due to increased metabolism of bile acid intermediates by CYP3A4. Thus, LCA-induced hepatotoxicity might be aggravated in VdrΔIEpC mice through induction of hepatic cholesterol and bile acid synthesis, and this is alleviated by intestinal detoxification by CYP3A4.
Fig. 2.
Serum biochemistry of WT, Tg-3A4, VdrΔIEpC, and VdrΔIEpC/3A4 mice treated with LCA. ALP, ALT, serum cholesterol, hepatic cholesterol, hepatic bile acids, and enteric bile acids from mucosa cells scraped from the entire intestine in WT, Tg-3A4, VdrΔIEpC, and VdrΔIEpC/3A4 mice, as well as bile acid pool size in these four treated mice. *P < 0.05 compared with control in same group; **P < 0.01 compared with control in same group; #P < 0.05 compared with VdrΔIEpC in same group.
Gene and urinary metabolomic profiles reveal activation of CYP3A by LCA administration
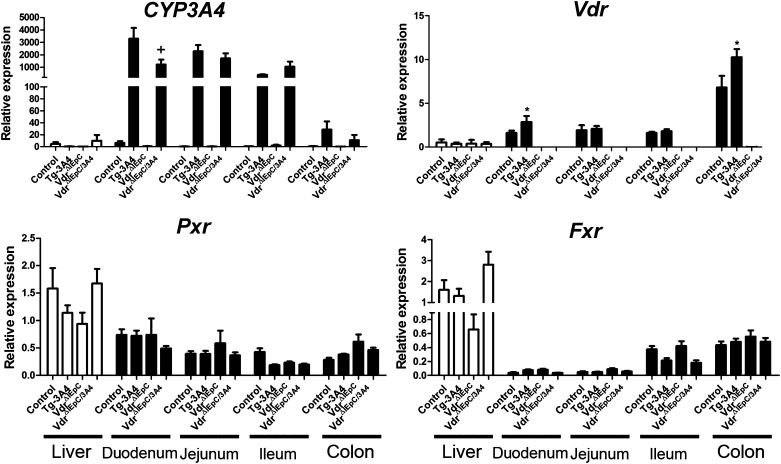
Real-time qPCR analysis of LCA-treated mice showed that CYP3A4 mRNA is highly expressed in the small intestine but not in the liver of Tg-3A4 and VdrΔIEpC/3A4 mice (Fig. 3). VDR and pregnane X receptor (PXR), known inducers of CYP3A4 (20), were also examined. While CYP3A4 was expressed at lower levels in the duodenum of VdrΔIEpC/3A4 mice as compared with Tg-3A4 mice, there was not much difference in the expression in other regions of the intestine. Vdr mRNA was similarly expressed at slightly higher levels in Tg-3A4 mice compared with VdrΔIEpC/3A4 mice only in the duodenum; there were no significant differences in Pxr and farnesoid X receptor (Fxr) mRNA expression between the four treated groups, although they had higher levels in the liver compared with the intestine (Fig. 3). The role of CYP3A4 in LCA metabolism was then investigated with microsomes prepared from the intestine. The molecular ions [M-H]− = 375.29 and [M-H]− = 391.28 were used to extract the peak of LCA and its hydroxylated products produced in intestinal microsomes in vitro (supplementary Fig. IIA). Two hydroxylated products (M-1 and M-2) were identified, and a significant increase (P < 0.001) was detected for the formation M-1 in Tg-3A4 mice as compared to WT mice. An elevation trend was also observed for M-2 in Tg-3A4 mice (supplementary Fig. IIB). These data indicate that increased expression of CYP3A4 in Tg-3A4 stimulated metabolism of LCA in the intestine.
Fig. 3.
Expression of mRNAs encoding enzymes responsible for LCA metabolism. CYP3A4, Pxr, Fxr, and Vdr mRNAs were measured by qPCR in WT, Tg-3A4, VdrΔIEpC, and VdrΔIEpC/3A4 mice. *P < 0.05 compared with control mice in the same group; +P < 0.05 compared with control in Tg-3A4 group.
Metabolomic analysis of liver homogenate, small intestine homogenate, gallbladder, and urine
It was reported that increased LCA and LCA metabolites are correlated with elevated levels of bile acids (20–22). To investigate bile acid constituents, metabolomics was carried out on the four mouse groups treated with LCA. PCA revealed clear separation between urine metabolites in the control and treated group in positive or negative ionization modes in VdrΔIEpC and VdrΔIEpC/3A4 mice (supplementary Fig. IIIA). The model fit (R2 value) and prediction powers (Q2 value) of the PCA model indicated good separation of the PCA model. The loading plot showed contribution ions I, II, III, and IV in positive mode were determined to be LCA, lithocholate-O-glucuronide, LCA glycine conjugate, and hydroxylated LCA, respectively, and ions V and VI in negative mode (supplementary Fig. IIIB) were lithocholyltaurine and taurine, respectively, as revealed through MS/MS fragmentation and structure identification. These data indicate that the production of LCA metabolites through oxidation and conjugation is increased in VdrΔIEpC/3A4 mice compared with VdrΔIEpC mice, likely due to the involvement of CYP3A4.
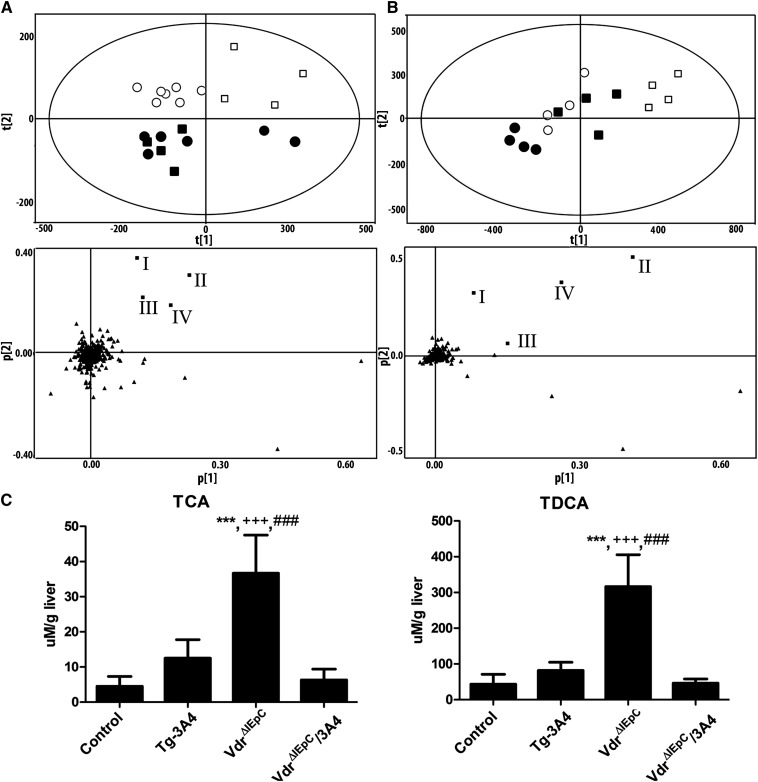
It was reported that increased LCA and LCA metabolites are correlated with elevated levels of bile acids (20–22). To investigate the bile acid constituents, metabolomic analysis of liver and gallbladder bile was carried out. PCA of the hepatic metabolomes revealed a clear separation between control and Tg-3A4 mice, and VdrΔIEpC and VdrΔIEpC/3A4 mice (Fig. 4A). Moreover, loading plots from the PCA revealed that TDCA, taurocholic acid (TCA), tauro-α-muricholic acid (T-α-MCA), and tauro-chenodeoxycholic acid (T-CDCA) were the four major ions contributing to the distinctive clustering of VdrΔIEpC from VdrΔIEpC/3A4 mice in the negative mode. Quantitation of these four bile acids using specific ion monitoring and purified standards, revealed that TCA and TDCA are significantly higher in VdrΔIEpC mice compared with the other three mouse lines, while TCA and TDCA are significantly decreased in VdrΔIEpC/3A4 mice compared with VdrΔIEpC mice (Fig. 4C). Tissue metabolomic analysis was carried out on intestine homogenates from WT and Tg-3A4 mice, and a similar trend, as noted with liver homogenates, was found in intestine homogenates, including a PCA separation trend between the two mouse lines (supplementary Fig. IV) and increased TCA levels in the duodenum and jejunum with a trend toward increase in the ileum (supplementary Fig. V). These results indicate that the high abundance of TCA and TDCA might be correlated with increased bile acid synthesis and metabolism and resulted in accumulation in VdrΔIEpC mice and increased LCA-induced hepatotoxicity. Detoxification of LCA in VdrΔIEpC/3A4 mice might be through LCA metabolism, and thus decreased the effect of LCA on specific bile acid accumulation in the liver and the circulation. Furthermore, PCA of the gallbladder bile revealed a clear separation between control and Tg-3A4 mice and VdrΔIEpC and VdrΔIEpC/3A4 mice (Fig. 4B). Moreover, loading plots from PCA revealed that TDCA, TCA, T-α-MCA, and T-CDCA are the four major ions contributing to the distinctive clustering of VdrΔIEpC from VdrΔIEpC/3A4 mice in negative mode, and the results were correlated with liver metabolomic analysis.
Fig. 4.
Metabolomic analysis of liver homogenate and bile in negative mode from VdrΔIEpC and VdrΔIEpC/3A4 mice. A: PCA (upper panel A) of the negative mode of liver homogenate metabolome revealed a clear separation of control (■), Tg-3A4 (•), VdrΔIEpC (□), and VdrΔIEpC/3A4 (○). Loading plots (lower panel A) from the PCA showing four bile acid metabolites labeled with boxes: I, TDCA; II, taurocholic acid (TCA); III, T-α-MCA; and IV, T-CDCA contributing to the distinctive clustering of VdrΔIEpC from the other groups. B: PCA (upper panel B) of the negative bile metabolome revealed a clear separation of control (■), Tg-3A4 (•),VdrΔIEpC (□), and VdrΔIEpC/3A4 (○). Loading plots (lower panel of B) from the PCA show the same four bile acid metabolites which are TCA, T-CDCA, TDCA and T-α-MCA, respectively. C. Quantitation of TCA and TDCA in liver homogenate from control, Tg-3A4, VdrΔIEpC, and VdrΔIEpC/3A4 mice. ***P < 0.001 compared with control in same group; +++P < 0.001 compared with Tg-3A4 in same group; ###P < 0.001 compared with VdrΔIEpC/3A4 in same group.
Expression of genes responsible for bile acid synthesis and transport
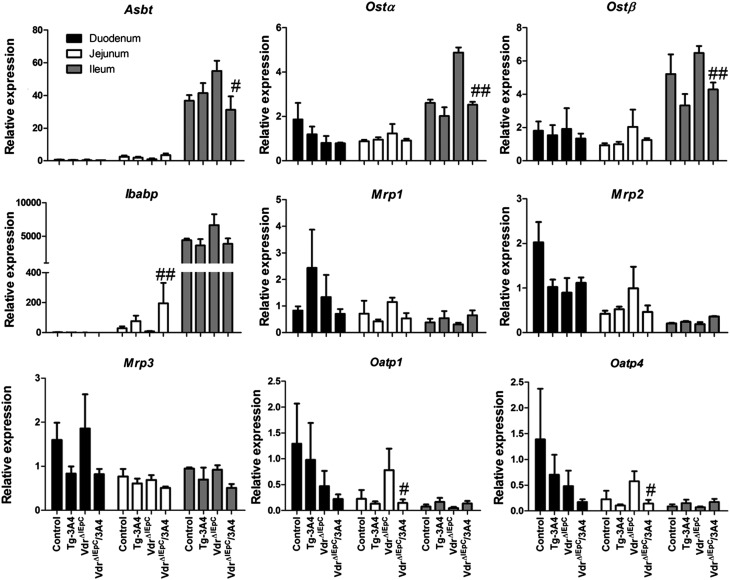
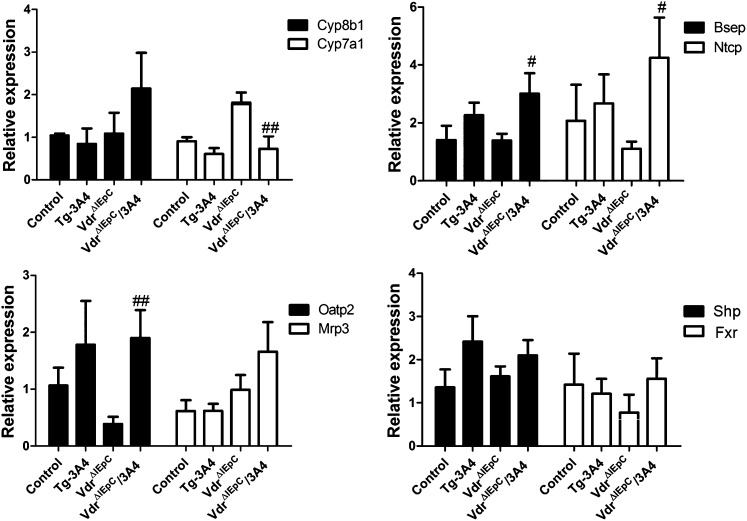
Although intestinal CYP3A4 detoxified LCA and reduced bile acid over-accumulation, bile acid accumulation might also influence bile acid synthesis and transport. Thus, expression from multiple transport genes, including Asbt, organic solute transporters α and β (Ostα and Ostβ), multidrug resistance-associated proteins (Mrp1, Mrp2, and Mrp3), and organic anion transporting polypeptides (Oatp1, Oatp2, and Oatp4), in three regions of the intestine were evaluated by qPCR measurement of mRNAs (Fig. 5). Intestinal Oatp1 and Oatp4 mRNAs were decreased in VdrΔIEpC/3A4 mice compared with VdrΔIEpC mice, while there were no significant differences in Mrp1, Mrp2, and Mrp3 mRNAs in the intestine. Asbt and Ostα mRNAs were reduced in the intestine of VdrΔIEpC/3A4 mice compared with VdrΔIEpC mice (Fig. 5). Western blotting results further demonstrated that ASBT protein was more strikingly reduced than its mRNA by expression of CYP3A4 in the intestinal Vdr-null background (supplementary Fig. VI). Moreover, ileal bile acid-binding protein (Ibabp) mRNA was increased in VdrΔIEpC/3A4 mice compared with VdrΔIEpC mice. Increasing IBABP may facilitate transport of bile acids to OSTs for efflux. Decreasing OSTs may reduce bile acid efflux, while increasing IBABP may compensate by more efficiently delivering bile acids to OSTs for efflux. In addition, bile acids are not absorbed into enterocytes and do not circulate back to the liver, so induction of IBABP favors reduction of intracellular bile acids as protection against LCA toxicity. Genes related to bile acid synthesis in liver, including hepatic Cyp8b1 and Cyp7a1, bile salt export pump (Bsep), and Na+-taurocholate cotransporting polypeptide (Ntcp), were also examined. The results demonstrated higher expression of Bsep and Ntcp mRNAs in VdrΔIEpC/3A4 mice and a low expression level of Cyp7a1 in VdrΔIEpC/3A4 mice compared with VdrΔIEpC mice. Hepatic Oatp2 demonstrated higher expression in VdrΔIEpC/3A4 mice compared with VdrΔIEpC mice. Because Bsep is responsible for bile acid efflux from the liver to the gallbladder, Ntcp and Oatp2 are involved in bile acid influx from the circulation to the liver; these data suggest that the decreased synthesis of bile acids by CYP7A1 in VdrΔIEpC/3A4 mice might be responsible for the decreased hepatic bile acids in VdrΔIEpC/3A4 mice compared with VdrΔIEpC mice. There were no significant differences in expression of Fxr and small heterodimer partner (Shp) between these four groups (Fig. 6). Results of gene expression analysis thus suggested that the lower bile acid accumulation in VdrΔIEpC/3A4 mice might be due to increased bile acid efflux and reduced bile acid synthesis in the liver. This change might be correlated to CYP3A4 over-metabolism of LCA and LCA detoxification in VdrΔIEpC/3A4 mice.
Fig. 5.
Expression of mRNAs encoding enzymes responsible for bile acid transport in the intestine of WT, Tg-3A4, VdrΔIEpC, and VdrΔIEpC/3A4 mice. Asbt, Ostα, Ostβ, Ibabp, Mrp1, Mrp2, Mrp3, Oatp1, and Oatp4 mRNAs in intestine and liver were measured by qPCR. #P < 0.05 compared with VdrΔIEpC in same group; ##P < 0.01 compared with VdrΔIEpC in same group.
Fig. 6.
Expression of mRNAs encoding enzymes responsible for bile acid synthesis and transportation in the liver of WT, Tg-3A4, VdrΔIEpC, and VdrΔIEpC/3A4 mice. Cyp8b1, Cyp7a1, Bsep, Ntcp, Mrp3, Oatp2, Shp, and Fxr mRNAs in liver were measured by qPCR. #P < 0.05 compared with VdrΔIEpC in same group; ##P < 0.01 compared with VdrΔIEpC in same group.
DISCUSSION
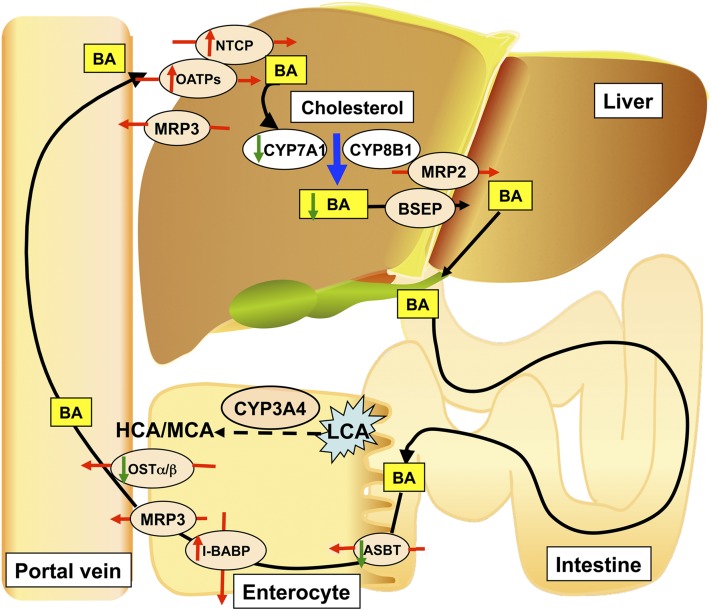
The results of this study are summarized and the potential role of intestinal CYP3A4 in bile acid metabolism and protection against bile acid toxicity is illustrated in Fig. 7. In the intestine-specific VDR-deficient mouse, LCA-induced hepatotoxicity is more severe than in WT mice due to over-accumulation of bile acids in the liver. It was reported that reduced VDR can lead to calcium malabsorption (6), and that decreased calcium could then damage intestinal epithelia (23–25). Intestinal permeability is a key factor regulating bile acid transport and expression of target proteins (26). Deficiency of VDR in the intestine of VdrΔIEpC mice leads to increased LCA toxicity in the liver after its reuptake from the intestine. Changes in intestinal structure could increase bile acid uptake by the intestine and lead to hepatic over-accumulation of bile acids in VdrΔIEpC mice as a result of LCA administration. CYP3A4 can metabolize LCA, and perhaps other bile acids, and reduce the accumulation of toxic bile acids in the liver. CYP3A4 is not significantly expressed in the livers of Tg-3A4 and VdrΔIEpC/3A4 mice, and highly expressed in the intestine, in agreement with the low expression in the liver and high expression in the intestine system reported earlier for the CYP3A4-humanized mouse line (27). Therefore, any LCA metabolism by CYP3A4 is largely carried out in the intestine of VdrΔIEpC/3A4 mice and not in the liver. LCA is largely excreted in the bile and feces as a sulfate conjugate (28). LCA can also be conjugated with taurine or glycine and excreted in feces or urine. Thus, LCA-induced toxicity could be decreased through increased conjugation with taurine and sulfate. It is likely that the conjugates are metabolized by bacterial bile acid hydrolase in the intestine leading to free LCA that is recirculated to the liver. However, intestinal CYP3A4 could convert LCA into hydroxylated LCA, which could further facilitate conjugation and sulfation. Oxidation of LCA by intestinal CYP3A4 could reduce circulating bile acids and alleviate LCA-induced hepatotoxicity in the VdrΔIEpC/3A4 mice.
Fig. 7.
Bile acid metabolic events contributing to the low accumulation of bile acids in VdrΔIEpC/3A4 mice compared with VdrΔIEpC mice. BA, bile acid.
Bile and liver metabolomics revealed that taurocholic acid and TDCA, two major bile acids, were increased in the liver of VdrΔIEpC mice. Urinary metabolomics demonstrated increased lithocholate-O-glucuronide, LCA acid glycine conjugate, and hydroxylated LCA, and reduced taurine conjugates in VdrΔIEpC/3A4 mice, which indicated increased metabolism and detoxification of LCA in VdrΔIEpC/3A4 mice. In chronic cholestatic liver disease, hydrophobic and potentially cytotoxic bile acids accumulate in the liver (29). Thus, hepatic accumulation of taurocholic acid and TDCA and impaired metabolism of LCA in VdrΔIEpC mice might contribute to the tissue degeneration in cholestatic liver disease due to the detergent effects of these bile acids.
Bile acid transport in the enterocytes basically consists of three components: 1) apical uptake of bile acids in the enterocytes largely facilitated by the uptake of conjugated bile acids in the terminal ileum via a Na+-dependent mechanism, such as ASBT; 2) intracellular bile acid transport in the enterocytes is mediated by cytosolic IBABP; and 3) an anion exchange mechanism for the basolateral efflux of bile acids from enterocytes, such as OSTα and OSTβ. The ileal bile acid transport system offers enormous potential as a valuable target for cholesterol/bile acid lowering therapy. Specific transporters expressed in the liver and the intestine play a critical role in driving the enterohepatic circulation of bile acids (Fig. 7). Enterohepatic circulation of bile acids is fundamentally composed of two major processes, secretion from the liver and absorption from the intestine (30). In hepatocytes, the vectorial transport of bile acids from blood to bile is carried out by NTCPs and OATPs. Bile acids are then transported into the canaliculus via BSEPs and MRPs and delivered to the intestinal lumen where they are reabsorbed into enterocytes. Intestinal epithelial cells reabsorb the majority of the secreted bile acids through ASBTs and OATPs (31). Increased portal bile acid absorption as a result of elevated ASBTs in the rat in vivo by 1,25(OH)2D3 treatment could trigger indirect or secondary changes in hepatic transporters and enzymes due to the activation or inhibition of other nuclear receptors (32). The present results revealed decreased expression of Oatps, Asbt, and Ostα in the intestine of VdrΔIEpC/3A4 mice compared with VdrΔIEpC mice. These data indicate that the absorption of bile acids in the intestine of VdrΔIEpC/3A4 mice is lower than in VdrΔIEpC mice. However, in the liver, there was an elevation of Bsep mRNA in VdrΔIEpC/3A4 mice indicating increased canalicular membrane efflux, and higher expression of Oatp2 and Ntcp mRNAs indicating increased hepatic bile acid uptake and efflux. Therefore, lowered hepatic bile acid accumulation in VdrΔIEpC/3A4 mice might not be due to increased hepatic bile acid uptake leading to less bile acid accumulation, but due to lower enterohepatic bile acid circulation in these mice as a result of lower expression of Oatps, Asbt, and Ostα. The mechanisms for the changes in expression of these transporters are not known and require further investigation.
In summary, the working model is that loss of intestinal VDR decreases intestinal CYP3A expression. Decreased intestinal CYP3A4 expression reduces LCA metabolism and increases the expression of intestinal transporters, which is likely not direct but due to altered bile acid metabolism and increased intestinal bile acid transport. This results in decreased bile acid loss, increased bile acid absorption into the enterohepatic circulation, and increased hepatic bile acid exposure which contributes to the increased hepatic injury. Intestine-specific VDR deficiency exacerbates LCA-induced liver cholestasis due to over-accumulation of hepatic bile acids while CYP3A4 alleviates LCA-induced hepatotoxicity through increased LCA detoxification and increased efflux of bile acids. Because intestinal VDR may contribute to the maintenance of intestinal barrier function, intestinal overexpression of CYP3A4 would be protective by detoxifying LCA and protecting intestinal barrier function. The VdrΔIEpC and VdrΔIEpC/3A4 mouse models could be valuable tools to investigate VDR regulation of bile acids, as well as coordination of VDR and CYP3A4 on detoxification of bile acid-induced toxicity in the gastrointestinal system.
Supplementary Material
Acknowledgments
The authors thank Shigeaki Kato, Tokyo University, for the Vdr-floxed mice, and Paul A. Dawson, Wake Forest University School of Medicine, for the generous gift of the antibody to mouse ASBT.
Footnotes
Abbreviations:
- ALP
- alkaline phosphatase
- ALT
- alanine aminotransferase
- Asbt
- apical sodium-dependent bile acid transporter
- Bsep
- bile salt export pump
- CYP3A4
- cytochrome P450 3A4
- CYP7A1
- cholesterol 7α-hydroxylase
- Fxr
- farnesoid X receptor
- Ibabp
- ileal bile acid-binding protein
- LCA
- lithocholic acid
- Mrp
- multidrug resistance-associated protein
- Ntcp
- Na+-taurocholate cotransporting polypeptide
- Oatp
- organic anion transporting polypeptide
- Ost
- organic solute transporter
- PCA
- principal components analysis
- PXR
- pregnane X receptor
- TDCA
- taurodeoxycholic acid
- TCA
- taurocholic acid
- T-α-MCA
- tauro-α-muricholic acid
- T-CDCA
- tauro-chenodeoxycholic acid
- Tg-3A4
- transgenic-CYP3A4
- UPLC
- ultra-performance liquid chromatography
- VDR
- vitamin D receptor
- VdrΔIEpC
- intestine-specific vitamin D receptor knockout mouse
This work was funded by the National Cancer Institute Intramural Research Program, and by grants R37DK058379 and R01DK044442 to J.Y.L.C. from the National Institute of Diabetes and Digestive and Kidney Diseases, National Institutes of Health.
The online version of this article (available at http://www.jlr.org) contains supplementary data in the form of six figures.
REFERENCES
- 1.Haussler M. R., Haussler C. A., Jurutka P. W., Thompson P. D., Hsieh J. C., Remus L. S., Selznick S. H., Whitfield G. K. 1997. The vitamin D hormone and its nuclear receptor: molecular actions and disease states. J. Endocrinol. 154(Suppl):S57–S73 [PubMed] [Google Scholar]
- 2.Bookout A., Jeong Y., Downes M., Yu R., Evans R. M., Mangelsdorf D. J. 2006. Anatomical profiling of nuclear receptor expression reveals a hierachical transcriptional network. Cell. 126: 789–799 [DOI] [PMC free article] [PubMed] [Google Scholar]
- 3.Li Y. C., Pirro A. E., Amling M., Delling G., Baron R., Bronson R., Demay M. B. 1997. Targeted ablation of the vitamin D receptor: an animal model of vitamin D-dependent rickets type II with alopecia. Proc. Natl. Acad. Sci. USA. 94: 9831–9835 [DOI] [PMC free article] [PubMed] [Google Scholar]
- 4.Yoshizawa T., Handa Y., Uematsu Y., Takeda S., Sekine K., Yoshihara Y., Kawakami T., Arioka K., Sato H., Uchiyama Y., et al. 1997. Mice lacking the vitamin D receptor exhibit impaired bone formation, uterine hypoplasia and growth retardation after weaning. Nat. Genet. 16: 391–396 [DOI] [PubMed] [Google Scholar]
- 5.Li Y. C., Kong J., Wei M., Chen Z. F., Liu S. Q., Cao L. P. 2002. 1,25-Dihydroxyvitamin D(3) is a negative endocrine regulator of the renin-angiotensin system. J. Clin. Invest. 110: 229–238 [DOI] [PMC free article] [PubMed] [Google Scholar]
- 6.Lieben L., Masuyama R., Torrekens S., Van Looveren R., Schrooten J., Baatsen P., Lafage-Proust M. H., Dresselaers T., Feng J. Q., Bonewald L. F., et al. 2012. Normocalcemia is maintained in mice under conditions of calcium malabsorption by vitamin D-induced inhibition of bone mineralization. J. Clin. Invest. 122: 1803–1815 [DOI] [PMC free article] [PubMed] [Google Scholar]
- 7.Bouillon R., Carmeliet G., Verlinden L., van Etten E., Verstuyf A., Luderer H. F., Lieben L., Mathieu C., Demay M. 2008. Vitamin D and human health: lessons from vitamin D receptor null mice. Endocr. Rev. 29: 726–776 [DOI] [PMC free article] [PubMed] [Google Scholar]
- 8.Kim J. H., Yamaori S., Tanabe T., Johnson C. H., Krausz K. W., Kato S., Gonzalez F. J. 2013. Implication of intestinal VDR deficiency in inflammatory bowel disease. Biochim. Biophys. Acta. 1830: 2118–2128 [DOI] [PMC free article] [PubMed] [Google Scholar]
- 9.Han S., Chiang J. Y. 2009. Mechanism of vitamin D receptor inhibition of cholesterol 7alpha-hydroxylase gene transcription in human hepatocytes. Drug Metab. Dispos. 37: 469–478 [DOI] [PMC free article] [PubMed] [Google Scholar]
- 10.Han S., Li T., Ellis E., Strom S., Chiang J. Y. 2010. A novel bile acid-activated vitamin D receptor signaling in human hepatocytes. Mol. Endocrinol. 24: 1151–1164 [DOI] [PMC free article] [PubMed] [Google Scholar]
- 11.Ogura M., Nishida S., Ishizawa M., Sakurai K., Shimizu M., Matsuo S., Amano S., Uno S., Makishima M. 2009. Vitamin D3 modulates the expression of bile acid regulatory genes and represses inflammation in bile duct-ligated mice. J. Pharmacol. Exp. Ther. 328: 564–570 [DOI] [PubMed] [Google Scholar]
- 12.Echchgadda I., Song C. S., Roy A. K., Chatterjee B. 2004. Dehydroepiandrosterone sulfotransferase is a target for transcriptional induction by the vitamin D receptor. Mol. Pharmacol. 65: 720–729 [DOI] [PubMed] [Google Scholar]
- 13.Fiorucci S., Cipriani S., Mencarelli A., Renga B., Distrutti E., Baldelli F. 2010. Counter-regulatory role of bile acid activated receptors in immunity and inflammation. Curr. Mol. Med. 10: 579–595 [DOI] [PubMed] [Google Scholar]
- 14.Hofmann A. F. 2004. Detoxification of lithocholic acid, a toxic bile acid: relevance to drug hepatotoxicity. Drug Metab. Rev. 36: 703–722 [DOI] [PubMed] [Google Scholar]
- 15.Makishima M., Lu T. T., Xie W., Whitfield G. K., Domoto H., Evans R. M., Haussler M. R., Mangelsdorf D. J. 2002. Vitamin D receptor as an intestinal bile acid sensor. Science. 296: 1313–1316 [DOI] [PubMed] [Google Scholar]
- 16.Jurutka P. W., Thompson P. D., Whitfield G. K., Eichhorst K. R., Hall N., Dominguez C. E., Hsieh J. C., Haussler C. A., Haussler M. R. 2005. Molecular and functional comparison of 1,25-dihydroxyvitamin D(3) and the novel vitamin D receptor ligand, lithocholic acid, in activating transcription of cytochrome P450 3A4. J. Cell. Biochem. 94: 917–943 [DOI] [PubMed] [Google Scholar]
- 17.Johnson C. H., Patterson A. D., Idle J. R., Gonzalez F. J. 2012. Xenobiotic metabolomics: major impact on the metabolome. Annu. Rev. Pharmacol. Toxicol. 52: 37–56 [DOI] [PMC free article] [PubMed] [Google Scholar]
- 18.Schulte E. K. 1991. Standardization of biological dyes and stains: pitfalls and possibilities. Histochemistry. 95: 319–328 [DOI] [PubMed] [Google Scholar]
- 19.Taylor W., Lesna M. 1977. The hepatotoxicity of lithocholic acid im male mice. [proceedings] Br. J. Pharmacol. 61: 133P–134P [PMC free article] [PubMed] [Google Scholar]
- 20.Sonoda J., Xie W., Rosenfeld J. M., Barwick J. L., Guzelian P. S., Evans R. M. 2002. Regulation of a xenobiotic sulfonation cascade by nuclear pregnane X receptor (PXR). Proc. Natl. Acad. Sci. USA. 99: 13801–13806 [DOI] [PMC free article] [PubMed] [Google Scholar]
- 21.Mansell J. P., Shorez D., Farrar D., Nowghani M. 2009. Lithocholate–a promising non-calcaemic calcitriol surrogate for promoting human osteoblast maturation upon biomaterials. Steroids. 74: 963–970 [DOI] [PubMed] [Google Scholar]
- 22.Zhang J., Huang W., Qatanani M., Evans R. M., Moore D. D. 2004. The constitutive androstane receptor and pregnane X receptor function coordinately to prevent bile acid-induced hepatotoxicity. J. Biol. Chem. 279: 49517–49522 [DOI] [PubMed] [Google Scholar]
- 23.Ballard S. T., Hunter J. H., Taylor A. E. 1995. Regulation of tight-junction permeability during nutrient absorption across the intestinal epithelium. Annu. Rev. Nutr. 15: 35–55 [DOI] [PubMed] [Google Scholar]
- 24.Zhang Y., Csanaky I. L., Lehman-McKeeman L. D., Klaassen C. D. 2011. Loss of organic anion transporting polypeptide 1a1 increases deoxycholic acid absorption in mice by increasing intestinal permeability. Toxicol. Sci. 124: 251–260 [DOI] [PMC free article] [PubMed] [Google Scholar]
- 25.Stenman L. K., Holma R., Eggert A., Korpela R. 2013. A novel mechanism for gut barrier dysfunction by dietary fat: epithelial disruption by hydrophobic bile acids. Am. J. Physiol. Gastrointest. Liver Physiol. 304: G227–G234 [DOI] [PubMed] [Google Scholar]
- 26.Soeters P. B., Luyer M. D., Greve J. W., Buurman W. A. 2007. The significance of bowel permeability. Curr. Opin. Clin. Nutr. Metab. Care. 10: 632–638 [DOI] [PubMed] [Google Scholar]
- 27.Yu A. M., Fukamachi K., Krausz K. W., Cheung C., Gonzalez F. J. 2005. Potential role for human cytochrome P450 3A4 in estradiol homeostasis. Endocrinology. 146: 2911–2919 [DOI] [PubMed] [Google Scholar]
- 28.Palmer R. H., Ruban Z. 1966. Production of bile duct hyperplasia and gallstones by lithocholic acid. J. Clin. Invest. 45: 1255–1267 [DOI] [PMC free article] [PubMed] [Google Scholar]
- 29.Fischer S., Beuers U., Spengler U., Zwiebel F. M., Koebe H. G. 1996. Hepatic levels of bile acids in end-stage chronic cholestatic liver disease. Clin. Chim. Acta. 251: 173–186 [DOI] [PubMed] [Google Scholar]
- 30.McCarthy T. C., Li X., Sinal C. J. 2005. Vitamin D receptor-dependent regulation of colon multidrug resistance-associated protein 3 gene expression by bile acids. J. Biol. Chem. 280: 23232–23242 [DOI] [PubMed] [Google Scholar]
- 31.Alrefai W. A., Gill R. K. 2007. Bile acid transporters: structure, function, regulation and pathophysiological implications. Pharm. Res. 24: 1803–1823 [DOI] [PubMed] [Google Scholar]
- 32.Maeng H. J., Durk M. R., Chow E. C., Ghoneim R., Pang K. S. 2011. 1alpha,25-dihydroxyvitamin D3 on intestinal transporter function: studies with the rat everted intestinal sac. Biopharm. Drug Dispos. 32: 112–125 [DOI] [PubMed] [Google Scholar]
Associated Data
This section collects any data citations, data availability statements, or supplementary materials included in this article.


