Abstract
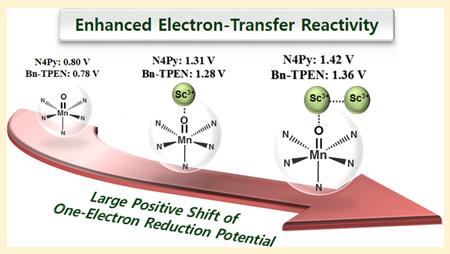
One and two scandium ions (Sc3+) are bound strongly to nonheme manganese(IV)–oxo complexes, [(N4Py)MnIV(O)]2+ (N4Py = N,N-bis(2-pyridylmethyl)-N-bis(2-pyridyl)methylamine) and [(Bn-TPEN)MnIV(O)]2+ (Bn-TPEN = N-benzyl-N,N′,N′-tris(2-pyridylmethyl)-1,2-diaminoethane), to form MnIV(O)–(Sc3+)1 and MnIV(O)–(Sc3+)2 complexes, respectively. The binding of Sc3+ ions to the MnIV(O) complexes was examined by spectroscopic methods as well as by DFT calculations. The one-electron reduction potentials of the MnIV(O) complexes were markedly shifted to a positive direction by binding of Sc3+ ions. Accordingly, rates of the electron transfer reactions of the MnIV(O) complexes were enhanced as much as 107–fold by binding of two Sc3+ ions. The driving force dependence of electron transfer from various electron donors to the MnIV(O) and MnIV(O)–(Sc3+)2 complexes was examined and analyzed in light of the Marcus theory of electron transfer to determine the reorganization energies of electron transfer. The smaller reorganization energies and much more positive reduction potentials of the MnIV(O)–(Sc3+)2 complexes resulted in remarkable enhancement of the electron-transfer reactivity of the MnIV(O) complexes. Such a dramatic enhancement of the electron-transfer reactivity of the MnIV(O) complexes by binding of Sc3+ ions resulted in the change of mechanism in the sulfoxidation of thioanisoles by MnIV(O) complexes from a direct oxygen atom transfer pathway without metal ion binding to an electron-transfer pathway with binding of Sc3+ ions.
INTRODUCTION
High-valent metal–oxo complexes play pivotal roles as reactive intermediates in the reactions of heme (cytochromes P450 and peroxidases)1–3 and nonheme metalloenzymes (taurine/α-ketoglutarate dioxygenase (TauD),4 soluble methane monooxygenase (sMMO),5 and oxygen-evolving center (OEC) in Photosystem II6,7) as well as in their biomimetic oxidation catalysis.8–13 A number of synthetic high-valent metal–oxo complexes have been synthesized and characterized by various spectroscopic techniques as well as by X-ray crystallography.8–17 The oxidizing reactivity of the high-valent metal–oxo complexes has so far been finely controlled by the oxidation state of metals and the supporting and axial ligands.8–28 Alternatively, binding of redox-inactive metal ions acting as Lewis acids to the metal–oxo moiety of high-valent metal–oxo complexes has also been reported to enhance the oxidizing power of the metal–oxo complexes.29–32 For example, Lau and co-workers have shown that rates of oxidation of alkanes by MnO4− are accelerated dramatically by addition of Lewis acids.33 We have reported the first X-ray crystal structure of a Sc3+ ion-bound iron(IV)–oxo complex34 and found that the binding of Sc3+ ions to iron(IV)–oxo complexes resulted in the remarkable enhancement of the oxidizing reactivity of the iron–oxo complexes in various oxidation reactions.29 Those findings are reminiscent of the indispensable role of Ca2+ in the manganese–oxo–calcium (Mn4CaO5) active site in OEC, which catalyzes four-electron oxidation of water to dioxygen, although the exact function of Ca2+ has yet to be clarified.35,36 In this context, we have recently communicated preliminary results that binding of redox-inactive metal ions to a nonheme manganese(IV)–oxo complex affected the oxidizing ability significantly.37 Goldberg and co-workers also reported the influence of a redox-inactive Zn2+ ion on a valence tautomerization of a manganese(V)–oxo corrolazine complex.38 More recently, Agapie and co-workers reported that the redox potentials of tetranuclear heterometallic trimanganese dioxo clusters [Mn3M(µ4-O)(µ2-O)] containing a redox-inactive metal ion, which were synthesized as an excellent structural model of the OEC active site,39 were systematically controlled by the Lewis acidity of the redox-inactive metal ions.40 The positive shift in the redox potentials of an iron(IV)–oxo complex was also observed in the presence of various redox-inactive metal ions, showing a correlation between the reactivity of the iron(IV)–oxo complex and the Lewis acidity of the redox-inactive metal ions.29a However, the electron-transfer properties of metal ion-bound manganese-(IV)–oxo (MnIV(O)) complexes, which are the most fundamental factor in controlling the reactivity of metal–oxo species in oxidation reactions, have yet to be clarified.
We report herein not only the synthesis and characterization of nonheme MnIV(O) complexes binding one and two Sc3+ ions, MnIV(O)–(Sc3+)1 and MnIV(O)–(Sc3+)2, but also the detailed kinetic data on electron transfer from various electron donors to MnIV(O), MnIV(O)–(Sc3+)1, and MnIV(O)–(Sc3+)2 complexes. The large positive shifts in one-electron reduction potentials of MnIV(O) complexes by binding of one and two Sc3+ ions have also been determined for the first time by carrying out redox titration experiments using electron donors with known one-electron oxidation potentials. Rates of the electron-transfer reactions by MnIV(O) complexes were remarkably enhanced by binding of Sc3+ ions. The driving force dependence of the rate constants of electron-transfer reactions has been analyzed in light of the Marcus theory of electron transfer41 to determine the reorganization energies of electron transfer of Sc3+ ion-bound MnIV(O) complexes in comparison with those of MnIV(O) complexes without Sc3+ ions. We have also shown that binding of redox-inactive metal ions enhances the reactivity of MnIV(O) complexes in sulfoxidation of thioanisoles and changes the sulfoxidation mechanism from direct oxygen atom transfer to electron transfer.
RESULTS AND DISCUSSION
Binding of Sc3+ Ions to Nonheme MnIV(O) Complexes
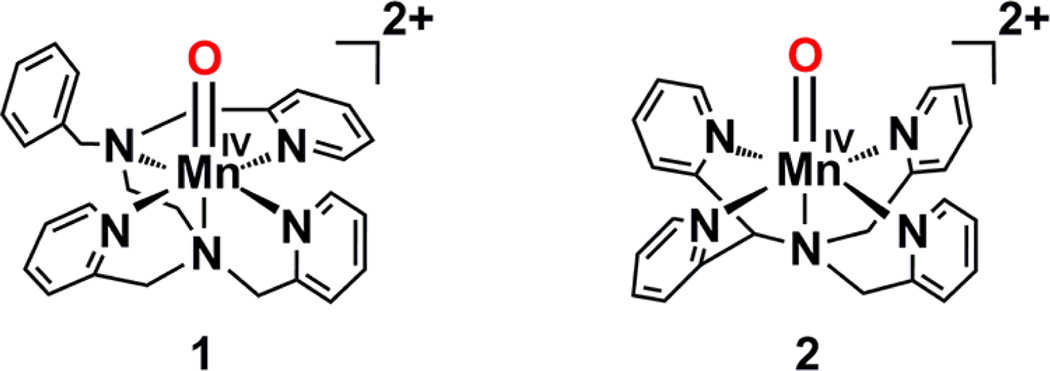
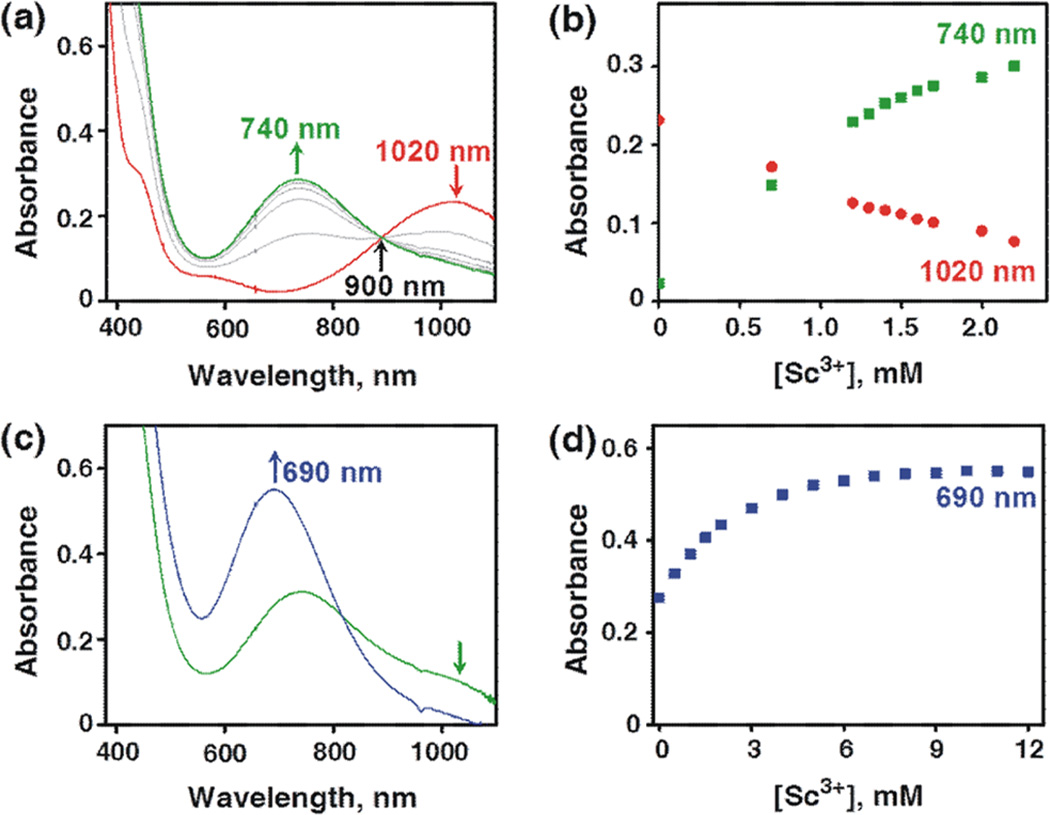
[(Bn-TPEN)MnIV(O)]2+ (1) and its scandium-bound species were synthesized and characterized spectroscopically, as reported for binding of Sc3+ ions to [(N4Py)MnIV(O)]2+ (2) (see Chart 1).37,41 Addition of up to 2 equiv of Sc(OTf)3 to a solution of 1 in a solvent mixture of CF3CH2OH/CH3CN (v/v = 19:1) resulted in a blue shift of the absorption band of 1 at λmax = 1020 nm to that at λmax = 740 nm with an isosbestic point at 900 nm (Figure 1a). Such a blue shift suggests that the ground state of 1 is more stabilized by binding of Sc3+ ions. Further addition of Sc(OTf)3 resulted in a more blue-shift to give the absorption band at λmax = 690 nm (Figure 1c). No further spectral change was observed by addition of more than 9 equiv of Sc(OTf)3. Such stepwise spectral changes indicate the binding of one and two Sc3+ ions to 1 to produce MnIV(O)–(Sc3+)1 and MnIV(O)–(Sc3+)2 complexes, respectively. The X-band EPR spectra of [(Bn-TPEN)MnIV(O)]2+–(Sc3+)1 and [(Bn-TPEN)MnIV(O)]2+–(Sc3+)2 exhibit signals that are characteristic of S = 3/2 MnIV (Figure S1 in Supporting Information (SI)). This result is the same as that reported previously for the complexes of 2 with Sc3+ ions.37 The magnetic moments of [(Bn-TPEN)MnIV(O)]2+–(Sc3+)1 and [(Bn-TPEN)MnIV(O)]2+–(Sc3+)2 were also determined to be 4.4 and 4.3 µB by the modified NMR technique of Evans,42 respectively, confirming the spin state of S = 3/2 for both complexes.41a
Chart 1.
Figure 1.
(a) UV–vis spectral changes showing the conversion from [(Bn-TPEN)MnIV(O)]2+ (red line) to [(Bn-TPEN)Mn (O)]2+– (Sc3+)1 (green line) upon addition of incremental amounts of Sc3+ (from 0.0 to 2.0 mM) in the titration experiment. (b) Spectroscopic titration monitored at 1020 nm (red rhombuses) due to the decay of [(Bn-TPEN)MnIV(O)]2+ and at 740 nm (green squares) due to the formation of [(Bn-TPEN)MnIV(O)]2+–(Sc3+)1. (c) UV–vis spectral changes showing the conversion from [(Bn-TPEN)Mn (O)]2+– (Sc3+)1 (green line) to [(Bn-TPEN)MnIV (O)]2+–(Sc3+)2 (blue line) observed upon addition of Sc3+ ions (from 0.0 to 12 mM). (d) Spectroscopic titration monitored at 690 nm (blue squares) due to [(Bn-TPEN)MnIV(O)]2+–(Sc3+)2.
The formation constant of the [(Bn-TPEN)MnIV(O)]2+– (Sc3+)1 complex was determined to be 4.0 × 10³ M−1, by analyzing the spectral change in Figure 1b (see the linear plot to determine the formation constant in Figure S2a in the SI).43 The formation constant of the [(Bn-TPEN)MnIV(O)]2+– (Sc3+)2 complex was also determined to be 1.2 × 10³ M−1 from the titration curve in Figure 1d (see also Figure S2b in SI for the linear plot to determine the formation constant), which is somewhat smaller than that of the [(N4Py)MnIV(O)]2+– (Sc3+)2 complex (6.1 × 10³ M−1).37
The structural details of Sc3+ binding was investigated using Mn K-edge EXAFS on 1, [(Bn-TPEN)MnIV(O)]2+–(Sc3+)1 and [(Bn-TPEN)MnIV(O)]2+–(Sc3+)2 (see the SI, Experimental section for X-ray absorption spectroscopy, Figure S3 and Table S1). The EXAFS results show that on going from no Sc3+ binding in 1 to one and two Sc3+ binding, the Mn═O bond elongates from 1.69 to 1.74(2) Å, which is consistent with a weakening of the Mn═O bond. The EXAFS data also reveal a short Mn–Sc distance (3.45(10) Å), which clearly indicates that Sc3+ ions bind to the MnIV(O) moiety in both [(Bn-TPEN)MnIV(O)]2+–(Sc3+)1 and [(Bn-TPEN)MnIV(O)]2+– (Sc2+)2.
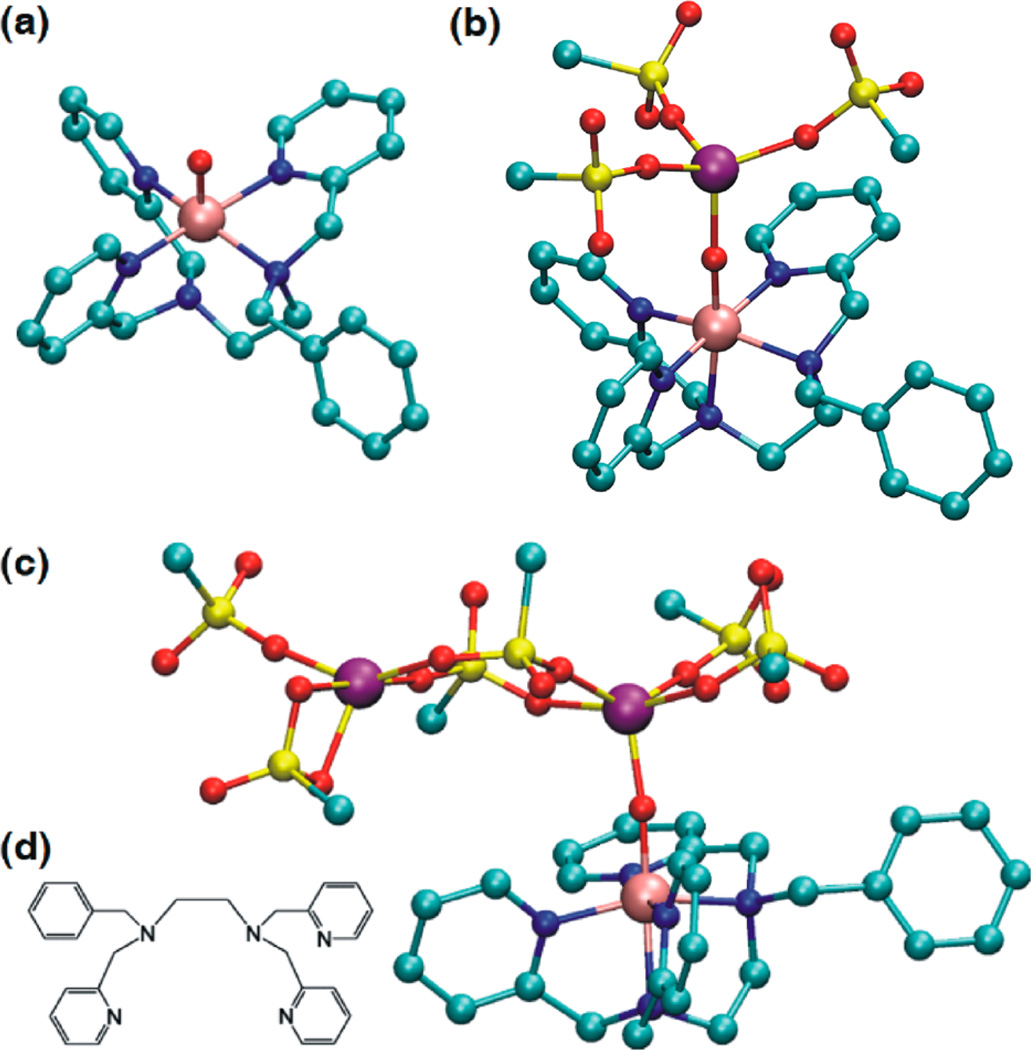
Density functional theory (DFT)44 calculations of the MnIV(O)–(Sc3+)2 complex suggest that one Sc3+ ion binds directly to the oxo moiety of the MnIV(O) complex but the second Sc3+ ion is located at the secondary coordination sphere (see the DFT-optimized structures in Figure 2).37,45 As shown previously, the Mn–O bond is elongated upon one Sc3+ binding (from 1.68 Å to 1.75 Å), but no further elongation is seen upon binding of the second Sc3+ ion (Table S2 in SI). This result is in a good agreement with that obtained from EXAFS experiments. This is also in line with what has been observed previously with [(N4Py)MnIV(O)]2+ (2).37 The significant blue shift in the absorption band of the MnIV(O)–(Sc3+)2 complex as compared with that of the MnIV(O)–(Sc3+)1 complex indicates that the electronic state of the MnIV(O) moiety is somewhat perturbed by binding of the second Sc3+ ion, but the conservation of the core geometry in MnIV(O)–(Sc3+)2, compared to MnIV(O)–(Sc3+)1, suggests that the changes mostly affect the unoccupied virtual orbitals (such as σ*xy). The blue-shift indicates that the virtual orbitals are shifted higher in energy relative to HOMO, hence stabilizing the occupied orbitals.46 The Mulliken spin density distribution shows negligible spin on the Sc3+ or counteranion atoms in all cases, while showing around three radicals in total for the Mn(O)-5xN moiety (Table S3 in the SI), indicating that the MnIV(O) configuration is kept after Sc3+ binding. Indeed, natural orbital analysis showed that the valence orbital occupation was (δ, π*xz, and π*yz) corresponding to highspin MnIV(O). In addition, none of the nine valence MnIV(O) orbitals with Mn d-orbital elements in it is mixing with Sc3+ orbitals, indicating a pure ionic MnIV(O)–Sc3+ bond despite the short distance (1.94 Å). Hence, the MnIV–O bond elongation can be attributed to pure Coulomb interactions rather than to changes in the electronic structure.
Figure 2.
DFT-optimized structures of (a) [(Bn-TPEN)MnIV(O)]2+ (1), (b) [(Bn-TPEN)MnIV(O)–Sc(OTf)3]2+, and (c) [(Bn-TPEN)-MnIV(O)–[Sc(OTf)3]2]2+, calculated at the B3LYP/LACVP level in the solvent phase. The Mn–O bond lengths of [MnIV(O)]2+, [MnIV(O)]2+–Sc3+, and [MnIV(O)]2+–(Sc3+)2 were calculated to be 1.68, 1.75, and 1.75 Å, respectively (see the DFT Calculations Section in the the SI for computational details). H atoms in Bn-TPEN and F atoms in the OTf-counterions have been omitted for clarity (Mn, pink; N, blue; O, red; C, green; Sc, purple; S, yellow). (d) Schematic drawing of the Bn-TPEN ligand.
Positive Shifts in One-Electron Reduction Potentials of Nonheme MnIV(O) Complexes by Binding of Sc3+ Ions
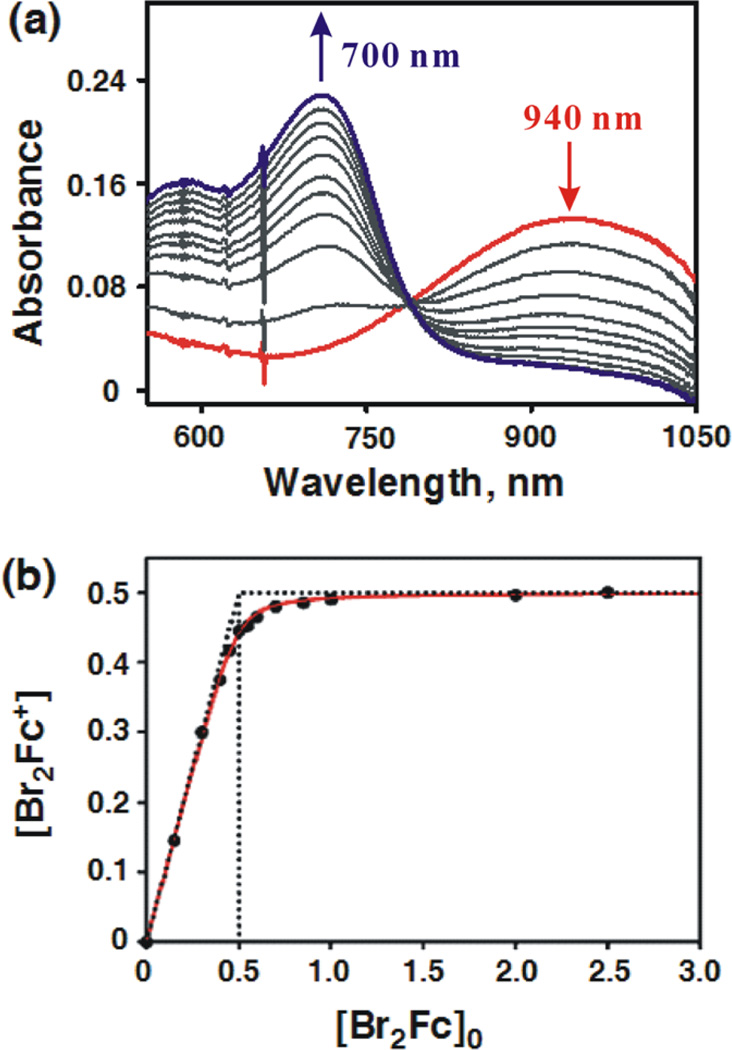
Electron transfer from ferrocene derivatives to MnIV(O) complexes 1 and 2 occurred to completion in CF3CH2OH/ CH3CN (v/v = 1:1) at 273 K (Figure 3a). The solvent mixture was used due to the solubility of electron donors and the stability of 1 and 2; both of which are quite stable at 273 K. The redox titration for formation of dibromoferrocenium ion (Br2Fc+) in Figure 3b indicates only one-electron reduction of 2 occurred without further reduction by Br2Fc (see Table 1 for Eox values of electron donors). This result is in agreement with the result of the redox titration of 1 with dibromoferrocene (Br2Fc) reported previously.41b
Figure 3.
(a) Absorption spectral changes observed in electron transfer from dibromoferrocene (Br2Fc; 5.0 × 10⁻³ M) to [(N4Py)-MnIV(O)]2+ (2; 5.0 × 10⁻⁴ M) in CF3CH2OH/CH3CN (v/v = 1:1) at 273 K. (b) Plot of concentration of Br2Fc+ produced in electron transfer from Br2Fc to 2 vs initial concentration of Br2Fc, [Br2Fc]0.
Table 1.
One-Electron Oxidation Potentials (Eox) of Electron Donors and Second-Order Rate Constants of Electron Transfer from Electron Donors to 1 and 2 in the Absence and Presence of Sc(OTf)3 (10 mM) with Driving Force of Electron Transfer (–ΔGet) in CF3CH2OH/CH3CN (v/v = 1:1) at 273 K
| [(Bn-TPEN)MnIV(O)]2+a |
[(N4Py)MnIV(O)]2+ |
||||
|---|---|---|---|---|---|
| electron donor | Eox, V vs SCEa | kobs, M−1 s−1 | −ΔGet, eV | kobs, M−1 s−1 | −ΔGet, eV |
| dimethylferrocene | 0.26 | (1.0 ± 0.1) × 105 | 0.52 | ||
| ferrocene | 0.37 | (6.1 ± 0.3) × 103 | 0.41 | (8.2 ± 0.1) × 103 | 0.43 |
| bromoferrocene | 0.54 | (9.3 ± 0.1) × 102 | 0.24 | (8.4 ± 0.3) × 102 | 0.26 |
| acetylferrocene | 0.62 | (9.3 ± 0.2) × 10 | 0.16 | (8.2 ± 0.2) × 10 | 0.18 |
| dibromoferrocene | 0.71 | (3.1 ± 0.1) × 10 | 0.07 | (4.3 ± 0.1) × 10 | 0.09 |
| [(Bn-TPEN)MnIV (O)]2+ – (Sc3+)2 |
[(N4Py)MnIV(O)]2+ – (Sc3+)2 |
||||
| electron donor | Eox, V vs SCEb | kobs, M−1 s−1 | −ΔGet, eV | kobs, M−1 s−1 | −ΔGet, eV |
| [FeII (Me2-phen)3]2+ | 0.94 | (1.7 ± 0.2) × 105 | 0.42 | (2.3 ± 0.1) × 105 | 0.48 |
| [FeII (Ph2-phen)3]2+ | 1.02 | (2.1 ± 0.1) × 104 | 0.34 | (2.4 ± 0.4) × 104 | 0.40 |
| [FeII (bpy)3]2+ | 1.06 | (3.6 ± 0.1) × 103 | 0.30 | (6.9 ± 0.1) × 103 | 0.36 |
| [FeII (5-Cl-phen)3]2+ | 1.20 | (4.1 ± 0.8) × 102 | 0.16 | (4.1 ± 0.2) × 102 | 0.22 |
| [RuII (bpy)3]2+ | 1.24 | (7.3 ± 0.1) × 10 | 0.12 | (6.4 ± 0.3) × 10 | 0.18 |
When ferrocene derivatives were replaced by a weaker reductant such as [RuII(bpy)3]2+ (bpy =2.2′-bipyridine; Eox = 1.24 V vs SCE), no electron transfer was observed. This is consistent with the lower one-electron reduction potential of 1 (Ered = 0.78 V vs SCE), as reported previously.41b The Ered value of 2 was also determined to be 0.80 V vs SCE by the redox titration using Br2Fc (Eox = 0.71 V vs SCE) (Figure 3b).
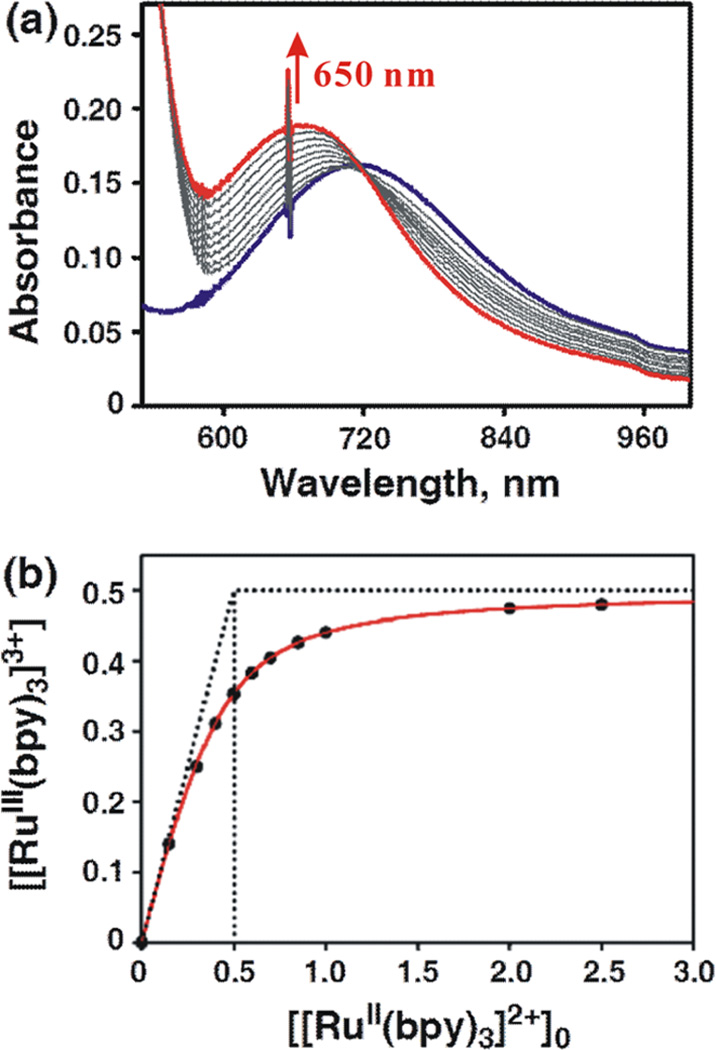
When the MnIV(O)–(Sc3+)1 complex of 1 was employed with 2 equiv of Sc(OTf)3 (2.0 mM), electron transfer from [RuII(bpy)3]2+ to the MnIV(O)–(Sc3+)1 complex became energetically feasible to occur as shown in Figure 4a, where the absorption band (λmax = 650 nm) due to [RuIII(bpy)3]3+ increased. In this case, however, the electron transfer from [RuII(bpy)3]2+ to the MnIV(O)–(Sc3+)1 complex was not complete with 2 equiv of [RuII(bpy)3]2+. Figure 4b shows the titration curve of the electron-transfer reaction, suggesting that electron transfer from [RuII(bpy)3]2+ to the MnIV(O)–(Sc3+)1 complex is in equilibrium with back electron transfer from the MnIII(O)–(Sc3+)1 complex to [RuIII(bpy)3]3+ (eq 1, where Ket is the electron-transfer equilibrium constant).
| (1) |
Figure 4.
(a) Absorption spectral changes observed in electron transfer from [RuII(bpy)]2+ (5.0 × 10⁻³ M) to [(Bn-TPEN)-MnIV(O)]2+–Sc3+ (5.0 × 10⁻⁴ M) in CF3CH2OH/CH3CN (v/v = 1:1) at 273 K. (b) Plot of concentration of [RuIII(bpy)3]3+ produced in electron transfer from [RuII(bpy)3]2+ to [(Bn-TPEN)MnIV(O)]2+– Sc3+ vs initial concentration of [RuII(bpy)3]2+, [[RuII(bpy)3]2+]0.
From the redox titration curve in Figure 4b, the Ket value was determined to be 5.7 (see a linear plot to determine the Ket value in Figure S4d in the SI).43 The Ered value of 1.28 V vs SCE for [(Bn-TPEN)MnIV(O)]2+–(Sc3+)1 was determined from the Ket value and the Eox value of [RuII(bpy)3]2+ (1.24 V vs SCE) using the Nernst equation (eq 2). This Ered value is significantly more positive than the Ered value of 1 (0.78 V vs SCE), which was reported previously.41b
| (2) |
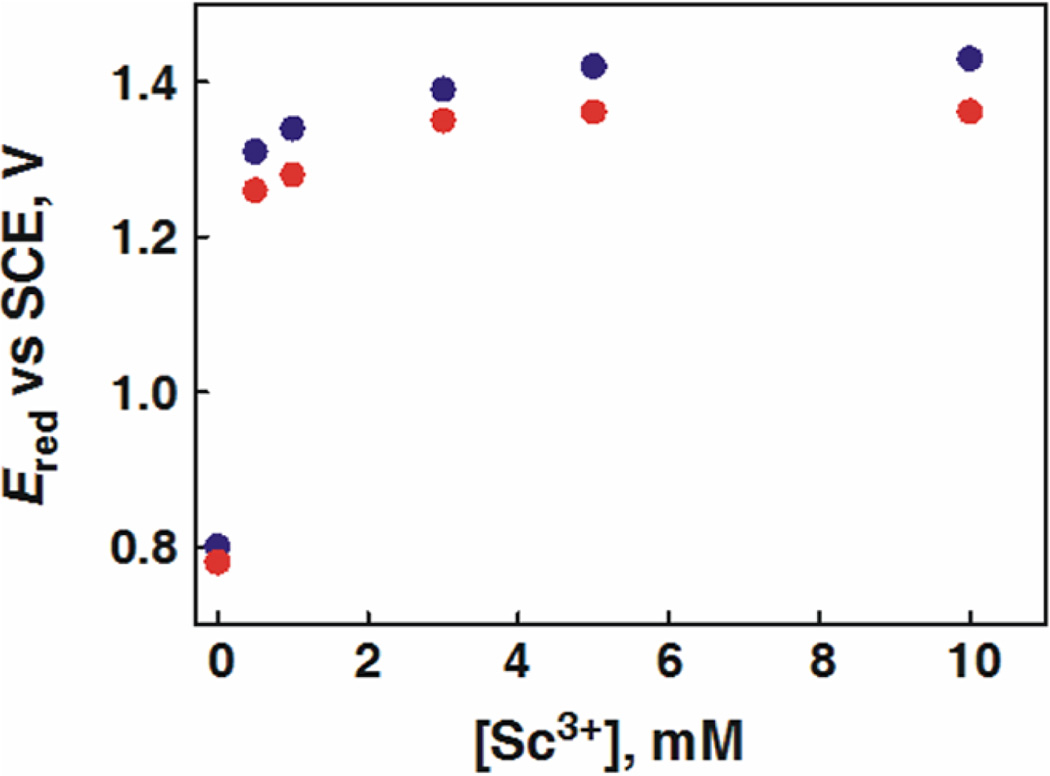
Similarly, the Ered values of 1 and 2 in the presence of various concentrations of Sc(OTf)3 were determined from the Ket values obtained by the redox titrations with [RuII(bpy)3]2+ (Eox = 1.24 V vs SCE) and [RuII(5-Cl-phen)3]2+ (5-Cl-phen = 5-chloro-1,10-phenanthroline; Eox = 1.36 V vs SCE; see Figures S4 and S5 in the SI). Figure 5 shows plots of Ered of 1 and 2 in the presence of various concentrations of Sc(OTf)3. The Ered values of 1 and 2 were shifted from 0.78 and 0.80 V vs SCE in the absence of Sc(OTf)3 to 1.28 and 1.31 V vs SCE in the presence of 1 equiv (for N4Py) or 2 equiv (for Bn-TPEN) of Sc(OTf)3, which correspond to the Ered values of the [MnIV(O)]2+–Sc3+ complexes of 1 and 2, respectively. The Ered values increase with increasing concentration of Sc(OTf)3 to reach constant values with more than 6 equiv of Sc(OTf)3. This is consistent with the UV–vis spectral change to produce the [MnIV(O)]2+–(Sc3+)2 complex in Figure 1b. The saturated Ered values of 1.36 and 1.42 V vs SCE in the presence of large excess Sc(OTf)3 correspond to those of the [MnIV(O)]2+– (Sc3+)2 complexes of 1 and 2, respectively. These Ered values are summarized in Table 2. There is a large difference in the Ered values between [MnIV(O)]2+ and [MnIV(O)]2+–Sc3+, indicating that the binding of Sc3+ to [MnIII(O)]+ is much stronger than that to [MnIV(O)]2+ as expected from the increased basicity of the oxo moiety in [MnIII(O)]+. The smaller difference in Ered between [MnIV(O)2+]–(Sc3+)1 and [MnIV(O)]2+–(Sc3+)2 may support the previous conclusion based on XANES/EXAFS analysis together with DFT calculations: second Sc3+ ion is located at the secondary coordination sphere rather than direct binding to the oxo moiety.37
Figure 5.
Dependence of Ered of [(N4Py)MnIV(O)]2+ (blue circles) and [(Bn-TPEN)MnIV(O)]2+ (red circles) on [Sc3+] in CF3CH2OH/ CH3CN (v/v = 1:1) at 273 K. The Ered values were determined from the equilibrium constants (Ket) between one electron donors and [(N4Py)MnIV(O)]2+.
Table 2.
One-Electron Reduction Potentials (Ered) and Reorganization Energies (λ) of Electron-Transfer Reduction of [MnIV(O)]2+, [MnIV(O)]2+–(Sc3+)1, and [MnIV(O)]2+– (Sc3+)2
| complex | Ered, V vs SCE | λ, eV |
|---|---|---|
| [(Bn-TPEN)MnIV(O)]2+ | 0.78 ± 0.01a | 2.24 ± 0.03a |
| [(Bn-TPEN)MnIV(O)]2+–(Sc3+)1 | 1.28 ± 0.02 | |
| [(Bn-TPEN)MnIV(O)]2+–(Sc3+)2 | 1.36 ± 0.02 | 2.12 ± 0.02 |
| [(N4Py)MnIV(O)]2+ | 0.80 ± 0.01 | 2.27 ± 0.03 |
| [(N4Py)MnIV(O)]2+–(Sc3+)1 | 1.31 ± 0.02 | |
| [(N4Py)MnIV(O)]2+–(Sc3+)2 | 1.42 ± 0.01 | 2.21 ± 0.02 |
Taken from ref 41b.
Comparison of Electron-Transfer Reactivity of Nonheme MnIV(O) Complexes with and without Sc3+ Ions
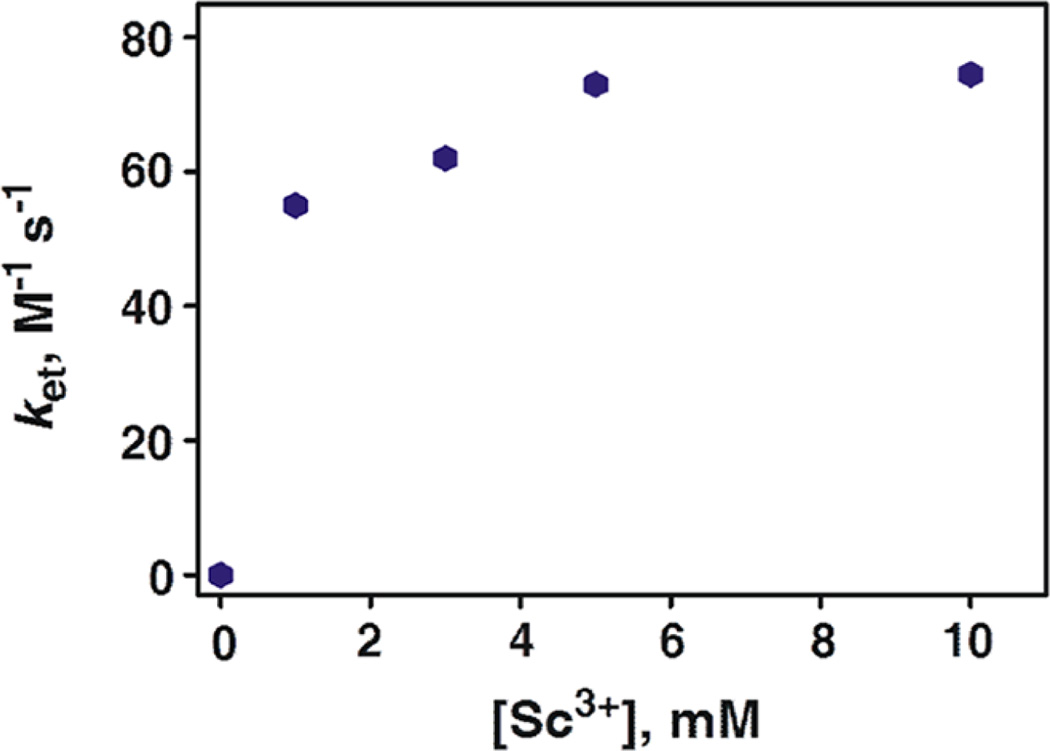
A remarkable positive shift of Ered values of [MnIV(O)]2+ complexes by binding one or two Sc3+ ions predicts the much enhanced electron-transfer reactivity. Rate constants of electron transfer from various electron donors to 1 and 2 in the absence and presence of Sc3+ were determined by monitoring the absorbance changes in reaction solutions due to the oxidized electron donors. Rates of electron transfer in the absence of Sc3+ obeyed pseudo-first-order kinetics in the presence of large excess of electron donors, and the observed pseudo-first-order rate constants (kobs) increased linearly with no intercept with concentrations of electron donors (Figure S6 in the SI). Rate constants of electron transfer from one-electron reductants to 1 and 2 in the presence of Sc3+ were determined under second-order reaction conditions (Figures S7 and S8 in the SI). The ket values increased with increasing concentration of Sc3+ in the conversion of [MnIV(O)]2+ to [MnIV(O)]2+– (Sc3+)2 (Figure 6). The ket values thus determined are listed in Table 1 along with the one-electron oxidation potentials (Eox) of donors and the driving force of electron transfer (–ΔGet).
Figure 6.
Dependence of ket on [Sc3+] for electron transfer from [RuII(bpy)3]2+ to [(Bn-TPEN)MnIV(O)]2+ in CF3CH2OH/CH3CN (v/v = 1:1) at 273 K.
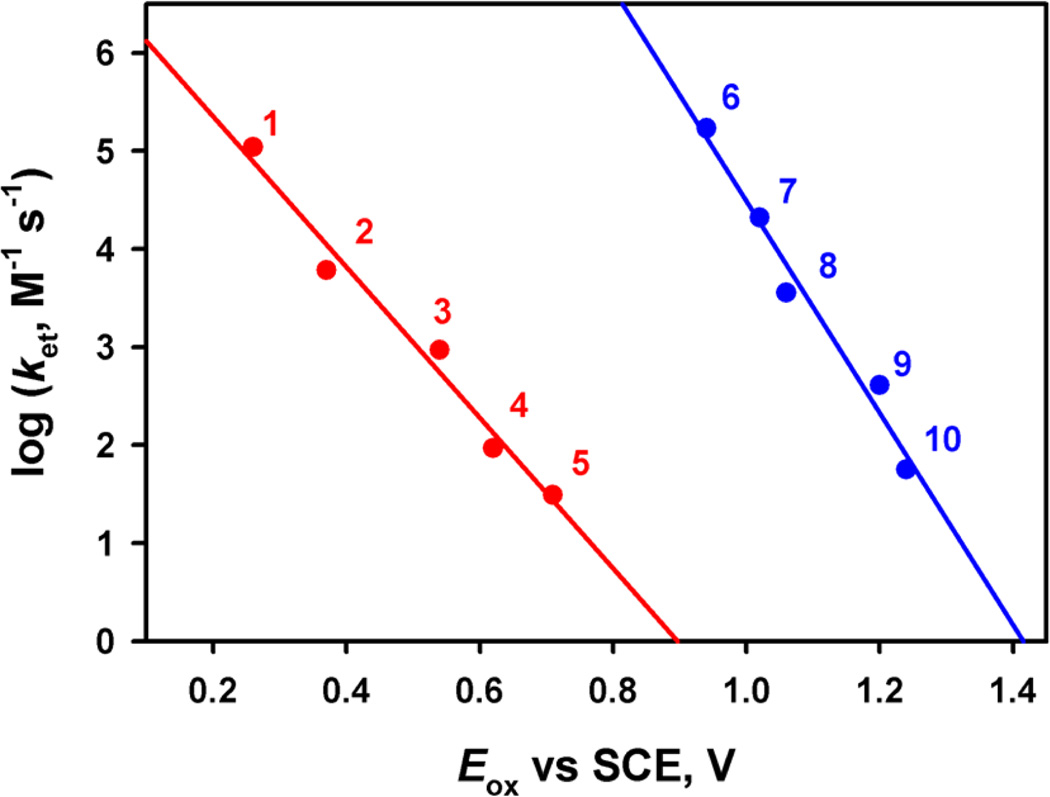
Figure 7 shows comparison of dependence of ket on Eox of electron donors for electron transfer from electron donors to [(Bn-TPEN)MnIV(O)]2+ (1) with that of electron transfer to [(Bn-TPEN)MnIV(O)]2+–(Sc3+)2 in the absence and presence of Sc(OTf)3 (5.0 mM) in CF3CH2OH/CH3CN (v/v = 1:1) at 273 K. The ket values of [MnIV(O)]2+–(Sc3+)2 are much larger than those of [MnIV(O)]2+.
Figure 7.
Plots of log ket vs the one-electron oxidation potentials of electron donors (Eox) for electron transfer from various electron donors [(1) dimethylferrocene, (2) ferrocene, (3) bromoferrocene, (4) acetylferrocene, (5) Br2Fc, (6) [FeII(Me2-phen)3]2+, (7) [FeII(Ph2-phen)3]2+, (8) [FeII(bpy)3]2+, (9) [FeII(5-Cl-phen)3]2+, and (10) [RuII(bpy)3]2+] to [(Bn-TPEN)MnIV(O)]2+ (red line) and [(MnIV(O)]2+–(Sc3+)2 (blue line) in CF3CH2OH/CH3CN (v/v = 1:1) at 273 K.
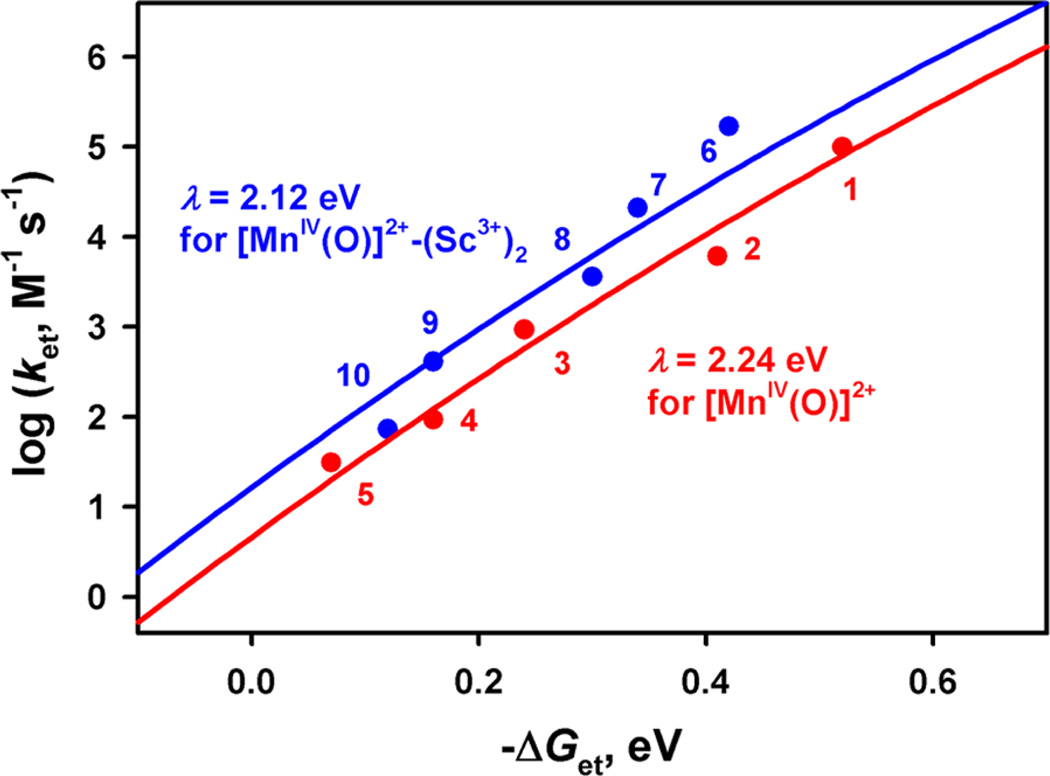
The driving force dependences of the rate constants of electron transfer from electron donors to [MnIV(O)]2+ and [MnIV(O)]2+–(Sc3+)2 for 1 are shown in Figure 8, where two different plots in Figure 7 are largely unified. The driving force dependence of log ket is well fitted by the solid line in Figure 8 in light of the Marcus theory of adiabatic outer-sphere electron transfer (eq 3)47
| (3) |
where Z is the collision frequency taken as 1 × 10¹¹ M−1 s−1, λ is the reorganization energy of electron transfer, kB is the Boltzmann constant, and T is the absolute temperature. The closer look of the fitting afforded slightly different λ values, such as one for [(Bn-TPEN)MnIV(O)]2+ (2.24 ± 0.03 eV) and the other for [(Bn-TPEN)MnIV(O)]2+–(Sc3+)2 (2.12 ± 0.02 eV). Similarly, the other λ values were determined with the Ered values, as listed in Table 2.
Figure 8.
Driving force (–ΔGet) dependence of rate constants (log ket) of electron transfer from one-electron donors [(1) dimethylferrocene, (2) ferrocene, (3) bromoferrocene, (4) acetylferrocene, (5) Br2Fc, (6) [FeII(Me2-phen)3]2+, (7) [FeII(Ph2-phen)3]2+, (8) [FeII(bpy)3]2+, (9) [FeII(5-Cl-phen)3]2+, and (10) [RuII(bpy)3]2+] to [(Bn-TPEN)MnIV(O)]2+ (red circles) and [(Bn-TPEN)MnIV(O)]2+– (Sc3+)2 (blue circles) in CF3CH2OH/CH3CN (v/v = 1:1) at 273 K. The blue and red lines are the Marcus lines calculated with λ values of 2.12 and 2.24 eV, respectively.
The λ values of the electron-transfer reduction of [MnIV(O)]2+ are similar to those determined for the electrontransfer reduction of iron(IV)–oxo complexes.23b This indicates that the one-electron reduction of high-valent metal–oxo complexes generally requires a large reorganization energy probably due to the significant elongation of metal–oxo bond upon one-electron reduction. The smaller λ value of [MnIV(O)]2+–(Sc3+)2, as compared with [MnIV(O)]2+, may be explained by the elongation of the MnIV–O bond prior to electron transfer because of binding of two Sc3+ ions, which results in smaller change in the Mn–O bond distance upon the electron transfer. It should be noted that [(N4Py)MnIV(O)]2+– (Sc3+)2 has the most positive Ered value as compared with those of iron(IV)–oxo complexes.23 Thus, [(N4Py)MnIV(O)]2+– (Sc3+)2 is regarded as the strongest oxidant among high-valent metal–oxo complexes reported so far.
Change in Mechanism from Direct Oxygen Atom Transfer to Electron Transfer in Sulfoxidation of Thioanisoles with Nonheme MnIV(O) Complexes by Binding of Sc3+ Ions
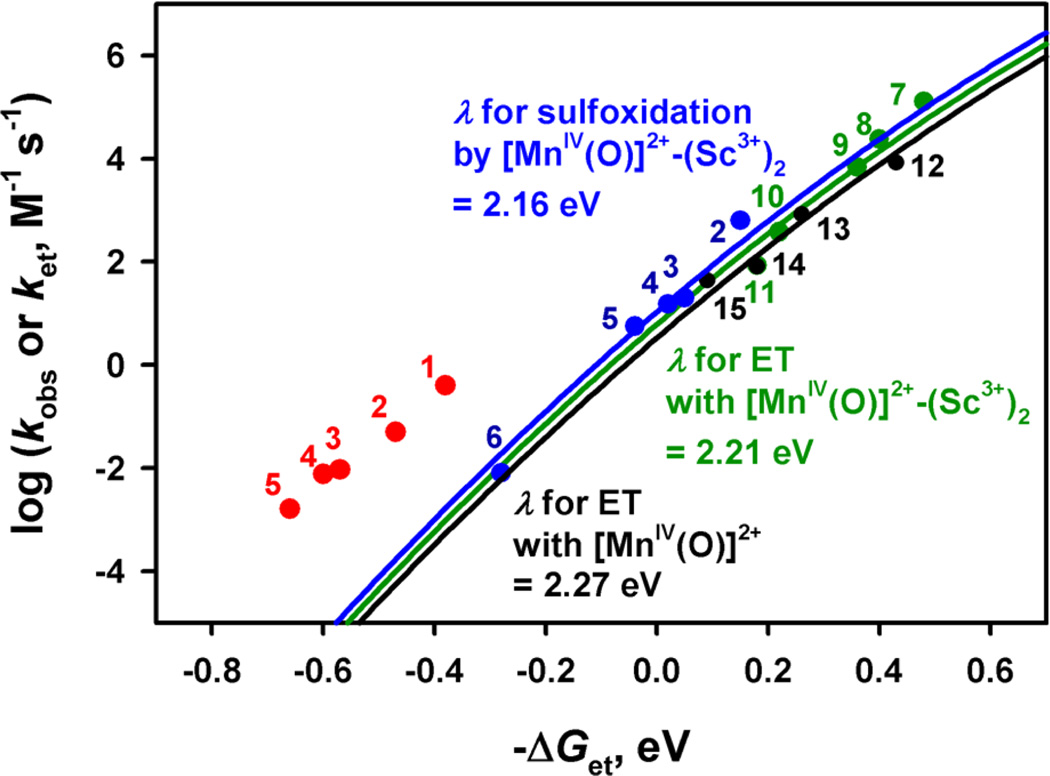
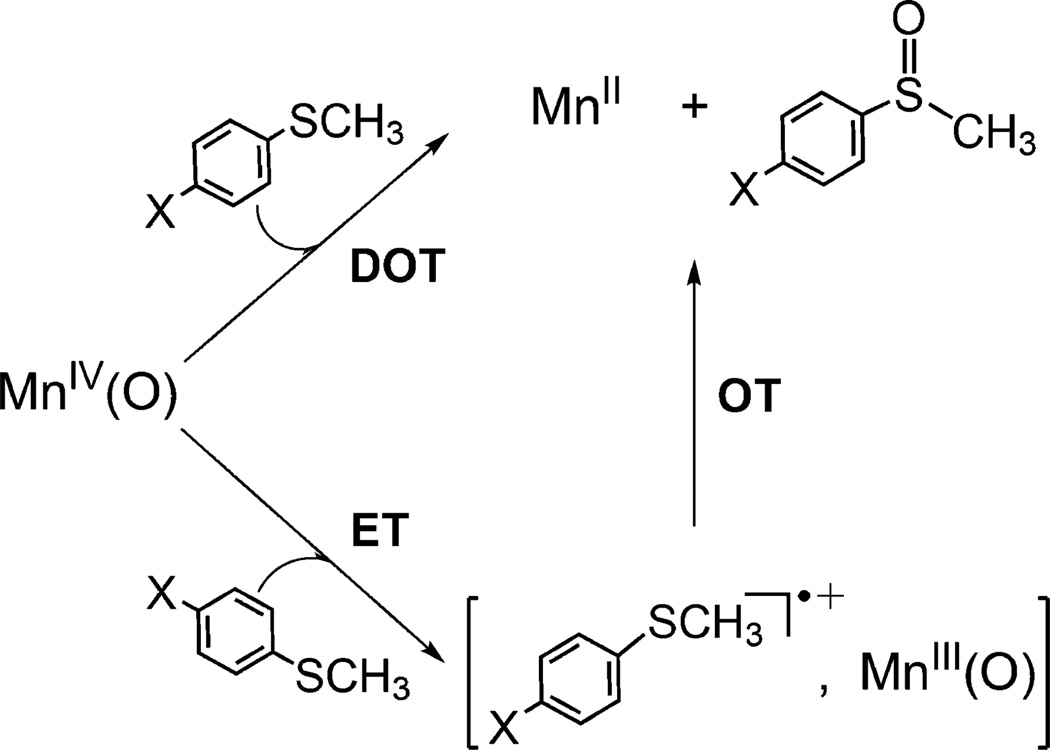
We have suggested previously that the mechanism of sulfoxidation of thioanisoles with [(N4Py)-MnIV(O)]2+ is changed from direct oxygen atom transfer (DOT) to electron transfer (ET) when Sc3+ ions are bound to [(N4Py)MnIV(O)]2+.37 This proposal is now verified by the electron-transfer driving force dependence of log kobs for sulfoxidation of thioanisoles with [(N4Py)MnIV(O)]2+ vs [(N4Py)MnIV(O)]2+–(Sc3+)2 (Figure 9). The kobs values of sulfoxidation of thioanisoles with [(N4Py)MnIV(O)]2+ are much larger than the predicted values of the solid line drawn based on eq 3 for outer-sphere electron-transfer reactions. This implies that much stronger interaction between thioanisoles and [(N4Py)MnIV(O)]2+ is required in the sulfoxidation reaction as compared with outer-sphere electron transfer from thioanisoles to [(N4Py)MnIV(O)]2+. Thus, the sulfoxidation reaction with [(N4Py)MnIV(O)]2+ proceeds via direct oxygen atom transfer. In contrast, the rate constants of sulfoxidation of thioanisoles with [(N4Py)MnIV(O)]2+– (Sc3+)2 fit well in the Marcus line for electron transfer from one-electron reductants to [(N4Py)MnIV(O)]2+–(Sc3+)2. Such an agreement clearly indicates that the sulfoxidation of thioanisoles by [(N4Py)MnIV(O)]2+–(Sc3+)2 proceeds via an outer-sphere electron-transfer pathway (Figure 9).
Figure 9.
Plots of log kobs for sulfoxidation of para-X-substituted thioanisoles [X = (1) MeO, (2) Me, (3) H, (4) F, (5) Br, and (6) CN] with [(N4Py)MnIV(O)]2+ (0.50 mM) in CF3CH2OH/CH3CN (v/v = 19:1) at 273 K vs the driving force of electron transfer [–ΔGet = e(Ered – Eox)] from the thioanisoles to [(N4Py)MnIV(O)]2+ in the absence of Sc3+ (red circles) and the presence of 5.0 mM Sc3+ (blue circles). The kobs values for the sulfoxidation were taken from ref 37. The black and green circles show the driving-force dependence of the rate constants (log ket) for electron transfer from one-electron reductants [(7) [FeII(Me2-phen)3]2+, (8) [FeII(Ph2-phen)3]2+, (9) [FeII(bpy)3]2+, (10) [FeII(5-Cl-phen)3]2+, (11) [RuII(bpy)3]2+, (12) ferrocene, (13) bromoferrocene, (14) acetylferrocene, and (15) Br2Fc] to [(N4Py)-MnIV(O)]2+ in the absence of Sc3+ (black circles) and the presence of 5.0 mM Sc3+ (green circles) in CF3CH2OH/CH3CN (v/v = 1:1) at 273 K. The blue, green, and black lines are the best fit of the Marcus lines calculated for blue, green, and black circles, respectively.
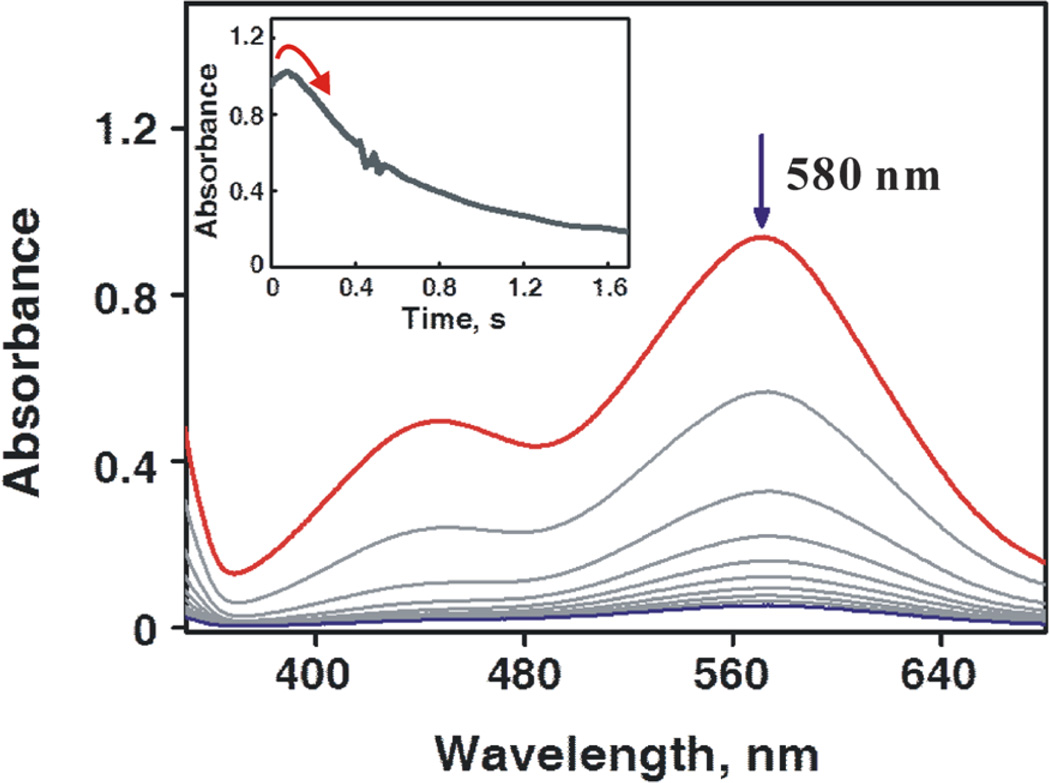
The occurrence of electron transfer was confirmed in the case of p-methoxythioanisole in the presence of Sc(OTf)3 (5.0 mM), where the driving force for electron transfer is positive (–ΔGet = 0.20 eV; i.e., a thermodynamically favorable process). As shown in Figure 10, the transient absorption band at 580 nm due to p-methoxythioanisole radical cation appeared instantly, followed by a relatively slow decay (see ref 30b for the reference spectrum of p-methoxythioanisole radical cation). The absorption band at 635 nm due to [(N4Py)MnIV(O)]2+– (Sc3+)2 was not detected even with a stopped-flow spectrometer since electron transfer from p-methoxythioanisole to [(N4Py)MnIV(O)]2+–(Sc3+)237 was extremely fast. These results clearly demonstrate that the electron-transfer pathway (ET/OT in Scheme 1) becomes dominant over the oxygen atom transfer pathway (DOT in Scheme 1) when the sulfoxidation by the MnIV(O) complex is carried out in the presence of Sc3+.
Figure 10.
UV–vis spectral changes in the reaction of [(N4Py)-MnIV(O)]2+ (6.25 × 10⁻⁵ M) with p-methoxythioanisole (1.25 × 10⁻³ M) in the presence of Sc(OTf)3 (6.25 × 10⁻⁴ M) in CF3CH2OH/CH3CN (v/v = 1:1) at 273 K. Inset shows the time course of absorbance at 580 nm due to p-methoxythioanisole radical cation.
Scheme 1.
CONCLUSION
The electron-transfer reactivity of nonheme MnIV(O) complexes was enhanced as much as 107-fold by binding of Sc3+ ions. A large positive shift in the one-electron reduction potential was observed by binding of Sc3+ ions to [MnIV(O)]2+ (e.g., from 0.80 V of [(N4Py)MnIV(O)]2+ to 1.42 V of [(N4Py)MnIV(O)]2+–(Sc3+)2). The reorganization energy of electron transfer becomes smaller by binding of Sc3+ ions because of the elongation of MnIV–O bond, which results in a smaller change in the Mn–O distance upon the electron transfer. Thus, nonheme MnIV(O) complexes become much stronger oxidants by binding of Sc3+ ions, resulting in the change of mechanism in the sulfoxidation of thioanisoles by MnIV(O) complexes, such as from a direct oxygen atom transfer pathway by [MnIV(O)]2+ to an electron transfer pathway by [MnIV(O)]2+–(Sc3+)x. The remarkable enhancement of the electron-transfer reactivity of MnIV(O) complexes by binding of Sc3+ ions may pave a new way to improve the catalytic reactivity of metal–oxo complexes in oxidation reactions.
EXPERIMENTAL SECTION
Materials
Commercially available chemicals were used without further purification unless otherwise indicated. Solvents were dried according to published procedures and distilled under Ar prior to use. Scandium triflate, Sc(OTf)3 (OTf = SO3CF3−), was purchased from Aldrich and used as received. Iodosylbenzene (PhIO) was prepared by a literature method.49 N4Py and Bn-TPEN ligands and MnII(OTf)2 2CH3CN were prepared by literature methods.20b,50 The [(N4Py)MnII(CH3CN)](CF3SO3)2 and [(Bn-TPEN)-MnII(CH3C(CF3SO3)2 complexes were prepared in a drybox.37,41 N4Py (0.54 mmol, 0.20 g) and MnII(OTf)2 2CH3CN (0.82 mmol, 0.32 g) were dissolved in CH3CN, and the reaction solution was stirred at ambient temperature overnight. The resulting solution was filtered and added to a large volume of Et2O. The product was obtained as a white solid with 60% yield (0.24 g). Bn-TPEN (0.47 mmol, 0.20 g) and MnII(CF3SO3)2 2CH3CN (0.57 mmol, 0.25 g) were dissolved in CH3CN and stirred at ambient temperature overnight. The resulting solution was filtered and added to a large volume of Et2O. The product was obtained as a white solid in 85% yield (0.38 g). One-electron reductants, such as [FeII(Me2-phen)3]2+, [FeII(Ph2-phen)3]2+, [FeII(bpy)3]2+, [FeII(5-Cl-phen)3]2+, and [RuII(bpy)3] +, were synthesized according to literature methods.51
DFT Calculations
Calculations were done with density functional theory (DFT)44 using the Gaussian 09 package52 and the B3LYP functional.53 Optimizing and single-point frequency calculations were done with the LACVP basis set54 (except for S, which required 6– 311+G*), while a single-point evaluation was done using the LACV3P*+ basis set54 in order to obtain more accurate Mulliken spin density distribution. All calculations (including the optimizations) were done in solvent (acetonitrile) using the CPCM scheme.55
Redox Titrations
Electron transfer from dibromoferrocene to [MnIV(O)]2+ (5.0 × 10⁻⁴ M) was examined from the spectral change in the various concentration of dibromoferrocene (1.5 × 10⁻⁴ to 5.0 × 10⁻² M) at 273 K. Typically, a deaerated CH3CN solution of dibromoferrocene (7.5 × 10⁻⁵ – 5.0 × 10⁻⁴ M) was added to a deaerated trifluoroethanol solution containing [MnIV(O)]2+ (5.0 × 10⁻⁴ M). The concentration of dibromoferrocenium ion (Br2Fc+) was determined from the absorption band at λ = 700 nm due to Br2Fc+ (ε = 4.0 × 10² M−1 cm−1). The ε value of Br2Fc+ was determined by the electron-transfer oxidation of Br2Fc with cerium(IV) ammonium nitrate (5.0 × 10⁻³ M) in CF3CH2OH/MeCN (v/v = 1:1) at 273 K. Likewise, electron transfer from [RuII(bpy)3]2+ to [MnIV(O)]2+– (Sc3+)1 (5.0 × 10⁻⁴ M) and [RuII(5-Cl-phen)3]2+ to [MnIV(O)]2+– (Sc3+)2 (5.0 × 10⁻⁴ M) were examined from the spectral change in the various concentration of [RuII(bpy)3]2+ (1.5 × 10⁻⁴ to 5.0 × 10⁻² M) and [RuII(5-Cl-phen)3]2+ at 273 K.
Kinetic Measurements
Kinetic measurements were performed in CF3CH2OH/CH3CN (v/v = 1:1) at 273 K. Rates of electron transfer from ferrocene derivatives to [MnIV(O)]2+ (2.5 × 10⁻⁴ M) were investigated by the formation and decay of absorption bands due to ferrocenium ion and [MnIV(O)]2+, respectively. Kinetic measurements for rates of electron transfer from various electron donors to [MnIV(O)]2+–(Sc3+)1 and [MnIV(O)]2+–(Sc3+)2 were carried out under second-order conditions, where both concentrations of electron donors and [MnIV(O)]2+–(Sc3+)1 or [MnIV(O)]2+–(Sc3+)2 were 1.25 × 10⁻⁴ M, because electron transfer rates were too fast to follow under pseudo-order conditions even with use of a stopped-flow equipment.
Instrumentation
UV-vis spectra were recorded on a Hewlett-Packard 8453 diode array spectrophotometer equipped with a UNISOKU Scientific Instruments Cryostat USP-203A for low-temperature experiments or on a UNISOKU RSP-601 stopped-flow spectrometer equipped with a MOS-type highly sensitive photodiodearray. X-band EPR spectra were recorded at 5 K using X-band Bruker EMX-plus spectrometer equipped with a dual mode cavity (ER 4116DM). Low temperature was achieved and controlled with an Oxford Instruments ESR900 liquid He quartz cryostat with an Oxford Instruments ITC503 temperature and gas flow controller. The experimental parameters for EPR measurement were as follows: microwave frequency = 9.646 GHz, microwave power = 1.0 mW, modulation amplitude = 10 G, gain = 1.0 × 10⁴, modulation frequency = 100 kHz, time constant = 40.96 ms, and conversion time = 81.00 ms.
Supplementary Material
ACKNOWLEDGMENTS
The research at OU was supported by Grant-in-Aid (No. 20108010 to S.F.) and Global COE program, “the Global Education and Research Center for Bio-Environmental Chemistry” from the Ministry of Education, Culture, Sports, Science and Technology, Japan (to S.F.). The research at EWU was supported by NRF/MEST of Korea through CRI (to W.N.), GRL (2010-00353) (to W.N.), 2011 KRICT OASIS project (to W.N.), and WCU (R31-2008-000-10010-0) (to W.N. and S.F.). XAS data were measured at the Stanford Synchrotron Radiation Lightsource (SSRL), a Directorate of SLAC National Accelerator Laboratory, and an Office of Science User Facility operated for the U.S. Department of Energy Office of Science by Stanford University. The SSRL Structural Molecular Biology Program is supported by the National Institutes of Health and by the Department of Energy, Office of Biological and Environmental Research (BER). The publication was partially supported by National Institutes of Health (NIH) Grant No. 5 P41 RR001209.
Footnotes
ASSOCIATED CONTENT
Supporting Information
Experimental section for X-ray absorption spectroscopy (XAS), EXAFS least-squares fitting results (Table S1), DFT calculation (Tables S2 and S3), EPR spectra (Figure S1), XAS spectra (Figure S2), first and second binding constants (Figure S3), redox titrations (Figures S4 and S5), kinetic data (Figures S6–S8), DFT calculated coordinates, and complete ref 52. This material is available free of charge via the Internet at http://pubs.acs.org.
The authors declare no competing financial interest.
NOTE ADDED AFTER ISSUE PUBLICATION
The name of author Shunichi Fukuzumi was corrected online on July 3, 2013.
Contributor Information
Wonwoo Nam, Email: wwnam@ewha.ac.kr.
Shunichi Fukuzumi, Email: fukuzumi@chem.eng.osaka-u.ac.jp.
REFERENCES
- 1.(a) Ortiz de Montellano PR. Cytochrome P450: Structure, Mechanism, and Biochemistry. 3rd ed. New York: Kluwer Academic/Plenum Publishers; 2005. [Google Scholar]; (b) Meunier B, editor. Biomimetic Oxidations Catalyzed by Transition Metal Complexes. London: Imperial College Press; 2000. [Google Scholar]; (c) Sigel A, Sigel H, Sigel RKO, editors. The Ubiquitous Role of Cytochrome P450 Proteins In Metal Ions in Life Sciences. Vol. 3. Chichester, England: John Wiley & Sons Ltd.; 2007. [Google Scholar]
- 2.(a) Sono M, Roach MP, Coulter ED, Dawson JH. Chem. Rev. 1996;96:2841. doi: 10.1021/cr9500500. [DOI] [PubMed] [Google Scholar]; (b) Watanabe Y. J. Biol. Inorg. Chem. 2001;6:846. doi: 10.1007/s007750100278. [DOI] [PubMed] [Google Scholar]; (c) Jung C. Biochim. Biophys. Acta. 2011;1814:46. doi: 10.1016/j.bbapap.2010.06.007. [DOI] [PubMed] [Google Scholar]; (d) Denisov IG, Makris TM, Sligar SG, Schlichting I. Chem. Rev. 2005;105:2253. doi: 10.1021/cr0307143. [DOI] [PubMed] [Google Scholar]
- 3.(a) Rittle J, Green MT. Science. 2010;330:933. doi: 10.1126/science.1193478. [DOI] [PubMed] [Google Scholar]; (b) Makris TM, von Koenig K, Schlichting I, Sligar SG. J. Inorg. Biochem. 2006;100:507. doi: 10.1016/j.jinorgbio.2006.01.025. [DOI] [PubMed] [Google Scholar]; (c) Groves JT. Proc. Natl. Acad. Sci. U.S.A. 2003;100:3569. doi: 10.1073/pnas.0830019100. [DOI] [PMC free article] [PubMed] [Google Scholar]; (d) Groves JT. J. Inorg. Biochem. 2006;100:434. doi: 10.1016/j.jinorgbio.2006.01.012. [DOI] [PubMed] [Google Scholar]
- 4.(a) Usharani D, Janardanan D, Li C, Shaik S. Acc. Chem. Res. 2013;46:471. doi: 10.1021/ar300204y. [DOI] [PubMed] [Google Scholar]; (b) Krebs C, Fujimori DG, Walsh CT, Bollinger JM., Jr. Acc. Chem. Res. 2007;40:484. doi: 10.1021/ar700066p. [DOI] [PMC free article] [PubMed] [Google Scholar]
- 5.(a) Proshlyakov DA, Henshaw TF, Monterosso GR, Ryle MJ, Hausinger RP. J. Am. Chem. Soc. 2004;126:1022. doi: 10.1021/ja039113j. [DOI] [PubMed] [Google Scholar]; (b) Price JC, Barr EW, Hoffart LM, Krebs C, Bollinger JM., Jr. Biochemistry. 2005;44:8138. doi: 10.1021/bi050227c. [DOI] [PubMed] [Google Scholar]; (c) Price JC, Barr EW, Glass TE, Krebs C, Bollinger JM., Jr. J. Am. Chem. Soc. 2003;125:13008. doi: 10.1021/ja037400h. [DOI] [PubMed] [Google Scholar]
- 6.(a) Tinberg CE, Lippard S. J. Acc. Chem. Res. 2011;44:280. doi: 10.1021/ar1001473. [DOI] [PMC free article] [PubMed] [Google Scholar]; (b) Siewert I, Limberg C. Chem.–Eur. J. 2009;15:10316. doi: 10.1002/chem.200901910. [DOI] [PubMed] [Google Scholar]
- 7.(a) Hammarström L, Hammes-Schiffer S. Acc. Chem. Res. 2009;42:1859. doi: 10.1021/ar900267k. [DOI] [PubMed] [Google Scholar]; (b) McEvoy JP, Brudvig GW. Chem. Rev. 2006;106:4455. doi: 10.1021/cr0204294. [DOI] [PubMed] [Google Scholar]; (c) Pecoraro VL, Hsieh W-Y. Inorg. Chem. 2008;47:1765. doi: 10.1021/ic7017488. [DOI] [PubMed] [Google Scholar]
- 8.(a) Umena Y, Kawakami K, Shen J-R, Kamiya N. Nature. 2011;473:55. doi: 10.1038/nature09913. [DOI] [PubMed] [Google Scholar]; (b) Siegbahn PEM. Acc. Chem. Res. 2009;42:1871. doi: 10.1021/ar900117k. [DOI] [PubMed] [Google Scholar]
- 9.(a) Borovik AS. Acc. Chem. Res. 2005;38:54. doi: 10.1021/ar030160q. [DOI] [PubMed] [Google Scholar]; (b) Benet-Buchholz J, Comba P, Llobet A, Roeser S, Vadivelu P, Wadepohl W, Wiesner S. Dalton Trans. 2009:5910. doi: 10.1039/b902037c. [DOI] [PubMed] [Google Scholar]; (c) Hohenberger J, Ray K, Meyer K. Nat. Commun. 2012;3:720. doi: 10.1038/ncomms1718. [DOI] [PubMed] [Google Scholar]
- 10.(a) de Visser SP, Rohde J-U, Lee Y-M, Cho J, Nam W. Coord. Chem. Rev. 2013;257:381. [Google Scholar]; (b) McDonald AR, Que L., Jr. Coord. Chem. Rev. 2013;257:414. [Google Scholar]
- 11.(a) Meunier B, de Visser SP, Shaik S. Chem. Rev. 2004;104:3947. doi: 10.1021/cr020443g. [DOI] [PubMed] [Google Scholar]; (b) Shaik S, Cohen S, Wang Y, Chen H, Kumar D, Thiel W. Chem. Rev. 2010;110:949. doi: 10.1021/cr900121s. [DOI] [PubMed] [Google Scholar]; (c) Abu-Omar MM, Loaiza A, Hontzeas N. Chem. Rev. 2005;105:2227. doi: 10.1021/cr040653o. [DOI] [PubMed] [Google Scholar]; (d) Denisov IG, Makris TM, Sligar SG, Schlichting I. Chem. Rev. 2005;105:2253. doi: 10.1021/cr0307143. [DOI] [PubMed] [Google Scholar]; (e) Ortiz de Montellano PR. Chem. Rev. 2010;110:932. doi: 10.1021/cr9002193. [DOI] [PMC free article] [PubMed] [Google Scholar]
- 12.(a) Gunay A, Theopold KH. Chem. Rev. 2010;110:1060. doi: 10.1021/cr900269x. [DOI] [PubMed] [Google Scholar]; (b) Costas M. Coord. Chem. Rev. 2011;255:2912. [Google Scholar]
- 13.(a) Yin G. Acc. Chem. Res. 2013;46:483. doi: 10.1021/ar300208z. [DOI] [PubMed] [Google Scholar]; (b) Yin G. Coord. Chem. Rev. 2010;254:1826. [Google Scholar]
- 14.(a) Liua H-Y, HR Mahmooda M, Qiuc S-X, Chang CK. Coord. Chem. Rev. 2013;257:1306. [Google Scholar]; (b) Goldberg DP. Acc. Chem. Res. 2007;40:626. doi: 10.1021/ar700039y. [DOI] [PubMed] [Google Scholar]
- 15.(a) Cho J, Sarangi R, Nam W. Acc. Chem. Res. 2012;45:1321. doi: 10.1021/ar3000019. [DOI] [PMC free article] [PubMed] [Google Scholar]; (b) Cho J, Woo J, Han JE, Kubo M, Ogura T, Nam W. Chem. Sci. 2011;2:2057. [Google Scholar]
- 16.(a) Cho J, Jeon S, Wilson SA, Liu LV, Kang EA, Braymer JJ, Lim MH, Hedman B, Hodgson KO, Valentine JS, Solomon EI, Nam W. Nature. 2011;478:502. doi: 10.1038/nature10535. [DOI] [PMC free article] [PubMed] [Google Scholar]; (b) Rohde J-U, In J-H, Lim MH, Brennessel WW, Bukowski MR, Stubna A, Münck E, Nam W, Que L., Jr. Science. 2003;299:1037. doi: 10.1126/science.299.5609.1037. [DOI] [PubMed] [Google Scholar]
- 17.(a) Nam W. Acc. Chem. Res. 2007;40:522. doi: 10.1021/ar700027f. [DOI] [PubMed] [Google Scholar]; (b) Que L., Jr. Acc. Chem. Res. 2007;40:493. doi: 10.1021/ar700024g. [DOI] [PubMed] [Google Scholar]
- 18.(a) Gross Z. J. Biol. Inorg. Chem. 2001;6:733. doi: 10.1007/s007750100273. [DOI] [PubMed] [Google Scholar]; (b) Kerber WD, Goldberg DP. J. Inorg. Biochem. 2006;100:838. doi: 10.1016/j.jinorgbio.2006.01.031. [DOI] [PubMed] [Google Scholar]
- 19.(a) Mayer JM. Acc. Chem. Res. 2011;44:36. doi: 10.1021/ar100093z. [DOI] [PMC free article] [PubMed] [Google Scholar]; (b) Che C-M, Lo VK-Y, Zhou C-Y, Huang J-S. Chem. Soc. Rev. 2011;40:1950. doi: 10.1039/c0cs00142b. [DOI] [PubMed] [Google Scholar]
- 20.(a) Lubben M, Meetsma A, Wilkinson EC, Feringa B, Que L., Jr. Angew. Chem., Int. Ed. 1995;34:1512. [Google Scholar]; (b) Kaizer J, Klinker EJ, Oh NY, Rohde J-U, Song WJ, Stubna A, Kim J, Munck E, Nam W, Que L., Jr. J. Am. Chem. Soc. 2004;126:472. doi: 10.1021/ja037288n. [DOI] [PubMed] [Google Scholar]; (c) Klinker EJ, Kaizer J, Brennessel WW, Woodrum NL, Cramer CJ, Que L., Jr. Angew. Chem., Int. Ed. 2005;44:3690. doi: 10.1002/anie.200500485. [DOI] [PubMed] [Google Scholar]
- 21.(a) Hong S, Lee Y-M, Cho K-B, Sundaravel K, Cho J, Kim MJ, Shin W, Nam WJ. Am. Chem. Soc. 2011;133:11876. doi: 10.1021/ja204008u. [DOI] [PubMed] [Google Scholar]; (b) Tang H, Guan J, Zhang L, Liu H, Huang X. Phys. Chem. Chem. Phys. 2012;14:12863. doi: 10.1039/c2cp42423a. [DOI] [PubMed] [Google Scholar]; (c) Kumar D, Sastry GN, de Visser SP. J. Phys. Chem. B. 2012;116:718. doi: 10.1021/jp2113522. [DOI] [PubMed] [Google Scholar]
- 22.(a) Arias J, Newlands CR, Abu-Omar MM. Inorg. Chem. 2001;40:2185. doi: 10.1021/ic000917z. [DOI] [PubMed] [Google Scholar]; (b) Prokop KA, Neu HM, de Visser SP, Goldberg DPJ. Am. Chem. Soc. 2011;133:15874. doi: 10.1021/ja2066237. [DOI] [PubMed] [Google Scholar]; (c) Fertinger C, Hessenauer-Ilicheva N, Franke A, van Eldik R. Chem.–Eur. J. 2009;15:13435. doi: 10.1002/chem.200901804. [DOI] [PubMed] [Google Scholar]; (d) Arunkumar C, Lee Y-M, Lee JY, Fukuzumi S, Nam W. Chem.–Eur. J. 2009;15:11482. doi: 10.1002/chem.200901362. [DOI] [PubMed] [Google Scholar]; (e) Kumar A, Goldberg I, Botoshansky M, Buchman Y, Gross ZJ. Am. Chem. Soc. 2010;132:15233. doi: 10.1021/ja1050296. [DOI] [PubMed] [Google Scholar]; (f) Benet-Buchholz J, Comba P, Llobet A, Roeser S, Vadivelu P, Wiesner S. Dalton Trans. 2010;39:3315. doi: 10.1039/b924614b. [DOI] [PubMed] [Google Scholar]
- 23.(a) Fukuzumi S. Coord. Chem. Rev. 2013;257:1564. doi: 10.1016/j.ccr.2012.05.031. [DOI] [PMC free article] [PubMed] [Google Scholar]; (b) Lee Y-M, Kotani H, Suenobu T, Nam W, Fukuzumi SJ. Am. Chem. Soc. 2008;130:434. doi: 10.1021/ja077994e. [DOI] [PubMed] [Google Scholar]; (c) Fukuzumi S, Kotani H, Suenobu T, Hong S, Lee Y-M, Nam W. Chem.–Eur. J. 2010;16:354. doi: 10.1002/chem.200901163. [DOI] [PubMed] [Google Scholar]; (d) Comba P, Fukuzumi S, Kotani H, Wunderlich S. Angew. Chem., Int. Ed. 2010;49:2622. doi: 10.1002/anie.200904427. [DOI] [PubMed] [Google Scholar]
- 24.Fukuzumi S, Kotani H, Prokop KA, Goldberg DP. J. Am. Chem. Soc. 2011;133:1859. doi: 10.1021/ja108395g. [DOI] [PubMed] [Google Scholar]
- 25.(a) Park MJ, Lee J, Suh Y, Kim J, Nam WJ. Am. Chem. Soc. 2006;128:2630. doi: 10.1021/ja055709q. [DOI] [PubMed] [Google Scholar]; (b) Sastri CV, Lee J, Oh K, Lee YJ, Lee J, Jackson TA, Ray K, Hirao H, Shin W, Halfen JA, Kim J, Que L, Jr., Shaik S, Nam W. Proc. Natl. Acad. Sci. U.S.A. 2007;104:19181. doi: 10.1073/pnas.0709471104. [DOI] [PMC free article] [PubMed] [Google Scholar]; (c) Jeong YJ, Kang Y, Han A-R, Lee Y-M, Kotani H, Fukuzumi S, Nam W. Angew. Chem., Int. Ed. 2008;47:7321. doi: 10.1002/anie.200802346. [DOI] [PubMed] [Google Scholar]; (d) Lee Y-M, Dhuri SN, Sawant SC, Cho J, Kubo M, Ogura T, Fukuzumi S, Nam W. Angew. Chem., Int. Ed. 2009;48:1803. doi: 10.1002/anie.200805670. [DOI] [PubMed] [Google Scholar]
- 26.(a) Lee Y-M, Hong S, Morimoto Y, Shin W, Fukuzumi S, Nam W. J. Am. Chem. Soc. 2010;132:10668. doi: 10.1021/ja103903c. [DOI] [PubMed] [Google Scholar]; (b) Wilson SA, Chen J, Hong S, Lee Y-M, Clémancey M, Garcia-Serres R, Nomura T, Ogura T, Latour J-M, Hedman B, Hodfson KO, Nam W, Solomon EI. J. Am. Chem. Soc. 2012;134:11791. doi: 10.1021/ja3046298. [DOI] [PMC free article] [PubMed] [Google Scholar]
- 27.(a) England J, Guo Y, Van Heuvelen KM, Cranswick MA, Rohde GT, Bominaar EL, Münck E, Que L., Jr. J. Am. Chem. Soc. 2011;133:11880. doi: 10.1021/ja2040909. [DOI] [PMC free article] [PubMed] [Google Scholar]; (b) Xue G, De Hont R, Münck E, Que L., Jr. Nat. Chem. 2010;2:400. doi: 10.1038/nchem.586. [DOI] [PMC free article] [PubMed] [Google Scholar]; (c) Xue G, Fiedler AT, Martinho M, Münck E, Que L., Jr. Proc. Natl. Acad. Sci. U.S.A. 2008;105:20615. [Google Scholar]; (d) Shanmugam M, Xue G, Que L, Jr., Hoffman BM. Inorg. Chem. 2012;51:10080. doi: 10.1021/ic3015783. [DOI] [PMC free article] [PubMed] [Google Scholar]
- 28.(a) Gupta R, A. S. Borovik AS. J. Am. Chem. Soc. 2003;125:13234. doi: 10.1021/ja030149l. [DOI] [PubMed] [Google Scholar]; (b) Pestovsky O, Bakac A. J. Am. Chem. Soc. 2004;126:13757. doi: 10.1021/ja0457112. [DOI] [PubMed] [Google Scholar]; (c) Lam WWY, Man W-L, Lau T-C. Coord. Chem. Rev. 2007;251:2238. [Google Scholar]; (d) de Visser SP. J. Am. Chem. Soc. 2010;132:1087. doi: 10.1021/ja908340j. [DOI] [PubMed] [Google Scholar]; (e) Prokop KA, de Visser SP, Goldberg DP. Angew. Chem., Int. Ed. 2010;49:5091. doi: 10.1002/anie.201001172. [DOI] [PubMed] [Google Scholar]; (f) Kojima T, Nakayama K, Ikemura K, Ogura T, Fukuzumi S. J. Am. Chem. Soc. 2011;133:11692. doi: 10.1021/ja2037645. [DOI] [PubMed] [Google Scholar]
- 29.(a) Morimoto Y, Kotani H, Park J, Lee Y-M, Nam W, Fukuzumi S. J. Am. Chem. Soc. 2011;133:403. doi: 10.1021/ja109056x. [DOI] [PubMed] [Google Scholar]; (b) Park J, Morimoto Y, Lee Y-M, Nam W, Fukuzumi S. J. Am. Chem. Soc. 2011;133:5236. doi: 10.1021/ja200901n. [DOI] [PubMed] [Google Scholar]; (c) Park J, Morimoto Y, Lee Y-M, Nam W, Fukuzumi S. Inorg. Chem. 2011;50:11612. doi: 10.1021/ic201545a. [DOI] [PubMed] [Google Scholar]; (d) Morimoto Y, Park J, Kotani H, Lee Y-M, Nam W, Fukuzumi S. Inorg. Chem. 2012;51:10025. doi: 10.1021/ic3016723. [DOI] [PubMed] [Google Scholar]
- 30.(a) Park J, Morimoto Y, Lee Y-M, Nam W, Fukuzumi S. J. Am. Chem. Soc. 2012;134:3903. doi: 10.1021/ja211641s. [DOI] [PubMed] [Google Scholar]; (b) Park J, Lee Y-M, Nam W, Fukuzumi S. J. Am. Chem. Soc. 2013;135:5052. doi: 10.1021/ja311662w. [DOI] [PubMed] [Google Scholar]
- 31.(a) Fukuzumi S. Bull. Chem. Soc. Jpn. 1997;70:1. [Google Scholar]; (b) Fukuzumi S. Org. Biomol. Chem. 2003;1:609. doi: 10.1039/b300053b. [DOI] [PubMed] [Google Scholar]; (c) Fukuzumi S. Bull. Chem. Soc. Jpn. 2006;79:177. [Google Scholar]; (d) Fukuzumi S. Pure Appl. Chem. 2007;79:981. [Google Scholar]; (e) Fukuzumi S. Prog. Inorg. Chem. 2009;56:49. [Google Scholar]; (f) Fukuzumi S, Ohkubo K. Coord. Chem. Rev. 2010;254:372. [Google Scholar]
- 32.(a) Fukuzumi S, Ohkubo K. Chem.-Eur. J. 2000;6:4532. doi: 10.1002/1521-3765(20001215)6:24<4532::aid-chem4532>3.0.co;2-9. [DOI] [PubMed] [Google Scholar]; (b) Fukuzumi S, Yasui K, Suenobu T, Ohkubo K, Fujitsuka M, Ito O. J. Phys. Chem. A. 2001;105:10501. [Google Scholar]; (c) Yuasa J, Fukuzumi S. J. Am. Chem. Soc. 2006;128:14281. doi: 10.1021/ja0604562. [DOI] [PubMed] [Google Scholar]; (d) Yuasa J, Yamada S, Fukuzumi S. J. Am. Chem. Soc. 2006;128:14938. doi: 10.1021/ja064708a. [DOI] [PubMed] [Google Scholar]; (e) Yuasa J, Yamada S, Fukuzumi S. J. Am. Chem. Soc. 2008;130:5808. doi: 10.1021/ja8001452. [DOI] [PubMed] [Google Scholar]; (f) Yuasa J, Fukuzumi S. J. Phys. Org. Chem. 2008;21:886. [Google Scholar]
- 33.(a) Lam WWY, Yiu S-M, Lee JMN, Yau SKY, Kwong H-K, Lau T-C, Liu D, Lin Z. J. Am. Chem. Soc. 2006;128:2851. doi: 10.1021/ja0552951. [DOI] [PubMed] [Google Scholar]; (b) Yiu S-M, Man W-L, Lau T-C. J. Am. Chem. Soc. 2008;130:10821. doi: 10.1021/ja802625e. [DOI] [PubMed] [Google Scholar]; (c) Du H, Lo P-K, Hu Z, Liang H, Lau K-C, Wang Y-N, Lam WWY, Lau T-C. Chem. Commun. 2011;47:7143. doi: 10.1039/c1cc12024g. [DOI] [PubMed] [Google Scholar]
- 34.Fukuzumi S, Morimoto Y, Kotani H, Naumov P, Lee Y-M, Nam W. Nat. Chem. 2010;2:756. doi: 10.1038/nchem.731. [DOI] [PubMed] [Google Scholar]
- 35.(a) Yocum CF. Coord. Chem. Rev. 2008;252:296. [Google Scholar]; (b) Yachandra VK, Yano JJ. Photochem. Photobiol. B. 2011;104:51. doi: 10.1016/j.jphotobiol.2011.02.019. [DOI] [PMC free article] [PubMed] [Google Scholar]
- 36.(a) Wiechen M, Zaharieva I, Dau H, Kurz P. Chem. Sci. 2012;3:2330. [Google Scholar]; (b) Han X, Zhang T, Du J, Cheng F, Chen J. Chem. Sci. 2013;4:368. [Google Scholar]; (c) Park YJ, Cook SA, Sickerman NS, Sano Y, Ziller JW, Borovik AS. Chem. Sci. 2013;4:717. doi: 10.1039/C2SC21400H. [DOI] [PMC free article] [PubMed] [Google Scholar]
- 37.Chen J, Lee Y-M, Davis KM, Wu X, Seo MS, Cho K-B, Yoon H, Park HJ, Fukuzumi S, Pushkar YN, Nam W. J. Am. Chem. Soc. 2013;135:6388. doi: 10.1021/ja312113p. [DOI] [PubMed] [Google Scholar]
- 38.Leeladee P, Baglia RA, Prokop KA, Latifi R, de Visser SP, Goldberg DP. J. Am. Chem. Soc. 2012;134:10397. doi: 10.1021/ja304609n. [DOI] [PubMed] [Google Scholar]
- 39.(a) Tsui EY, Tran R, Yano J, Agapie T. Nat. Chem. 2013;5:293. doi: 10.1038/nchem.1578. [DOI] [PMC free article] [PubMed] [Google Scholar]; (b) Kanady JS, Mendoza-Cortes JL, Tsui EY, Nielsen RJ, Goddard WA, III, Agapie T. J. Am. Chem. Soc. 2013;135:1073. doi: 10.1021/ja310022p. [DOI] [PubMed] [Google Scholar]
- 40.Kanady JS, Tsui EY, Day MW, Agapie T. Science. 2011;333:733. doi: 10.1126/science.1206036. [DOI] [PubMed] [Google Scholar]
- 41.(a) Wu X, Seo MS, Davis KM, Lee Y-M, Chen J, Cho K-B, Pushkar YN, Nam W. J. Am. Chem. Soc. 2011;133:20088. doi: 10.1021/ja208523u. [DOI] [PubMed] [Google Scholar]; (b) Yoon H, Morimoto Y, Lee Y-M, Nam W, Fukuzumi S. Chem. Commun. 2012;48:11187. doi: 10.1039/c2cc36291k. [DOI] [PubMed] [Google Scholar]
- 42.Evans DF, Jakubovic DA. J. Chem. Soc., Dalton Trans. 1988:2927. [Google Scholar]
- 43.Fukuzumi S, Kondo Y, Mochizuki T, Tanaka T. J. Chem. Soc., Perkin Trans. 1989;2:1753. [Google Scholar]
- 44.Kohn W, Sham L. J. Phys. Rev. 1965;140:A1133. [Google Scholar]
- 45.A solvent molecule may coordinate to the Sc center. However, a solvent molecule was not incorporated in the present DFT calculations, which were performed to demonstrate that the second Sc3+ ion is located at the secondary coordination sphere. The exact structure has yet to be clarified.
- 46.The blue-shift in UV-vis indicates an increased energy gap between the HOMO-LUMO orbitals. However, this issue is not directly related to any increase/decrease in E red values, which is a measure of the LUMO orbital energy (not HOMO). The presence of Sc3+ can shift the energies of all the orbitals of the MnIVO moiety (including both HOMO and LUMO orbitals).
- 47.(a) Marcus RA. Annu. Rev. Phys. Chem. 1964;15:155. [Google Scholar]; (b) Marcus RA, Sutin N. Biochim. Biophys. Acta Rev. Bioenerg. 1985;811:265. [Google Scholar]; (c) Marcus RA. Angew. Chem., Int. Ed. Engl. 1993;32:1111. [Google Scholar]
- 48.Armarego WLF, Chai CLL. Purification of Laboratory Chemicals. 6th ed. Oxford, U.K: Pergamon Press; 2009. [Google Scholar]
- 49.Saltzman H, Sharefkin JG, editors. Organic Syntheses. Vol. V. New York: Wiley; 1973. p. 658. [Google Scholar]
- 50.(a) Lubben M, Meetsma A, Wilkinson EC, Feringa B, Que L., Jr. Angew. Chem., Int. Ed. 1995;34:1512. [Google Scholar]; (b) Duelund L, Hazell R, McKenzie CJ, Nielsen LP, Toftlund H. J. Chem. Soc., Dalton Trans. 2001:152. [Google Scholar]; (c) Groni S, Dorlet P, Blain G, Bourcier S, Guillot R, Anxolabéhère-Mallart E. Inorg. Chem. 2008;47:3166. doi: 10.1021/ic702238z. [DOI] [PubMed] [Google Scholar]
- 51.(a) Fussa-Rydel O, Zhang H-T, Hupp JT, Leidner CR. Inorg. Chem. 1989;28:1533. [Google Scholar]; (b) Fukuzumi S, Nakanishi I, Tanaka K, Suenobu T, Tabard A, Guilard R, Van Caemelbecke E, Kadish KM. J. Am. Chem. Soc. 1999;121:785. doi: 10.1021/ic990324s. [DOI] [PubMed] [Google Scholar]
- 52.Frisch MJ, et al. Gaussian 09, Revision B.01. Wallingford, CT: Gaussian Inc; 2009. [Google Scholar]
- 53.(a) Becke AD. Phys. Rev. A. 1988;38:3098. doi: 10.1103/physreva.38.3098. [DOI] [PubMed] [Google Scholar]; (b) Becke AD. J. Chem. Phys. 1993;98:1372. [Google Scholar]; (c) Becke AD. J. Chem. Phys. 1993;98:5648. [Google Scholar]; (a) Lee C, Yang W, Parr RG. Phys. Rev. B. 1988;37:785. doi: 10.1103/physrevb.37.785. [DOI] [PubMed] [Google Scholar]
- 54. The LACVP and LACV3P*+ basis sets uses pople style 6–31G and 6–311+G* basis sets (respectively) on all atoms except transition metals, where an ECP is used as defined in the quantum chemistry program Jaguar, version 7.7. New York, NY: Schrödinger, LLC; 2010. See also Hay PJ, Wadt WR. J. Chem. Phys. 1985;82:299. Dyall KG. Theor. Chem. Acc. 2004;112:403.
- 55.(a) Barone V, Cossi M. J. Phys. Chem. A. 1998;102:1995. [Google Scholar]; (b) Cossi M, Rega N, Scalmani G, Barone V. J. Comput. Chem. 2003;24:669. doi: 10.1002/jcc.10189. [DOI] [PubMed] [Google Scholar]
Associated Data
This section collects any data citations, data availability statements, or supplementary materials included in this article.


