

Abstract
The neocortex is organized into macroscopic functional maps. However, at the microscopic scale, the functional preference and degree of feature selectivity between neighboring neurons can vary considerably. In the primary visual cortex, adjacent neurons in iso-orientation domains share the same orientation preference, whereas neighboring neurons near pinwheel centers are tuned to different stimulus orientations. Moreover, several studies have found greater orientation selectivity in iso-orientation domains than in pinwheel centers. These differences suggest that neurons sample local inputs in a spatially homogenous fashion and independently of the location of their soma on the orientation map. Here we determine whether dendritic geometry is affected by neuronal position on the orientation map. We labeled individual layer 2/3 pyramidal neurons with fluorescent dyes in specific domains of the orientation map in cat primary visual cortex and imaged their dendritic trees in vivo by two-photon microscopy. We found that the circularity and uniformity of dendritic trees is independent of somatic position on the orientation map. Moreover, the dendrites of neurons located close to pinwheel centers extend across all orientation domains in an unbiased fashion. Thus, unbiased dendritic trees appear to provide an anatomical substrate for the systematic variations in feature selectivity across the orientation map.
Keywords: cortical orientation map, dendritic shape in vivo, mechanism of orientation selectivity, rules of connectivity, two-photon imaging, visual cortex
Introduction
In the primary visual cortex of primates, cats, and ferrets, the neuronal preference for visual stimulus orientation varies slowly and continuously across the cortical surface. This smooth map of stimulus orientation is punctuated by pinwheel centers, where the convergence of multiple orientation domains results in steep orientation gradients (Blasdel and Salama, 1986; Bonhoeffer and Grinvald, 1991). Pinwheel centers are thus ideal loci to assay the participation of short-range lateral inputs to the neurons' orientation tuning. In particular, several studies have observed broad orientation selectivity near pinwheel centers, suggesting that V1 neurons receive lateral inputs from their anatomical neighbors even when their orientation preferences differ. However, due to the technical difficulty in assessing orientation tuning in pinwheel centers, conflicting results have been reported (Maldonado et al., 1997; Schummers et al., 2002; Monier et al., 2003; Mariño et al., 2005; Ohki et al., 2006; Nauhaus et al., 2008; Hashemi-Nezhad and Lyon, 2012). Moreover, broad orientation tuning in pinwheels may be consistent with other connectivity schemes, e.g., purely feedforward (Ringach, 2007).
The role of local connectivity in orientation processing has also been inferred from extracellular injections of anatomical anterograde/retrograde tracers at known positions of the orientation map (Malach et al., 1993; Yousef et al., 2001; Mariño et al., 2005; Buzás et al., 2006; Liu et al., 2013). Together these studies suggest that local axonal projections are less selective than long-distance horizontal axons that target patches of visual cortex sharing similar orientation preferences. The horizontal distribution of the postsynaptic element, i.e., dendrites, has received less attention, despite the known experience-dependence of dendritic growth (Katz et al., 1989; Wong and Ghosh, 2002). One report described dendrites spreading across neighboring orientation domains (Malach et al., 1993), but labeling of neuronal populations by extracellular injection of biocytin lacks the specificity needed to trace single dendritic trees and ascertain their relationship to functional maps. More selective intracellular labeling in vivo has found that asymmetric dendritic trees do not predict the neuronal preference for stimulus orientation (Martin and Whitteridge, 1984). However, the relationship between dendritic morphology and the fine-scale orientation map was not studied (but see Buzás et al., 1998). Here, we take advantage of two-photon imaging to electroporate fluorescent dyes into single neurons at targeted orientation domains of the cat visual cortex, and to image their dendritic trees in vivo. We find no quantitative relationship between dendritic arbor geometry and the layout of the orientation map, suggesting that layer 2/3 pyramidal neurons integrate inputs from all their neighbors, even when their orientation preferences are different.
Materials and Methods
Targeted single-cell electroporation in vivo.
Our experimental procedures for in vivo imaging of single somato-dendritic trees in predetermined domains of the cortical orientation map were approved by our IACUC and have been described in detail previously (O'Herron et al., 2012). Briefly, experiments were performed on anesthetized (isofluorane, 1–2%) and paralyzed (vecuronium bromide, 0.2 mg/kg/h) cats of either sex (n = 14). A craniotomy (2 × 2 mm) was performed above primary visual cortex area 18 and the dura was removed. The brain was covered by warm agarose and the craniotomy sealed with a coverglass. The animal's head was rotated to minimize the slant of the cortical surface relative to horizontal. The cortex was illuminated with 630 nm light to record intrinsic signal responses to oriented visual stimuli (drifting gratings, 8 directions of motion, 0.062–0.125 cycles/°, 5 s duration interspersed with 14 s blanks, 4–8 repeats). False color orientation maps were generated in MATLAB software by vector averaging of the responses at each 7.4 × 7.4 μm pixel in the region of interest. To facilitate the comparison with two-photon data, nearest neighbor interpolation was performed (1 × 1 μm resolution). The coverglass was removed, taking care not to disturb the agar below or to change the angle of the cortical surface, and a pinwheel or an iso-orientation domain was targeted for single-cell electroporation. A patch pipette (1 μm tip) loaded with AlexaFluor 594 (100 μm, n = 19 neurons) or with OGB-1 hexapotassium salt (500 μm, n = 3 neurons) or with both dyes (n = 1 neuron) was inserted in the preselected functional domain, using cortical blood vessels as landmarks. The tip of the electrode was brought in close apposition to a cell body, by monitoring the electrode resistance and by puffing dye into the extracellular space to reveal the somas as shadows during two-photon imaging. Then, 1–3 electrical pulses (−8 to −10 mV, 10 ms) were delivered by an Axoporator 800A, resulting in immediate and selective labeling of the somato-dendritic tree (Fig. 1A). Finally, a high-resolution z-stack (1 or 2 μm steps) of the somato-dendritic tree was collected by two-photon microscopy (Fig. 1B). Typically, the field-of-view available with the two-photon compatible objective lens, e.g., 600 × 600 μm Olympus 20× 1.0 NA, was not always sufficiently wide to encompass the whole dendritic tree in a single z-stack. Thus, in 10 of 23 neurons additional adjacent z-stacks were collected and stitched together post hoc in Neurolucida software. To ensure that dendritic trees could be visualized in their entirety, we only targeted somas belonging to the upper stratum of layer 2/3 (170–250 μm below the pia).
Figure 1.

Experimental setup, reconstructions of dendritic arbors in vivo, and their location in orientation maps. A, Setup used for labeling and imaging dendritic trees in preselected domains of the orientation map. A neuron located in a chosen domain is electroporated with fluorescent dye and its dendritic tree is imaged with a two-photon microscope. B, Imaging planes through a neuron labeled with AlexaFluor 594 at different depths below the pia. Red inset and arrows show dendritic spines; yellow inset and arrows show axons. C, Z-projection (from 0 to 350 μm under the pia) of a neuron labeled with AlexaFluor 594 (top left) and reference image of the surface vasculature captured before intrinsic signal optical imaging (bottom right). To align the two datasets, vessels in the two-photon image were outlined (orange contours) and matched to the vessels in the CCD camera image. D, Sagittal view of six reconstructed somato-dendritic trees. E, The same six neurons were projected along the z-axis orthogonal to the cortical surface and positioned on the local orientation map. The distances between the somas of neurons 1–6 and their closest pinwheel centers are 57, 78, 326, 3, 65, and 459 μm, respectively.
Analyses.
Somato-dendritic trees were reconstructed post hoc in Neurolucida software by two investigators (M.L. and G.D.) blinded to the positions of the somas on the orientation maps. Axons had finer caliber than dendrites (Fig. 1B) and always extended beyond the region imaged by two-photon microscopy. Therefore, axons were not included in any of our reconstructions. The coordinates of the somato-dendritic tree were imported in MATLAB and converted to coordinates on the orientation map by matching the surface vessels in the two-photon z-stacks to those in the reference image acquired before intrinsic signal optical imaging (Fig. 1C). Only translations and rotations in the x-y plane were used (no stretching was performed). The positions of the pinwheels on the orientation map were determined by finding the local maxima of the circular variance over a 70-μm-radius sliding window. The somato-dendritic tree was projected along the axis orthogonal to the cortical surface and its envelope was compared with a circle using a circularity index:
where area(hull) is the area of the convex hull of the tree, i.e., the smallest convex polygon enclosing the projected tree, and area(circle) is the area of the smallest enclosing circle centered on the soma.
We also computed a uniformity index, by summing the 3D length of the dendrites in 30° wedges centered on the soma. The uniformity index of the resulting distribution is as follows:
where σ(length) and μ(length) are the SD and the mean of the summed dendritic length across wedges, respectively.
To evaluate potential biases in the spread of dendrites over neighboring orientation domains, we determined for each neuron the distribution of the dendrites on the orientation map, or “dendritic orientation distribution”, by finding the preferred orientations of the pixels corresponding to the dendritic tree coordinates. For comparison across neurons, the mean orientation of the pixels corresponding to the soma was subtracted from the dendritic orientation distributions, so that 0° corresponds to the somatic pixels orientation. Dendritic orientation distributions thus ranged from −90° to +90° in 15° bins, each bin measuring the summed 3D length lj of the dendrites traveling over pixels of orientation θj. The mean of each distribution, as well as the mean and confidence interval of the mean across distributions, were computed using the MATLAB CircStat toolbox (Berens, 2009). The selectivity of each distribution was measured by an orientation selectivity index (OSImeasured) analogous to the one classically computed in physiological studies of orientation tuning:
where ltotal is the total length of the dendrites and abs returns the magnitude of the resultant vector.
Then for each neuron, we determined whether the measured OSI was higher than expected from random sampling of the local orientation map as follows: first, the entire dendritic tree was rotated randomly around the soma 10,000 times. Second, the resulting dendritic orientation distributions were averaged and the OSI of the average distribution (OSIrandom) was computed. Finally exponential functions were fitted to the scatterplot of OSIs (measured and random) versus the distance between somas and pinwheel centers (see Fig. 4D):
where d is the distance between the soma and the nearest pinwheel center, and the two free parameters Amax and d50 represent the maximum OSI and the distance at which the OSI reaches its half-maximum, respectively.
Figure 4.
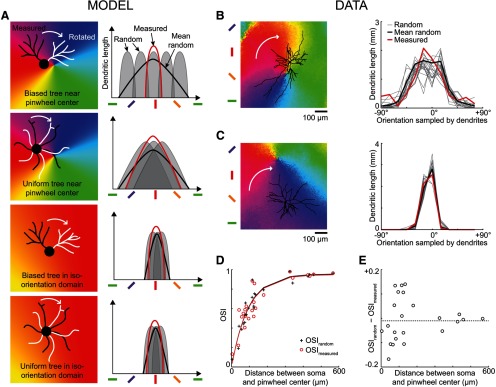
Spread of dendrites in neighboring orientation domains. A, Four possible combinations of symmetric/asymmetric dendritic trees located in pinwheels or iso-orientation domains (left column: black, original dendritic tree; white, rotated tree), and corresponding dendritic orientation distributions (right column: red, distribution before rotation; gray, distribution after random rotation; black, mean distribution after random rotation). The mean distribution after random rotation is broader than the original distribution when the tree is biased toward one of the orientation domains converging at a pinwheel center (row 1), but the two curves are similar in the other scenarios (rows 2–4). B, Z-projection of a dendritic tree located in a pinwheel (left) and the corresponding dendritic orientation distributions (right) before (thick red curve) and after random rotation (thin gray curves; mean, thick black curve). For clarity, only 20 of 10,000 distributions obtained after rotation are represented. C, Z-projected tree and dendritic orientation distributions of a different neuron located in an iso-orientation domain. D, Selectivity (OSI) of each neuron dendritic orientation distribution as a function of the distance between the soma and the closest pinwheel center (red circles, OSImeasured; black crosses, OSIrandom). The red and black curves correspond to the best exponential fits (red, measured: d50 = 64 μm, Amax = 0.95; black, random: d50 = 65 μm, Amax = 0.96). E, Difference between OSImeasured and OSIrandom as a function of the distance between soma and pinwheel center.
Results
Our population analyses are based on 23 spiny neurons, which had summed dendritic lengths (5.66 ± 1.51 mm, mean ± SD) and morphologies typical of those previously reported in postmortem histological studies of pyramidal neurons located at the top of layer 2/3 (O'Leary, 1941; Peters and Kara, 1985). Although a few neurons had a single, clearly defined apical trunk, in most cases two or more apical dendrites diverged very early or even directly from the soma, and climbed obliquely into layer 1 where they formed apical tufts (Fig. 1D). Because it was sometimes difficult to distinguish between apical and basal dendrites, they are pooled together in our analyses.
We traced the dendritic trees of neurons having soma located near pinwheel centers (Fig. 1E, neurons 1–2, 4–5) or in iso-orientation domains (Fig. 1E, neurons 3, 6). Qualitative inspection did not reveal any consistent relationship between the shape of the dendritic tree and the position of the soma on the orientation map. Round or circularly uniform dendritic trees were found close to as well as far away from pinwheel centers (Fig. 1E, neurons 1–3). Conversely, elongated or asymmetric dendritic trees were observed in pinwheels as well as in iso-orientation domains (Fig. 1E, neurons 4–6). Moreover, dendritic trees near pinwheel centers did not appear to be biased toward the orientation domain of the soma: dendrites extended over all the orientation domains converging on a pinwheel center, in a seemingly indiscriminate fashion. Some dendrites crossed the borders between orientation domains, whereas others followed them.
To quantify the relationship between dendritic tree morphology and the features of the orientation map, we measured the asymmetry of dendritic trees in iso-orientation domains and near pinwheel centers, using a circularity index and a uniformity index (Fig. 2). The circularity index compares the envelope of the dendritic tree to a circle: it is maximal and equal to one if the smallest convex polygon enclosing the dendritic tree, i.e., the convex hull of the tree, is a circle centered on the soma. The somato-dendritic tree shown in Figure 2A was located in a pinwheel (Fig. 1, neuron 1) and had a circularity index of 0.48 (Fig. 2B), greater than the population mean (0.39 ± 0.09, ± SD). Across our population of neurons, the circularity index was not significantly correlated to the distance between the soma and the nearest pinwheel center (R2 = 0.01, p = 0.60; Fig. 2C).
Figure 2.

The envelope and density of the dendritic tree is independent of the proximity to pinwheel centers. A, Z-projection of a traced somato-dendritic tree (Fig. 1, neuron 1) located close to a pinwheel center (red dot). B, Envelope (convex hull) of the dendritic tree shown in A. The center corresponds to the position of the soma. The circularity index is the ratio of the envelope area (gray) to the disc area (white), and is equal to 0.48 for this neuron. C, Circularity index as a function of the distance between soma and pinwheel center. D, Angular distribution of dendritic length in 30° wedges around the soma (same neuron as in A). The uniformity index is equal to 1 minus the coefficient of variation of dendritic lengths across bins and equals 0.70 for this neuron. E, Uniformity index as a function of the distance between soma and pinwheel center.
The circularity index does not take into account how the dendrites are distributed within the envelope of the dendritic tree. Therefore, we also measured a uniformity index, based on the coefficient of variation of dendritic length measured in wedges centered on the soma (Fig. 2D): the uniformity index is maximal and equal to one if the summed length of all dendrites in each wedge is the same. As was the case for the circularity index, we did not find any significant correlation between the uniformity index and the soma-to-pinwheel distance (R2 = 0.004, p = 0.76; Fig. 2E). Moreover, we found no correlation between the somatic depth and the circularity index (R2 = 0.006, p = 0.73) or the uniformity index (R2 = 0.001, p = 0.89).
Furthermore, we did not find any repulsive or attractive effect of pinwheel centers on the envelope of the trees (Fig. 3). The angle between the resultant vector of the dendritic tree envelope and the direction toward the closest pinwheel on the cortical surface (Fig. 3A, angle α) was uniformly distributed (Raleigh test, p = 0.49). In particular, the envelope of neurons located close to pinwheel centers could point toward (α = 0°) as well as away (α = 180°) from pinwheels (Fig. 3B). We obtained the same effect when the resultant vector was computed from the angular distribution of dendritic length (Fig. 3C; p = 0.53, Raleigh test). We conclude that the shape of pyramidal dendritic trees in layer 2/3 does not depend on the location of the soma on the cortical orientation map.
Figure 3.
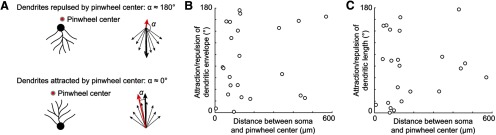
Dendrites are neither attracted nor repulsed by pinwheel centers. A, Schematic showing the relationship between biases in the angular distribution of dendrites around the soma and the angle α between the resultant vector of the dendritic tree envelope (thick black arrow) and the direction toward the nearest pinwheel center (red arrow). B, Angle α as a function of the distance between soma and pinwheel center. C, Equivalent analysis as shown in B, except that the resultant vector was computed based on the distributions of dendritic lengths.
Although the spatial distributions of dendrites around the soma were comparable in pinwheels and in iso-orientation domains, these distributions were not isotropic: the average circularity and uniformity indices across our sampled neurons were below unity, i.e., 0.39 and 0.44, respectively. Therefore, dendrites in pinwheels might still extend over a biased sample of orientation domains compared with the entire population of orientation preferences present around the soma. To detect such a bias, we computed the distributions of the dendrites on the orientation map, based on the preferred orientation of their corresponding pixels in the orientation map (Fig. 4). On average, the orientation of the pixels corresponding to the dendritic tree matched the orientation of the pixels corresponding to the soma: the difference between the mean orientations of the somatic and dendritic pixels was −4.7° ± 7.8° (mean ± 95% CI). We then compared these dendritic orientation distributions to those expected after random rotation of the tree around the soma. The toy model shown in Figure 4A illustrates how dendritic orientation distributions are affected by rotation (right column), depending on the isotropy of the dendritic tree and the proximity of a pinwheel center (left column). Unbiased dendritic trees result in broader dendritic orientation distributions near pinwheel centers than in iso-orientation domains (compare second and fourth rows), but these distributions are unaffected by rotation. The scenario depicted in the first row (dendritic tree biased toward one orientation domain of a pinwheel) is the only case where the orientation distributions vary across rotations. Thus, the resulting average distribution (thick black trace) is broader than the measured distribution before rotation (red trace). When we applied this analysis to our dataset we found that the dendritic orientation distributions were similar before and after rotation, whether the neuron was located in a pinwheel (Fig. 4B) or in an iso-orientation domain (Fig. 4C). Moreover, the dendritic orientation distribution was broader for the neuron located in the pinwheel. To validate these trends across our sample, we computed the selectivity of the dendritic orientation distributions by using an OSI analogous to the one computed in physiological studies of orientation tuning (Fig. 4D). The OSIs of the measured dendritic orientation distributions (OSImeasured, red circles) and the OSIs of the average of the distributions after rotation (OSIrandom, black crosses) were similar and followed the same exponential fit. Moreover, selectivity increased with distance from the center of a pinwheel, consistent with unbiased sampling of orientations near pinwheel centers and with physiological measures of orientation selectivity across the orientation map (Nauhaus et al., 2008; Hashemi-Nezhad and Lyon, 2012). Finally the difference between OSImeasured and OSIrandom was not significantly correlated to the distance between soma and pinwheel center (Fig. 4E; R2 = 0.007, p = 0.71). Thus, dendritic trees are not biased toward sampling from particular orientation domains.
Discussion
We found no relationship between the tangential organization of layer 2/3 pyramidal dendritic trees and the layout of orientation maps. The dendritic trees of neurons near and far from pinwheel centers are equally asymmetric, and can extend over multiple orientation domains. These results suggest that layer 2/3 pyramidal neurons integrate information locally from all their neighbors, even when they have different functional properties.
It is unlikely that we could have missed a hypothetical segregation of dendrites by orientation domains due to technical considerations such as the resolution of optical imaging or the alignment of dendritic fields relative to the layout of the orientation map. First, orientation maps obtained by intrinsic signal optical imaging and by two-photon calcium imaging are consistent (Ohki et al., 2006; O'Herron et al., 2012). We further quantified the relationship and found that the position of pinwheel centers between the two optical imaging techniques varied on average by 20 μm (range 7–33 μm, n = 3 cats). This range is small relative to the span of dendritic trees of cortical layer 2/3 pyramidal neurons (Fig. 1). Second, all neurons were electroporated under the visual control of a two-photon microscope, ensuring that they were located below the vessel-based position of the targeted pinwheel center or iso-orientation domain. Moreover, in vivo dendritic imaging avoided possible distortions due to histologic processing, such as tears or tissue shrinkage. Finally, we maintained the cortical surface as flat and horizontal as possible, and its angle relative to the optical apparatus was not changed when switching from intrinsic signal optical imaging to two-photon imaging (O'Herron et al., 2012). Any residual slant was accounted for post hoc during the projection of the somato-dendritic tree on the vessel map.
Our finding that dendritic trees extend across multiple orientation domains is consistent with physiological studies showing that the responses of layer 2/3 neurons in pinwheels can be influenced by a broad range of orientations (Mariño et al., 2005; Nauhaus et al., 2008; Hashemi-Nezhad and Lyon, 2012). In combination with isotropic local axonal projections near pinwheel centers (Mariño et al., 2005; Buzás et al., 2006), unbiased dendritic trees in layer 2/3 provide an anatomical substrate for pooling information across multiple orientations, and more generally, across functional domains (Hübener and Bolz, 1992; Kossel et al., 1995). For instance, in the macaque visual cortex, anatomical studies have shown that the dendrites of layer 2/3 pyramidal neurons can cross the borders between ocular dominance columns, contrary to those of layer 4 stellate cells which tend to stay in the column of the soma (Katz et al., 1989; Kossel et al., 1995). These differences in dendritic territories are matched at the input level: the LGN inputs to layer 4 stellate cells are segregated by ocular dominance columns, whereas the axonal fields of layer 4 stellate cells into layer 2/3 are much more extensive (Katz et al., 1989). As a result, neurons in layer 2/3 are more often binocular than those in layer 4 (Hubel and Wiesel, 1968). Whether, in the cat visual cortex, the dendrites of layer 4 neurons are more tightly constrained by the orientation map than those of layer 2/3 is still unknown. A comparison of dendritic geometry and orientation selectivity in layer 4 versus layer 2/3 neurons at similar positions on the orientation map may advance our understanding of how local and feedforward inputs are integrated during orientation processing (Mariño et al., 2005; Ringach, 2007).
The lack of a correlation between dendritic geometry and the organization of orientation maps does not rule out the possibility that receptive field properties can shape local wiring. First, some models of corticocortical connectivity based on Hebbian self-organization predict broad orientation tuning in pinwheels, due to isotropic lateral connections (Miikkulainen et al., 2005). Second, other functional maps encoding binocular disparity, ocular dominance, or spatial frequency may influence the structure of dendritic trees. Finally, dendrites could preferentially sample inputs from a subset of all the functional domains they cover. Whether any of these mechanisms is involved in wiring-up cortical microcircuits will likely be resolved with new techniques for imaging synaptic inputs in vivo (Jia et al., 2010; Levy et al., 2012).
Footnotes
This work was supported by grants to P.K. from the NIH (R01EY017925 and R21EY020985) and the Dana and Whitehall Foundations. We thank Frédéric Chavane, Pratik Chhatbar, Philip O'Herron, Adrien Schramm, and Zhiming Shen for discussions and comments on the paper.
The authors declare no competing financial interests.
References
- Berens P. CircStat: a MATLAB toolbox for circular statistics. J Stat Soft. 2009;31:1–21. [Google Scholar]
- Blasdel GG, Salama G. Voltage-sensitive dyes reveal a modular organization in monkey striate cortex. Nature. 1986;321:579–585. doi: 10.1038/321579a0. [DOI] [PubMed] [Google Scholar]
- Bonhoeffer T, Grinvald A. Iso-orientation domains in cat visual cortex are arranged in pinwheel-like patterns. Nature. 1991;353:429–431. doi: 10.1038/353429a0. [DOI] [PubMed] [Google Scholar]
- Buzás P, Eysel UT, Kisvárday ZF. Functional topography of single cortical cells: an intracellular approach combined with optical imaging. Brain Res Brain Res Protoc. 1998;3:199–208. doi: 10.1016/S1385-299X(98)00041-5. [DOI] [PubMed] [Google Scholar]
- Buzás P, Kovács K, Ferecskó AS, Budd JM, Eysel UT, Kisvárday ZF. Model-based analysis of excitatory lateral connections in the visual cortex. J Comp Neurol. 2006;499:861–881. doi: 10.1002/cne.21134. [DOI] [PubMed] [Google Scholar]
- Hashemi-Nezhad M, Lyon DC. Orientation tuning of the suppressive extraclassical surround depends on intrinsic organization of V1. Cereb Cortex. 2012;22:308–326. doi: 10.1093/cercor/bhr105. [DOI] [PubMed] [Google Scholar]
- Hubel DH, Wiesel TN. Receptive fields and functional architecture of monkey striate cortex. J Physiol. 1968;195:215–243. doi: 10.1113/jphysiol.1968.sp008455. [DOI] [PMC free article] [PubMed] [Google Scholar]
- Hübener M, Bolz J. Relationships between dendritic morphology and cytochrome oxidase compartments in monkey striate cortex. J Comp Neurol. 1992;324:67–80. doi: 10.1002/cne.903240106. [DOI] [PubMed] [Google Scholar]
- Jia H, Rochefort NL, Chen X, Konnerth A. Dendritic organization of sensory input to cortical neurons in vivo. Nature. 2010;464:1307–1312. doi: 10.1038/nature08947. [DOI] [PubMed] [Google Scholar]
- Katz LC, Gilbert CD, Wiesel TN. Local circuits and ocular dominance columns in monkey striate cortex. J Neurosci. 1989;9:1389–1399. doi: 10.1523/JNEUROSCI.09-04-01389.1989. [DOI] [PMC free article] [PubMed] [Google Scholar]
- Kossel A, Löwel S, Bolz J. Relationships between dendritic fields and functional architecture in striate cortex of normal and visually deprived cats. J Neurosci. 1995;15:3913–3926. doi: 10.1523/JNEUROSCI.15-05-03913.1995. [DOI] [PMC free article] [PubMed] [Google Scholar]
- Levy M, Schramm AE, Kara P. Strategies for mapping synaptic inputs on dendrites in vivo by combining two-photon microscopy, sharp intracellular recording, and pharmacology. Front Neural Circuits. 2012;6:101. doi: 10.3389/fncir.2012.00101. [DOI] [PMC free article] [PubMed] [Google Scholar]
- Liu YJ, Ehrengruber MU, Negwer M, Shao HJ, Cetin AH, Lyon DC. Tracing inputs to inhibitory or excitatory neurons of mouse and cat visual cortex with a targeted rabies virus. Curr Biol. 2013;23:1746–1755. doi: 10.1016/j.cub.2013.07.033. [DOI] [PMC free article] [PubMed] [Google Scholar]
- Malach R, Amir Y, Harel M, Grinvald A. Relationship between intrinsic connections and functional architecture revealed by optical imaging and in vivo targeted biocytin injections in primate striate cortex. Proc Natl Acad Sci U S A. 1993;90:10469–10473. doi: 10.1073/pnas.90.22.10469. [DOI] [PMC free article] [PubMed] [Google Scholar]
- Maldonado PE, Gödecke I, Gray CM, Bonhoeffer T. Orientation selectivity in pinwheel centers in cat striate cortex. Science. 1997;276:1551–1555. doi: 10.1126/science.276.5318.1551. [DOI] [PubMed] [Google Scholar]
- Mariño J, Schummers J, Lyon DC, Schwabe L, Beck O, Wiesing P, Obermayer K, Sur M. Invariant computations in local cortical networks with balanced excitation and inhibition. Nat Neurosci. 2005;8:194–201. doi: 10.1038/nn1391. [DOI] [PubMed] [Google Scholar]
- Martin KA, Whitteridge D. The relationship of receptive field properties to the dendritic shape of neurones in the cat striate cortex. J Physiol. 1984;356:291–302. doi: 10.1113/jphysiol.1984.sp015465. [DOI] [PMC free article] [PubMed] [Google Scholar]
- Miikkulainen R, Bednar JA, Choe Y, Sirosh Y. Computational maps in the visual cortex. New York: Springer; 2005. [Google Scholar]
- Monier C, Chavane F, Baudot P, Graham LJ, Frégnac Y. Orientation and direction selectivity of synaptic inputs in visual cortical neurons: a diversity of combination produces spike tuning. Neuron. 2003;37:663–680. doi: 10.1016/S0896-6273(03)00064-3. [DOI] [PubMed] [Google Scholar]
- Nauhaus I, Benucci A, Carandini M, Ringach DL. Neuronal selectivity and local map structure in visual cortex. Neuron. 2008;57:673–679. doi: 10.1016/j.neuron.2008.01.020. [DOI] [PMC free article] [PubMed] [Google Scholar]
- O'Herron P, Shen Z, Lu Z, Schramm AE, Levy M, Kara P. Targeted labeling of neurons in a specific functional micro-domain of the neocortex by combining intrinsic signal and two-photon imaging. J Vis Exp. 2012;70:e50025. doi: 10.3791/50025. [DOI] [PMC free article] [PubMed] [Google Scholar]
- Ohki K, Chung S, Kara P, Hübener M, Bonhoeffer T, Reid RC. Highly ordered arrangement of single neurons in orientation pinwheels. Nature. 2006;442:925–928. doi: 10.1038/nature05019. [DOI] [PubMed] [Google Scholar]
- O'Leary JL. Structure of the area striata of the cat. J Comp Neurol. 1941;75:131–164. doi: 10.1002/cne.900750107. [DOI] [Google Scholar]
- Peters A, Kara DA. The neuronal composition of area 17 of rat visual cortex: I. The pyramidal cells. J Comp Neurol. 1985;234:218–241. doi: 10.1002/cne.902340208. [DOI] [PubMed] [Google Scholar]
- Ringach DL. On the origin of the functional architecture of the cortex. PLoS ONE. 2007;2:e251. doi: 10.1371/journal.pone.0000251. [DOI] [PMC free article] [PubMed] [Google Scholar]
- Schummers J, Mariño J, Sur M. Synaptic integration by V1 neurons depends on location within the orientation map. Neuron. 2002;36:969–978. doi: 10.1016/S0896-6273(02)01012-7. [DOI] [PubMed] [Google Scholar]
- Wong RO, Ghosh A. Activity-dependent regulation of dendritic growth and patterning. Nat Rev Neurosci. 2002;3:803–812. doi: 10.1038/nrn941. [DOI] [PubMed] [Google Scholar]
- Yousef T, Toth E, Rausch M, Eysel UT, Kisvárday ZF. Topography of orientation centre connections in the primary visual cortex of the cat. Neuroreport. 2001;12:1693–1699. doi: 10.1097/00001756-200106130-00035. [DOI] [PubMed] [Google Scholar]