

Abstract
The anterior caudate nucleus is essential for goal-directed behavior because it links outcome information to actions. It is well known that caudate neurons provide a variety of reward-related and action signals. However, it is still unclear how the two signals are integrated. We investigated whether and how outcome risk modulates spatial representation. We recorded neural activity in the anterior caudate nucleus while monkeys made saccades to multiple spatial targets, each associated with either fixed (safe) or variable (risky) amount of reward. We report that individual neurons combined the outcome reward signal with spatial information about the direction of saccades. These signals could be reliably read out from the populations of neurons. Moreover, the prospect of a risky outcome improved the quality of spatial information. These results provide direct evidence that global spatial representation in the caudate is modulated by outcome, which can be important for flexible control of behavior, particularly during learning and habit formation, when outcomes vary.
Keywords: basal ganglia, decision making, electrophysiology, neuronal populations, nonhuman primates, risk
Introduction
Knowledge about variability in the potential outcomes of actions is important for learning about the environment. It helps an organism to form expectations about the consequences of its actions and to evaluate them accurately. Impaired ability to evaluate and learn based on outcome information characterizes pathological risk taking and addiction, which are often observed with compromised basal ganglia function (Volkow and Li, 2004; Kuhnen and Knutson, 2005).
The anterior caudate nucleus in the basal ganglia is important for both predicting and evaluating actions based on outcome information, consistent with its role in goal-directed behavior (Hikosaka et al., 2000; Graybiel, 2008; Balleine and O'Doherty, 2010). Lesions to this structure abolish the ability to select actions based on associated rewards (Yin et al., 2005). Neurons code expected and received reward (Hollerman et al., 1998; Hassani et al., 2001; Cromwell and Schultz, 2003) and the learned contingencies between actions and outcomes (Kimchi and Laubach, 2009a, 2009b; Stalnaker et al., 2010). These reward-related signals are present even after actions, suggesting a role in evaluation of behavior based on outcome (Thorn et al., 2010; Kim et al., 2013).
Despite the established view that the anterior caudate nucleus is essential in integrating actions and outcomes in a flexible manner (Pasupathy and Miller, 2005; Williams and Eskandar, 2006; Kimchi and Laubach, 2009b; Balleine and O'Doherty, 2010), the neural basis of how outcome information modulates spatial representations is still unclear. Some studies have found that caudate neurons show a trade-off in their selectivity between actions and outcomes (Schmitzer-Torbert and Redish, 2004; Lau and Glimcher, 2007; Thorn et al., 2010). Others have found that individual neurons integrate reward information (i.e., small or large reward) with specific actions (Ding and Hikosaka, 2006; Stalnaker et al., 2010; Nakamura et al., 2012). Many of these studies have focused on describing position-specific reward mappings in binary action tasks, but did not address how the overall spatial representation of caudate neurons is modulated by the outcome information.
Our main goal was to describe whether and how reward variability or risk modulate spatial representation in the anterior caudate nucleus. Specifically, we investigated whether the prospect of a risky outcome enhanced or suppressed spatial representation at the level of single neurons and in neuronal populations. We recorded neural activity during a spatial delayed memory saccade task in which each position was associated with both safe and risky outcomes. To exclude any decision-related confounds, we evaluated the representation of these signals in the absence of choice. Although individual neurons multiplexed selectivity for either spatial location or risk, both signals were read out accurately based on their population activity. Moreover, the prospect of a risky outcome improved spatial representation in the caudate. Therefore, the current data provide evidence for the view that outcome and action signals are both present in individual caudate neurons, but can be separated through their population readout. A separable representation allows for general action-outcome mappings and may complement representations in which large or small rewards are associated with specific actions.
Materials and Methods
Surgical and recording procedures.
Two adult male rhesus monkeys (Macaca mulatta; Monkey C: 8.2 kg and Monkey F: 11.5 kg) were used in the experiments. All experimental procedures and treatments were in accordance with National Institutes of Health guidelines and were approved by the Institutional Animal Care and Use Committee at Columbia University and the New York State Psychiatric Institute. Before the experiments, each animal was implanted with a scleral search coil, head post, and recording chamber under aseptic conditions using isoflurane anesthesia. The animals received postoperative analgesics during postsurgical recovery. The positions of the recording chambers were guided by monkeys' individual MRI atlases. The recording chamber (20 mm in diameter) for Monkey C was placed on the skull over the arcuate sulcus positioned at stereotaxic coordinates 20 mm anterior and 15 mm lateral, allowing access to the anterior caudate nucleus via the frontal eye fields (FEFs). Monkey F was sequentially implanted with two different recording chambers. The first recording chamber (20 mm in diameter) was placed at 25 mm anterior and 18 mm lateral positioned over the acruate sulcus. The second recording chamber (20 × 30 mm) was placed at 15 mm anterior and 12 mm lateral. We used tungsten polymide or glass-coated electrodes with impedance ranging from 1–3.5 MΩ. The signals were amplified, filtered and passed to a real-time action potential time-amplitude discriminator (FHC). Action potentials were converted to digital pulses that were time stamped and stored with the behavioral data. We also stored individual waveforms on each channel for further offline analysis.
To identify the anterior caudate nucleus we used a number of criteria, we used depth measurements and identified the position of the caudate relative to the FEF. In addition, the dorsal edge of the caudate was identified by the presence of injury potentials. We identified putative projection neurons or phasically active neurons by their low spontaneous baseline activity (1–3 Hz) and a characteristic task-related activity in bursts of spikes. On each recording track, we made sure to identify a tonically active neuron (4–8 Hz); during some sessions, we simultaneously recorded a pair of tonically and phasically active neurons.
Behavioral task.
Monkeys were trained to sit in a primate chair for the duration of the experiments with their heads restrained. They performed behavioral experiments and received liquid reward for executing the behavioral task correctly. We trained two monkeys to perform a memory-guided saccade task with a variable outcome. Each trial started with the animal fixating a central fixation cue for 500 ms. The fixation cue was one of two colors, red or blue, indicating whether a safe or risky reward was available, respectively. Then, a white visual cue was presented for 300 ms in one of 8 spatial locations (0°, 45°, 90°, …, 360°). After a delay period of random variable length (750–1250 ms), the fixation cue disappeared, cuing the animal to make a saccade to the remembered location within 500 ms. Monkeys were required to fixate on the spatial location while the reward was collected. The trials were separated by a 2000 ms intertrial interval. On trials with safe outcome, monkeys received a fixed number of drops (2 or 3 drops of water, 0.1 ml each). On trials with risky outcome, monkeys received one of two sizes of reward, such that the average reward was the same between safe and risky trials. This was done to ensure that the animals received, on average, the same amount of reward for both safe and risky trials. Specifically, the most common reward combination (61% of sessions) was two drops of water as safe reward and one or three drops of water as risky rewards. The second reward combination (32% of sessions) was three drops of water as safe reward and two or four drops of water as risky rewards. Typically, animals performed the task with only one type of reward combination. However, occasionally (7% of sessions), monkeys performed the task with both reward combinations, which were introduced sequentially. For these multiprotocol sessions, we only analyzed trials with one type of reward combination, the one with the largest number of trials. The task had a block-randomized design. Each trial type (two outcomes × eight directions for a total of 16) was presented randomly during each block by randomly drawing one trial type from 16 trial types without replacement. In each block, animals had to complete each trial type to progress to the next block. We analyzed a total of 14,579 trials across 98 recording sessions. The monkeys performed, on average, similar numbers of trials with safe and risky outcome across all spatial locations (mean safe: 109 ± 6 trials; mean risky: 100 ± 5; paired t test, p = 0.22). They performed, on average, 14 ± 2 trials for each saccade direction across both outcomes during each recording session.
Behavioral and neuronal data analysis.
We measured the reaction time as the time from the end of the delay period to the time of the saccade onset. We determined the onset of saccades offline based on velocity (>30 deg/s) and acceleration (>500 deg/s2). We excluded all trials in which animals broke fixation any time during the trial. We identified all task related phasically active neurons by a bootstrap test (p < 0.05) comparing baseline firing rate during the initial fixation period (500 ms) with the average spike counts during each of 4 different task periods: cue (0–300 ms), delay (0 to <800 ms), saccade (200–400 ms), and reward (0–600 ms). A neuron was considered to be task responsive if there was a significant modulation of neural activity during any of the periods of the task relative to the baseline either on trials with safe, risky, or both outcomes. If a neuron was found to be task responsive in any period of the task, we then found an optimal response interval during this task period. We first computed mean spike count over 1 ms intervals [peristimulus time histogram (PSTH)] and then fitted a Gaussian function to the PSTH for trials at the neuron's preferred direction (i.e., the direction that evoked the maximum spike count). We defined the length of the optimal interval as twice the SD of the fitted Gaussian. We then defined the onset of this interval empirically with 1 ms resolution. For each time step, we calculated variance in spike counts within the interval across all trials and all conditions. We obtained the variance for direction tuning and outcome and then found the optimal window where the sum of the variances for direction and outcome was maximal. The same optimal interval was used for each neuron for all consequent analyses.
Single neuron metric.
We calculated an outcome selectivity index (OI) by taking the difference in spike count between safe and risky outcome trials normalized by their sum at each neuron's preferred direction. The index varied between −1 and 1, with positive values corresponding to a greater preference for safe compared with risky outcome. As a control, we also computed the OI on spike counts across trials for three directions (one preferred and two near preferred). The results were highly correlated (R2 = 0.95).
To quantify direction selectivity, we calculated the circular variance of spike counts across all directions separately for safe and risky outcome trials and then converted it into a direction selectivity index (DI) by subtracting from 1. Therefore, DI ranged between 0 and 1, with values closer to 1 indicating a greater direction selectivity.
Neuronal population metric.
We sought to determine how accurately the information about the type of outcome (safe/risky) and direction of action was represented in neural activity across anterior caudate neurons. We simultaneously inferred the outcome and direction from the observed population response during the cue/delay, saccade,and reward periods of the task. We computed the likelihood function that represents the conditional probability of observing a neural response given an outcome and saccade direction evaluated across all outcome types and saccade directions. We made two assumptions to estimate this likelihood function.
First, we assumed that neural responses were statistically independent. The log likelihood of the direction dj (j = 1:16, where j = 1:8 for directions with the safe outcome and j = 9:16 for directions with the risky outcome) for the population response ri was then written as follows:
where N is the total number of neurons.
Second, we assumed that the neural responses were described by Poisson statistics, yielding:
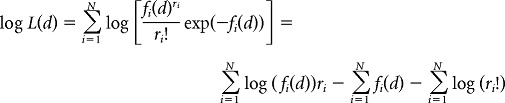 |
where fi(d) is the direction and outcome tuning of neuron i.
To avoid taking the log(0), we assumed that at least one spike was fired for a given condition. The estimate corresponding to the population activity was then the outcome and direction maximizing the log likelihood. This decoder has been widely used in previous studies (Jazayeri and Movshon, 2006; Graf et al., 2011).
We performed cross-validation by using a leave-one-out approach (Duda et al., 2001). We trained the decoder on one trial and tested the decoder on the remaining trials. We avoided overfitting the data because the estimates of accuracy were not obtained on the same trials on which the decoder was trained. The neurons were recorded across days and varied in the number of trials for each direction and reward outcome. To perform cross-validation, we used the same number of trials (n = 10) for each neuron in the population. If for a given direction there were more than n = 10 trials, we randomly selected n = 10 trials; otherwise, we reconstructed some of the trials (25% of trials for the safe outcome; 27% of trials for the risky outcome) for some neurons by adding firing rate drawn from a Poisson distribution with the mean equal to the empirical data mean (26% and 24% percent of neurons were reconstructed for safe and risky outcomes, respectively). To evaluate decoding accuracy (i.e., prediction accuracy, fraction of correct estimates) we randomly drew 1000 times without replacement and then averaged the decoding accuracy for either direction (eight dimensions) or outcome (two dimensions) separately. The data from the two monkeys were combined because they were qualitatively similar.
Results
Behavioral performance
We trained two monkeys to perform a memory-guided saccade task with either safe or risky outcome (Fig. 1A). On each trial, one of two colored fixation cues (red/blue) instructed the monkey about the upcoming reward outcome (safe p = 1.0; risky p = 0.5, respectively), which was delivered after a saccade to 1 of 8 spatial locations. The trials with different saccade directions and outcomes were interleaved in a semirandom block design (see Materials and Methods). The monkeys received, on average, an equal amount of reward on safe and risky trials for each direction (two-way ANOVA for reward outcome and direction, p = 0.36; Fig. 1B). They had very few fixation breaks for either type of trial and there was no difference in the proportion of fixation breaks on trials with different saccade directions or outcomes (mean safe: 1.7% and risky: 2.4%; two-way ANOVA (direction, outcome), p = 0.27). We found that reaction time of the animals' eye movement responses on trials with safe and risky outcomes collapsed across all spatial locations was not significantly different (safe: 267 ± 2 ms; risky: 271 ± 2 ms; paired t test, p = 0.06; Fig. 1C). There was a nonsignificant trend toward slower reaction times in response to risky compared with safe outcomes, possibly indicating an aversion to uncertainty, at least at the liquid reward volumes tested in this study. However, overall, monkeys' behavior tended to be similar between trials with two types of outcomes.
Figure 1.
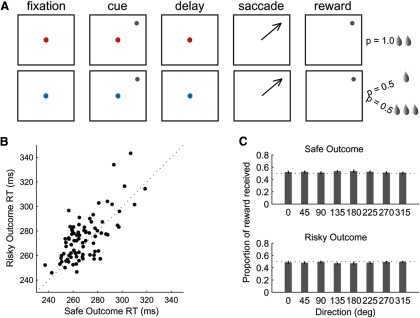
Schematic diagram of the task and behavioral performance. A, Delayed-memory saccade task with either safe (p = 1.0) or risky (p = 0.5) reward outcome. The type of outcome was instructed by the color of the fixation cue: red for safe and blue for risky outcomes. B, Reaction time of animals' eye movements on safe compared with risky trials (dashed is a unity line). C, Proportions and SEMs of reward received on all safe (top) and risky (bottom) outcome trials.
Neural activity: examples of anterior caudate neurons
We recorded the activity of 98 phasically active neurons (presumed projection neurons) in the anterior caudate nucleus in two monkeys (Monkey F: 69 and Monkey C: 29). The majority of these neurons (73/98, 75%) responded with an increase in the firing rate at least during one period of the task, including the cue, delay, saccade, and reward (bootstrap test, p < 0.05). Most neurons (58/73, 79%) had task-related activity during only one period of the task, with the rest (15/73, 21%) responding significantly during two or more periods of the task. We classified the 73 responsive neurons into three groups based on significant neuronal activity during one of the periods of the task: the cue/delay (25/73, 34%), saccade (31/73, 43%), and reward (25/73, 34%). The neuronal activity of these task-responsive neurons was modulated by direction (41 neurons), risk (8 neurons), or both (23 neurons) (two-way ANOVA for 2 outcomes × 8 directions, p < 0.01; Table 1). Figure 2, A–F, shows examples of typical neurons. The first two neurons (Fig. 2A,D) responded equally strongly on trials with safe (red) and risky (blue) reward outcome across all spatial locations during the saccade period of the task. We fit circular Gaussian functions to the average spike count at eight directions, separately for safe and risky trials (R2, 81% >0.7). The neuronal activity of these neurons shows sharp direction tuning for both types of reward outcome (Fig. 2A,D, small plots), but no differentiation between safe and risky trials. Therefore, the activity of these two neurons was modulated only by direction of saccade. The second type of neurons (Fig. 2B,E) were also tuned directionally for safe and risky outcome, but, in addition, these neurons responded with a preference for either safe (Fig. 2B) or risky (Fig. 2E) outcomes during the reward and saccade periods, respectively. These neurons were modulated by both direction and risk. Finally, the other neurons (Fig. 2C,F) also responded with a strong preference for either safe (Fig. 2C) or risky (Fig. 2F) outcomes during the reward period of the task, but were not tuned directionally. This last type of neuron was only modulated by the type of outcome. These different neurons illustrate the variety of modulation types during different periods of the task. A closer look at Table 1 shows that, whereas direction tended to modulate neuronal activity during early periods of the task, risk tended to modulate responses of caudate neurons later in the trial. To better understand the time course of these modulation effects during the trial, we performed a two-way ANOVA on a sliding window (window: 200 ms, step: 20 ms). Figure 3A illustrates the results. We found that the proportion of neurons modulated by direction increased rapidly during the cue and remained high during the delay and saccade, but then decreased during the reward period of the task. In contrast, the proportion of neurons modulated by risk was low during the cue and delay periods and then began to increase during the saccade and into the reward period of the task. These results show that direction and risk signals modulated the activity of neurons differently: neurons tended to represent direction of action early in the trial and outcome risk later in the trial. To further evaluate the representation of reward outcome and direction information during different periods of the task, we analyzed outcome and direction selectivity separately for the three groups of neurons: cue/delay, saccade, and reward. Due to the phasic response properties of these neurons, for each responsive cell, we identified a temporal interval (optimal interval, see Materials and Methods). Although the onset and duration of optimal intervals varied across the population of neurons, for each cell, we used the same interval for all analyses (Fig. 3B).
Table 1.
Number of significant responses to direction and risk across different task periods
| Task period | Cue | Delay | Saccade | Reward |
|---|---|---|---|---|
| Task responsive | 13 | 12 | 31 | 25 |
| Task selective | 11 | 10 | 28 | 23 |
| Direction | 9 | 9 | 17 | 6 |
| Risk | 1 | 0 | 2 | 5 |
| Both | 1 | 1 | 9 | 12 |
Figure 2.

A–F, Examples of single anterior caudate nucleus neurons with different selectivity to direction and risk. A, D, Neurons with strong direction selectivity during the saccade period of the task. B, E, Neurons with both direction and risk selectivity during the reward (B) and saccade (E) periods of the task. C, F, Neurons with only risk selectivity during the reward period of the task.
Figure 3.

Direction and risk tuning in the neuronal population. A, Proportion of significantly tuned neurons in a sliding window (width: 200 ms, step: 20 ms). Neuronal activity was aligned to different events within the trial (cue, delay, saccade, and reward onsets). B,Distribution of the temporal intervals for each neuron aligned to different task events.
Selectivity to outcome risk
We first investigated whether the neuronal activity of anterior caudate neurons differentiated between safe and risky outcome trials. For each neuron, we found a spatial location/saccade direction that elicited the maximum neuronal response (i.e., preferred direction) for either safe or risky trials and then computed an OI (see Materials and Methods). This index varies between −1 and 1, with positive values indicating a greater response to safe than risky outcomes. During all periods, on average, neurons were equally likely to have either positive or negative OIs (“safe-preferring” and “risky-preferring,” respectively) because none of the distributions was significantly shifted from zero (one-sample t test, cue/del mean OI: 0.06, p = 0.37; saccade mean OI: 0.02, p = 0.4; reward mean OI: 0.21, p = 0.6; Fig. 4A–C). We then used the sign of the OI to sort neurons during each of the three periods of the task into safe-preferring and risk-preferring groups. Figure 5, A–F, shows the average tuning curves of each group to safe and risky outcomes separately during each period of the task. Although the direction tuning remained strong during all periods of the task, the strongest modulation by reward outcome occurred during the reward delivery, which is consistent with the time course modulation results (Fig. 3A).
Figure 4.

A–C, Distributions of the outcome selectivity index for neurons with activity during the cue/delay (n = 25), saccade (n = 31), and reward (n = 25) periods of the task, respectively (bin size = 0.25). The median (▾) OI value and the position of the OI of zero (dotted line) are shown for each distribution.
Figure 5.
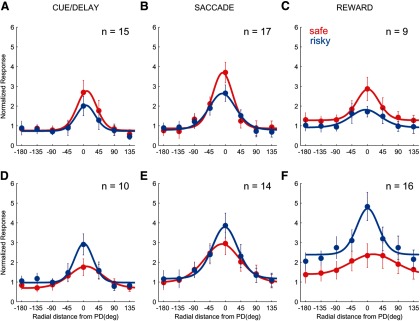
Average tuning curves (mean and SEMs) for safe and risky outcomes for safe-preferring (A–C) and risk-preferring (D–F) neurons during different periods of the task.
We next examined whether there were differences across task periods in the neurons' preferred directions between trials with safe and risky outcome. We quantified the difference in preferred directions by computing the circular mean for safe and risky trials and then taking the difference between the two (Δdir). We found that there were small, not significant, differences in the average magnitude of the difference between neurons' preferred directions for safe and risky trials among the cue/delay (mean Δdir: 24 ± 6°), saccade (mean Δdir: 26 ± 6°), and reward periods of the task (mean Δdir: 41 ± 9°, bootstrap test, p = 0.11). These subtle differences in the average Δdir occurred either through clockwise or counterclockwise shift relative to the preferred direction with maximum neuronal response during any periods of the task.
Previous studies have also shown that neurons in the caudate differentially represent reward magnitudes (Cromwell and Schultz, 2003; Nakamura et al., 2012). To investigate whether neurons responding during the reward period of the task encoded the magnitude of reward, we performed a two-way ANOVA (3 reward sizes × 8 directions, p < 0.01). We found that 10 of 25 neurons had significant effect of direction and reward size. To determine whether these neurons respond to reward size in a linear manner, we fitted a linear regression model to spike counts across three reward sizes (low risky, intermediate safe, and high risky) for each neuron. We found that a small subset of neurons (5/25, 20%) encoded reward size in a linear manner (data not shown, linear regression, p < 0.05), suggesting that these neurons encode the magnitude of reward.
Selectivity for saccade direction
We next studied the direction selectivity of anterior caudate neurons. First, we determined whether neurons had differences in direction selectivity on trials with safe and risky outcomes. We calculated a direction selectivity index separately for trials with safe and risky outcomes for the cue/delay, saccade and reward periods of the task. For each neuron, we calculated a circular variance separately for safe and risky trials and converted it into the direction selectivity index (DI) (Lau and Glimcher, 2007). The DI varied from 0 (no tuning) to 1 (sharp tuning). Figure 6, A–C, shows the DIs between safe and risky outcome trials for each period of the task. We noticed that, in all three plots, the points tended to scatter around the equality line (diagonal line), suggesting that there were differences in the DIs between safe/risky outcome trials. To quantify these differences, we calculated an additional index, a direction ratio index (RIdir), which indicated how well individual neurons differentiated direction selectivity between safe and risky outcomes. We computed the unsigned RIdir by taking the absolute difference between the safe and risky direction selectivity indexes normalized by their sum for each period of the task (RIdir varied from 0 to 1, with 1 indicating maximum differentiation between safe and risky). We reasoned that significant differences in the direction selectivity between safe and risky outcomes would result in a distribution of RIdir shifted away from zero, whereas no differences would result in a distribution of RIdir that peaked at zero and showed a rapid decay away from it. We found that the means of the distributions of RIdir indexes during all periods of the task were shifted away from zero (insert plots; mean ± SEM RIdir: cue/delay: 0.2 ± 0.03, saccade: 0.13 ± 0.02, p = 0.06; reward: 0.28 ± 0.03; Fig. 6A–C). These results show that there were significant changes in the direction selectivity of anterior caudate neurons between safe and risky outcome trials.
Figure 6.

Direction selectivity indexes. A–C, Scatter plots of direction selectivity indexes for safe (x-axis) and risky (y-axis) outcomes for neurons with the neural activity during the cue/delay, saccade and reward periods of the task, respectively. Inset, Distributions of the absolute RI values for neurons with responses during each period of the task. Means of the distributions are shown by gray dotted lines.
Comparison of reward outcome and direction selectivity
The above results show that there are different trends in outcome and direction selectivity before and during reward delivery. It raises the question of whether there is a trade-off between outcome and direction selectivity at the level of single neurons, similar to sensorimotor caudate (Lau and Glimcher, 2007). We compared the outcome index and the direction selectivity index across all periods of the task. For each neuron, we took either safe or risky direction selectivity depending on which condition evoked the maximum response. We found that neuronal activity during the cue/delay and saccade periods had significantly stronger selectivity for the spatial location/saccade direction compared with the outcome selectivity (Wilcoxon rank-sum test, p < 0.01 and p < 0.01, respectively; Fig. 7A,B). In contrast, neural activity during the reward period of the task had the greater selectivity to the outcome compared with the direction selectivity (Wilcoxon rank-sum test, p < 0.001; Fig. 7C). We obtained similar results when we compared the outcome selectivity with direction selectivity separately for safe and risky trials.
Figure 7.

Comparison between the absolute outcome and average direction selectivity indexes for neurons with activity during the cue/delay (A), saccade (B), and reward (C) periods of the task. p-values show significance level for Wilcoxon rank-sum test.
The selectivity of these neurons tends to be greater for the most pertinent information currently available to these neurons. Therefore, before reward delivery, anterior caudate neurons have greater selectivity for direction information, whereas during the reward delivery, they show greater selectivity for outcome compared with the direction of the preceding saccade. A caveat is that one might argue that the spatial tuning is an eye position signal rather than a movement signal because it happens after the saccade. We analyzed the saccade neurons with significant presaccade and postsaccade neural activity (12 of 31 neurons, bootstrap test, p < 0.05). We found a strong correlation between the preferred directions for the presaccade and postsaccade neural activity (R2 = 0.84, p < 0.002). These results suggest that caudate neurons coded a saccade direction signal, not an eye-position signal, because their direction tuning was not modified by the change in eye position.
Population coding of outcome risk and direction
We next investigated whether the joint representation of action and outcome at the level of single neurons provided sufficient information for decoding both signals from the population response. We predicted for each trial the direction of action and outcome (for a total of 16 conditions = 8 × 2) based on the neuronal activity of populations of independently recorded neurons (see Materials and Methods). To evaluate the prediction accuracy, we used proportion of correct estimates for either direction or outcome. We found that the population activity provided a reliable readout of both directions and outcomes with above chance accuracy during all periods of the task (Fig. 8A–C). The average proportion of correct estimates for direction (black bars) for each (0–315°) and averaged across all directions, for both safe and risky outcome, was significantly above chance (0.125) for populations with activity during the cue/delay, saccade, and reward periods, respectively, at 0.58 ± 0.07, 0.86 ± 0.07, and 0.41 ± 0.07 (Fig. 8A–C, left column). The prediction accuracy for the outcome (gray bars) was also significantly above chance (0.5; safe: 0.59 ± 0.04, 0.79 ± 0.4, and 0.71 ± 0.04; risky: 0.69 ± 0.04, 0.86 ± 0.4, and 0.86 ± 0.4, respectively, for three neuronal populations; Fig. 8A–C, right column).
Figure 8.

Prediction of direction and outcome. Shown are the proportions of correct estimates and error bars (SEs) for direction only (left column, black bars), outcome only (right column, gray bars) for the cue/delay (A), saccade (B), and reward (C) neuronal populations. Chance levels (dashed lines) are 0.125 and 0.5 for direction and outcome predictions, respectively.
We further evaluated the prediction accuracy for spatial and outcome representation for each neuronal population without comparing across them due to different sampling in each population. We noticed that the prediction accuracy for outcome (Fig. 8A–C, right column) was significantly higher for risky compared with safe trials based on population activity during the cue/delay, saccade, and reward periods, respectively (risky vs safe: p < 0.002, p < 0.001, and p < 0.01, respectively, one-way ANOVA). Consistently, the average prediction accuracy for direction was also significantly higher for risky compared with safe trials for each population, respectively (Dirrisky vs Dirsafe: p < 0.001, p < 0.008, and p < 0.001, respectively, one-way ANOVA). This was also true when we compared errors in direction prediction showing deviation in degrees from the true direction. The errors in direction predictions, averaged across all directions, were significantly smaller, with risky compared with safe outcome for three populations, respectively (17 ± 2° vs 23 ± 3°, p < 0.0001; 24 ± 2° vs 27 ± 2°, p < 0.05; 46 ± 3° vs 52 ± 2°, p < 0.001; paired t test). The better prediction of reward and spatial representation with risky outcome may be due to its greater salience, which is known to modulate caudate activity (Asaad and Eskandar, 2011), compared with safe, less salient, outcome.
To better understand any possible differences in the prediction accuracy for risky compared with safe outcomes, we further evaluated the decoding performance by classifying each estimate on a given trial depending on whether the decoder jointly predicted the direction and outcome correctly or not. This would give us an insight into whether the neuronal population activity provided a reliable representation of action direction under both safe and risky conditions or only under the more salient risky cue. Therefore, each estimate was classified as one of four: a correct or one of three types of errors (Fig. 9). The correct estimate (purple) occurred when both the direction and outcome were identified correctly. The error occurred when the decoder misidentified the direction, misclassified the outcome, or both. We defined three types of these errors: type I (blue) when only the direction was misidentified, type II (orange) when only the outcome was misclassified, and type III (brown) when both the direction and the outcome were misclassified (Fig. 9). Figure 9, A–C, summarizes the proportion of estimates for safe (bright colors) and risky (pale colors) trials sorted by the direction (left column) and by the estimate type (right column) for each neuronal population. Within each population, we found no differences between safe and risky trials in the frequency of each estimate type (Fischer probability test, p = 0.7, p = 0.1, and p = 0.4, for each population, respectively; Fig. 9A–C, right column). Therefore, qualitatively, the types of estimates (correct or errors) produced by the decoder were similar between safe and risky trials in each neuronal population. The higher prediction accuracy for risky compared with safe outcome (Fig. 8A–C) was not explained by the ability of the decoder to extract more or less direction information.
Figure 9.

Comparison of decoding performance (types of estimates) for direction prediction with safe (bright colors) and risky (pale colors) rewards for the cue/delay (A), saccade (B), and reward (C) neuronal populations. There were four types of estimates, one correct (purple) and three errors (blue, yellow, brown), shown in the diagram. Left, Types of estimates for each direction prediction with safe and risky outcome for each neural population. Right, Proportions of different estimates and error bars across all directions separated into safe (bright colors) and risky (pale colors) outcome groups.
We also evaluated the prediction accuracy for the direction and outcome as a function of the number of neurons. We obtained the average prediction accuracy (either across directions or across outcomes) for populations of different sizes (i.e., number of neurons) by randomly drawing without replacement separately from pools of neurons comprising each neuronal population with activity during different periods of the task. We extended each neuronal population to obtain predictions on a hypothetical population of neurons with the similar distribution of all possible selectivity combinations for the direction and outcome. We then scaled the average prediction accuracy by , where σ̂ is the average prediction accuracy and chance level is 0.125 or 0.5 for the direction or outcome, respectively. Figure 10, A–C, summarizes the results by showing the trends in the decoding accuracy as a function of population size. The prediction accuracy increases for population sizes <100, suggesting a distributed code, as opposed to a sparse code with few highly selective neurons. Notably, the code was selectively distributed such that the most behaviorally relevant variable for each population (i.e., direction in Fig. 10A,B, black curve, and outcome in Fig. 10C, gray curve) was coded in a less distributed, more sparse manner (curve is above) compared with the other variable (i.e., outcome in Fig. 10A,B, gray curve, and direction in Fig. 10C, black curve). The selectively distributed code may result from neurons with mixed selectivity to multiple variables.
Figure 10.

Prediction accuracy for direction (black) and outcome (gray) as a function of population size (log scale) for cue/delay (A), saccade (B), and reward (C) neural populations.
Contribution of individual neurons to the population code
To better understand the nature of the distributed code, we examined the contribution of individual neurons to the prediction accuracy for direction and outcome. To use both the direction and outcome selectivity for each neuron, we calculated a difference index (RIdiff) by taking the difference between outcome and direction selectivity normalized by their sum (RIdiff varied between −1 and 1). We ranked neurons based on their RIdiff score (values <0 indicated stronger direction selectivity and values >0 indicated neurons with stronger outcome selectivity). We then calculated a change in prediction accuracy (i.e., decoding contribution, percent correct) when a given neuron was added to a small subset of neurons (n = 4), repeated 100 times, each time with a new set of randomly selected neurons from each extended population in Figure 10, A–C. Figure 11 illustrates the results. We confirmed the previous results for the distributed code (Fig. 10), but also found that many neurons showed a trade-off in their contributions to the prediction of direction and outcome, which were consistent with their selectivity to each. This trend was particularly strong during the saccade period of the task (Fig. 11C,D). Most cells made a small, positive contribution to the decoding accuracy of both the direction (positive contribution: 28/31, 90%; mean ± SEM: 0.05 ± 0.006; Fig. 11C) and outcome (positive contribution: 22/25, 88%; mean ± SEM: 0.03 ± 0.007; Fig. 11D). The contribution was significantly greater to the direction prediction accuracy compared with the outcome (paired t test, p < 0.0001). Moreover, there were significant correlations of different signs between neurons' ranked RIdiff scores and decoding contribution to direction (R2 = 0.34, p < 0.001) and outcome (R2 = 0.13, p < 0.04). Neurons with the stronger selectivity to direction compared with outcome (RIdiff <0) tended to make greater positive contribution to the direction prediction, but smaller, sometimes even negative, contributions to the outcome prediction. The other periods of the task, the cue/delay (Fig. 11A,B) and reward (Fig. 11E,F), yielded similar but qualitatively weaker results. Although there was a significant negative correlation between RIdiff scores and neurons' contribution to the direction prediction for both the cue/delay (R2 = 0.45, p < 0.0001; Fig. 11A) and reward (R2 = 0.35, p < 0.002; Fig. 11E) populations, their contribution to the outcome prediction was not dependent on their selectivity (R2 = 0.06, p = 0.23, Fig. 11B; R2 = 0.03, p = 0.4, Fig. 11F, respectively). The average contribution to the direction compared with the outcome prediction was significantly greater in the cue/delay population (paired t test, p < 0.003), but not the reward population (paired t test, p = 0.43). Therefore, anterior caudate neurons tended to make greater contributions to the direction coding compared with the expected outcome before reward delivery, but they contributed similarly to the direction and outcome representation when the outcome was revealed.
Figure 11.

Contribution of individual neurons to direction (A, C, E; black) and outcome (B, D, F; gray) prediction accuracy for each neuronal population. Neurons were sorted based on the RIdiff values, with positive values indicating greater selectivity to the outcome than direction. Decoding contribution of each neuron was calculated by measuring any difference in the decoding accuracy based on the neuronal activity of a small group of neurons (n = 4). Error bars indicate SEMs and lines represent regression slopes. R2 values show relationship between neuron's relative selectivity to direction and outcome (RIdiff) and contribution to prediction accuracy for either direction or outcome.
Discussion
The results of this study show that outcome risk and spatial signals were jointly represented in the anterior caudate nucleus, at both the level of single neurons and their population activity. Risk and spatial signals were present in the same neurons even though risk was not linked to a particular visual location or movement direction. Although individual neurons showed a trade-off in their selectivity to outcome risk and direction of action, the population response provided a reliable representation of both variables on a trial-by-trial basis. Moreover, the neuronal population read out of the spatial information was more accurate when the reward outcome was risky. These findings suggest that the anterior caudate nucleus jointly represents both spatial and reward risk information, but that these signals can be separated by a population readout. A separable code represents all combinations of location and reward risk and is therefore more flexible than the nonseparable association between reward magnitude and specific movement directions proposed by others (Hikosaka et al., 2000; Yin et al., 2005; Graybiel, 2008; Balleine and O'Doherty, 2010).
Signals related to outcome uncertainty have been found in a wide network of brain areas, including the orbitofrontal cortex (Critchley et al., 2001; Tobler et al., 2007; Kepecs et al., 2008; O'Neill and Schultz, 2010), cingulate cortex (Critchley et al., 2001; McCoy and Platt, 2005), midbrain (Fiorillo, 2011), and hippocampus (Vanni-Mercier et al., 2009). The outcome risk signals in the anterior caudate can potentially derive from some of these inputs, most likely from the orbitofrontal and cingulate cortex (Yeterian and Van Hoesen, 1978; Calzavara et al., 2007; Haber and Calzavara, 2009). Orbitofrontal neurons code the risk (or uncertainty) of reward (O'Neill and Schultz, 2010) and decision uncertainty (Kepecs et al., 2008), but these signals tend to be independent of actions. Conversely, posterior cingulate neurons provide information about the risk associated with specific actions (McCoy and Platt, 2005). Therefore, it is very likely that the outcome risk signals in the anterior caudate reflect the incoming cortical inputs. Future studies are needed to compare and contrast these multi-areal signals.
Our findings that the spatial representation was more reliable with risky compared with safe outcome suggest that the greater salience of variable outcome can possibly account for the better spatial selectivity. Salience-related signals have also been reported in the caudate nucleus (Asaad and Eskandar, 2011). These results are intriguing given the known role of the anterior caudate in associative learning (Williams and Eskandar, 2006; Kimchi and Laubach, 2009b). Typically, reward outcome is variable during learning and the greater salience of the variable outcome can possibly account for better spatial selectivity of the neurons, thus contributing to learning. Notably, better spatial representation with risky outcome was revealed with the population-level analysis, not by averaging spatial selectivity across individual neurons (Fig. 3). Therefore, even small differences at the level of single neurons could result in reliable readout across their population. Given a variety of decision and learning signals in the caudate nucleus (Williams and Eskandar, 2006; Ding and Gold, 2010), it will be of interest to study how variability in outcome modulates spatial selectivity, particularly at the population level.
Our findings are consistent with the growing evidence for the strong contribution of the anterior caudate to postaction evaluation (Lau and Glimcher, 2007; Ding and Gold, 2010; Stalnaker et al., 2010; Thorn et al., 2010; Kim et al., 2013). In our study, we chose an optimal interval for data analysis by finding a temporal interval that carried maximal information for both the spatial and nonspatial signals. Many of these intervals happened to be in the postaction period (Fig. 3B), mostly right after the action, with relatively few neurons responding later during the reward delivery. Previous studies found that postaction signals in the caudate were not maintained by single neurons; instead, each neuron responded only in a given window and the signals were sustained by a sequential activation across the population of cells (Kim et al., 2013). Here, we show that the population of such sequentially activated neurons can reliably code multiple parameters. The postdecision activity is related to memory traces for specific actions linking them to outcomes (Lau and Glimcher, 2007; Curtis and Lee, 2010; Kim et al., 2013). Such signals can potentially influence subsequent behavior by providing selective and dynamic updating in contrast to a more global updating through a reward prediction error.
We were able to predict reliably and simultaneously the spatial and nonspatial outcome signals from populations of broadly tuned neurons. Our findings of the distributed code appear in contrast with single-unit findings suggesting a sparser coding of mixed selectivity in the striatum (Schmitzer-Torbert and Redish, 2004; Lau and Glimcher, 2007; Thorn et al., 2010). Sparse coding at the level of single neurons is not necessarily advantageous for population coding, because downstream areas need to sample many sparsely or selectively responding neurons. Conversely, distributed coding is more robust and may even be more informative (Kim et al., 2012). Many broadly tuned neurons respond at any given time, so such a population is not affected strongly by the loss of cells or the presence of neural noise (Eurich and Wilke, 2000; Sanger, 2003). Our results are consistent with previous findings showing that reward information is coded in a redundant manner in the orbitofrontal cortex, with many cells making small contributions to the population code (van Duuren et al., 2007; van Duuren et al., 2009). Future studies need to address the nature of the population code for multiple task-related variables.
Footnotes
This work was supported by The Patterson Trust Fellowship in Brain Circuitry (M.Y.), a National Alliance for Research on Schizophrenia and Depression Young Investigator Award (M.Y.), the National Institute on Mental Health–National Institutes of Health (Grant NIMH-MH059244 to V.P.F.), and the National Institutes of Health (Grant P50MH094258A to M.Y. and Richard Andersen). We thank Arnulf Graf for valuable comments and discussions, Svetlana Rosis for helpful comments on this manuscript, and Richard Andersen for support.
The authors declare no competing financial interests.
References
- Asaad WF, Eskandar EN. Encoding of both positive and negative reward prediction errors by neurons of the primate lateral prefrontal cortex and caudate nucleus. J Neurosci. 2011;31:17772–17787. doi: 10.1523/JNEUROSCI.3793-11.2011. [DOI] [PMC free article] [PubMed] [Google Scholar]
- Balleine BW, O'Doherty JP. Human and rodent homologies in action control: corticostriatal determinants of goal-directed and habitual action. Neuropsychopharmacology. 2010;35:48–69. doi: 10.1038/npp.2009.131. [DOI] [PMC free article] [PubMed] [Google Scholar]
- Calzavara R, Mailly P, Haber SN. Relationship between the corticostriatal terminals from areas 9 and 46, and those from area 8A, dorsal and rostral premotor cortex and area 24c: an anatomical substrate for cognition to action. Eur J Neurosci. 2007;26:2005–2024. doi: 10.1111/j.1460-9568.2007.05825.x. [DOI] [PMC free article] [PubMed] [Google Scholar]
- Critchley HD, Mathias CJ, Dolan RJ. Neural activity in the human brain relating to uncertainty and arousal during anticipation. Neuron. 2001;29:537–545. doi: 10.1016/S0896-6273(01)00225-2. [DOI] [PubMed] [Google Scholar]
- Cromwell HC, Schultz W. Effects of expectations for different reward magnitudes on neuronal activity in primate striatum. J Neurophysiol. 2003;89:2823–2838. doi: 10.1152/jn.01014.2002. [DOI] [PubMed] [Google Scholar]
- Curtis CE, Lee D. Beyond working memory: the role of persistent activity in decision making. Trends Cogn Sci. 2010;14:216–222. doi: 10.1016/j.tics.2010.03.006. [DOI] [PMC free article] [PubMed] [Google Scholar]
- Ding L, Gold JI. Caudate encodes multiple computations for perceptual decisions. J Neurosci. 2010;30:15747–15759. doi: 10.1523/JNEUROSCI.2894-10.2010. [DOI] [PMC free article] [PubMed] [Google Scholar]
- Ding L, Hikosaka O. Comparison of reward modulation in the frontal eye field and caudate of the macaque. J Neurosci. 2006;26:6695–6703. doi: 10.1523/JNEUROSCI.0836-06.2006. [DOI] [PMC free article] [PubMed] [Google Scholar]
- Duda RO, Hart PE, Stork DG. Pattern classification. Ed 2. New York: Wiley; 2001. [Google Scholar]
- Eurich CW, Wilke SD. Multidimensional encoding strategy of spiking neurons. Neural Comput. 2000;12:1519–1529. doi: 10.1162/089976600300015240. [DOI] [PubMed] [Google Scholar]
- Fiorillo CD. Transient activation of midbrain dopamine neurons by reward risk. Neuroscience. 2011;197:162–171. doi: 10.1016/j.neuroscience.2011.09.037. [DOI] [PMC free article] [PubMed] [Google Scholar]
- Graf AB, Kohn A, Jazayeri M, Movshon JA. Decoding the activity of neuronal populations in macaque primary visual cortex. Nat Neurosci. 2011;14:239–245. doi: 10.1038/nn.2733. [DOI] [PMC free article] [PubMed] [Google Scholar]
- Graybiel AM. Habits, rituals, and the evaluative brain. Annu Rev Neurosci. 2008;31:359–387. doi: 10.1146/annurev.neuro.29.051605.112851. [DOI] [PubMed] [Google Scholar]
- Haber SN, Calzavara R. The cortico-basal ganglia integrative network: the role of the thalamus. Brain Res Bull. 2009;78:69–74. doi: 10.1016/j.brainresbull.2008.09.013. [DOI] [PMC free article] [PubMed] [Google Scholar]
- Hassani OK, Cromwell HC, Schultz W. Influence of expectation of different rewards on behavior-related neuronal activity in the striatum. J Neurophysiol. 2001;85:2477–2489. doi: 10.1152/jn.2001.85.6.2477. [DOI] [PubMed] [Google Scholar]
- Hikosaka O, Takikawa Y, Kawagoe R. Role of the basal ganglia in the control of purposive saccadic eye movements. Physiol Rev. 2000;80:953–978. doi: 10.1152/physrev.2000.80.3.953. [DOI] [PubMed] [Google Scholar]
- Hollerman JR, Tremblay L, Schultz W. Influence of reward expectation on behavior-related neuronal activity in primate striatum. J Neurophysiol. 1998;80:947–963. doi: 10.1152/jn.1998.80.2.947. [DOI] [PubMed] [Google Scholar]
- Jazayeri M, Movshon JA. Optimal representation of sensory information by neural populations. Nat Neurosci. 2006;9:690–696. doi: 10.1038/nn1691. [DOI] [PubMed] [Google Scholar]
- Kepecs A, Uchida N, Zariwala HA, Mainen ZF. Neural correlates, computation and behavioural impact of decision confidence. Nature. 2008;455:227–231. doi: 10.1038/nature07200. [DOI] [PubMed] [Google Scholar]
- Kim H, Lee D, Jung MW. Signals for previous goal choice persist in the dorsomedial, but not dorsolateral striatum of rats. J Neurosci. 2013;33:52–63. doi: 10.1523/JNEUROSCI.2422-12.2013. [DOI] [PMC free article] [PubMed] [Google Scholar]
- Kim SM, Ganguli S, Frank LM. Spatial information outflow from the hippocampal circuit: distributed spatial coding and phase precession in the subiculum. J Neurosci. 2012;32:11539–11558. doi: 10.1523/JNEUROSCI.5942-11.2012. [DOI] [PMC free article] [PubMed] [Google Scholar]
- Kimchi EY, Laubach M. The dorsomedial striatum reflects response bias during learning. J Neurosci. 2009a;29:14891–14902. doi: 10.1523/JNEUROSCI.4060-09.2009. [DOI] [PMC free article] [PubMed] [Google Scholar]
- Kimchi EY, Laubach M. Dynamic encoding of action selection by the medial striatum. J Neurosci. 2009b;29:3148–3159. doi: 10.1523/JNEUROSCI.5206-08.2009. [DOI] [PMC free article] [PubMed] [Google Scholar]
- Kuhnen CM, Knutson B. The neural basis of financial risk taking. Neuron. 2005;47:763–770. doi: 10.1016/j.neuron.2005.08.008. [DOI] [PubMed] [Google Scholar]
- Lau B, Glimcher PW. Action and outcome encoding in the primate caudate nucleus. J Neurosci. 2007;27:14502–14514. doi: 10.1523/JNEUROSCI.3060-07.2007. [DOI] [PMC free article] [PubMed] [Google Scholar]
- McCoy AN, Platt ML. Risk-sensitive neurons in macaque posterior cingulate cortex. Nat Neurosci. 2005;8:1220–1227. doi: 10.1038/nn1523. [DOI] [PubMed] [Google Scholar]
- Nakamura K, Santos GS, Matsuzaki R, Nakahara H. Differential reward coding in the subdivisions of the primate caudate during an oculomotor task. J Neurosci. 2012;32:15963–15982. doi: 10.1523/JNEUROSCI.1518-12.2012. [DOI] [PMC free article] [PubMed] [Google Scholar]
- O'Neill M, Schultz W. Coding of reward risk by orbitofrontal neurons is mostly distinct from coding of reward value. Neuron. 2010;68:789–800. doi: 10.1016/j.neuron.2010.09.031. [DOI] [PubMed] [Google Scholar]
- Pasupathy A, Miller EK. Different time courses of learning-related activity in the prefrontal cortex and striatum. Nature. 2005;433:873–876. doi: 10.1038/nature03287. [DOI] [PubMed] [Google Scholar]
- Sanger TD. Neural population codes. Curr Opin Neurobiol. 2003;13:238–249. doi: 10.1016/S0959-4388(03)00034-5. [DOI] [PubMed] [Google Scholar]
- Schmitzer-Torbert N, Redish AD. Neuronal activity in the rodent dorsal striatum in sequential navigation: separation of spatial and reward responses on the multiple T task. J Neurophysiol. 2004;91:2259–2272. doi: 10.1152/jn.00687.2003. [DOI] [PubMed] [Google Scholar]
- Stalnaker TA, Calhoon GG, Ogawa M, Roesch MR, Schoenbaum G. Neural correlates of stimulus-response and response-outcome associations in dorsolateral versus dorsomedial striatum. Front Integr Neurosci. 2010;4:12. doi: 10.3389/fnint.2010.00012. [DOI] [PMC free article] [PubMed] [Google Scholar]
- Thorn CA, Atallah H, Howe M, Graybiel AM. Differential dynamics of activity changes in dorsolateral and dorsomedial striatal loops during learning. Neuron. 2010;66:781–795. doi: 10.1016/j.neuron.2010.04.036. [DOI] [PMC free article] [PubMed] [Google Scholar]
- Tobler PN, O'Doherty JP, Dolan RJ, Schultz W. Reward value coding distinct from risk attitude-related uncertainty coding in human reward systems. J Neurophysiol. 2007;97:1621–1632. doi: 10.1152/jn.00745.2006. [DOI] [PMC free article] [PubMed] [Google Scholar]
- van Duuren E, Escámez FA, Joosten RN, Visser R, Mulder AB, Pennartz CM. Neural coding of reward magnitude in the orbitofrontal cortex of the rat during a five-odor olfactory discrimination task. Learn Mem. 2007;14:446–456. doi: 10.1101/lm.546207. [DOI] [PMC free article] [PubMed] [Google Scholar]
- van Duuren E, van der Plasse G, Lankelma J, Joosten RN, Feenstra MG, Pennartz CM. Single-cell and population coding of expected reward probability in the orbitofrontal cortex of the rat. J Neurosci. 2009;29:8965–8976. doi: 10.1523/JNEUROSCI.0005-09.2009. [DOI] [PMC free article] [PubMed] [Google Scholar]
- Vanni-Mercier G, Mauguière F, Isnard J, Dreher JC. The hippocampus codes the uncertainty of cue-outcome associations: an intracranial electrophysiological study in humans. J Neurosci. 2009;29:5287–5294. doi: 10.1523/JNEUROSCI.5298-08.2009. [DOI] [PMC free article] [PubMed] [Google Scholar]
- Volkow ND, Li TK. Drug addiction: the neurobiology of behaviour gone awry. Nat Rev Neurosci. 2004;5:963–970. doi: 10.1038/nrn1539. [DOI] [PubMed] [Google Scholar]
- Williams ZM, Eskandar EN. Selective enhancement of associative learning by microstimulation of the anterior caudate. Nat Neurosci. 2006;9:562–568. doi: 10.1038/nn1662. [DOI] [PubMed] [Google Scholar]
- Yeterian EH, Van Hoesen GW. Cortico-striate projections in the rhesus monkey: the organization of certain cortico-caudate connections. Brain Res. 1978;139:43–63. doi: 10.1016/0006-8993(78)90059-8. [DOI] [PubMed] [Google Scholar]
- Yin HH, Ostlund SB, Knowlton BJ, Balleine BW. The role of the dorsomedial striatum in instrumental conditioning. Eur J Neurosci. 2005;22:513–523. doi: 10.1111/j.1460-9568.2005.04218.x. [DOI] [PubMed] [Google Scholar]