Abstract
Almost half of prescription medications are metabolized by cytochrome P450 3A4 and 3A5. CYP3A4 and 3A5 have significant substrate overlap, and there is currently no way to selectively monitor the activity of these two enzymes, which has led to the erroneous habit of attributing the cumulative activity to CYP3A4. While CYP3A4 expression is ubiquitous, CYP3A5 expression is polymorphic, with large individual differences in CYP3A5 expression level. The CYP3A5 genotype has been shown to alter the pharmacokinetics of drugs in clinical trials. We report the first tool compound capable of determining CYP3A5 activity in biologic samples containing both enzymes. Oxidation of T-5 by CYP3A5 yields an N-oxide metabolite that is over 100-fold selective over CYP3A4. Formation of T-5 N-oxide highly correlates with the CYP3A5 genotype and CYP3A5 expression levels in human liver microsomes and human hepatocytes.
Introduction
Selective cytochrome P450 substrates are used in pharmaceutic research to determine the likelihood that a candidate compound would be involved in pharmacokinetic drug-drug interactions. Quality selective substrates exist for all the major drug-metabolizing P450s except CYP3A4 and CYP3A5 (Yuan et al., 2002). This is ironic because these enzymes are involved in the metabolism of more drugs than any other P450 enzyme (Wilkinson, 1996; Thummel and Wilkinson, 1998; Bu, 2006; Niwa et al., 2008). The frequently used CYP3A substrates include testosterone, midazolam, nifedipine, and erythromycin. Because those substrates are metabolized by both CYP3A enzymes, they do not allow researchers to determine whether a tested compound preferentially inhibits CYP3A4 or CYP3A5.
There exists considerable overlap in substrate specificity between CYP3A4 and CYP3A5, (Liu et al., 2007) resulting in the inability to differentiate their activity or inhibition in biologically relevant samples. The substrate promiscuity of has made the identification of a specific substrate for CYP3A5 a challenge (Yuan et al., 2002). A selective readout of CYP3A5 activity will refine current models for pharmacokinetic drug-drug interactions where the catalytic efficiency of CYP3A4 and CYP3A5 can be accounted for and the importance of genetic polymorphisms can be predicted.
Four members of the CYP3A family have been identified in humans: CYP3A4, CYP3A5, CYP3A7, and CYP3A43 (Daly, 2006). CYP3A7 is predominantly a fetal form and decreases rapidly after birth, and CYP3A43 is expressed at very low levels (Daly, 2006). Neither is considered to play a significant drug metabolism role in children or adults. CYP3A4 is highly expressed in the liver and intestine. In contrast, CYP3A5 is polymorphically expressed. CYP3A5*1 leads to active, full-length CYP3A5, with individuals homozygous or heterozygous for the *1 allele reported to have similar levels of CYP3A5 expression (Hustert et al., 2001; Kuehl et al., 2001). The frequency of having at least one CYP3A5*1 allele (expressing active enzyme) has varied with reports, but averages 10%–30% in the Caucasian population and rises to 50%–70% in African Americans (Daly, 2006). The CYP3A5*3 allele (22893A→G) in intron 3 leads to a frame shift in the majority of the CYP3A5 mRNA, yielding inactive protein and loss of CYP3A5 expression. Individuals lacking at least one CYP3A5*1 allele have minimal correctly spliced mRNA coding for CYP3A5 and only trace levels of functional CYP3A5 protein (Hustert et al., 2001; Kuehl et al., 2001; Lamba et al., 2002; Roy et al., 2005). For patients with at least one CYP3A5*1 allele, hepatic CYP3A5 expression is approximately 40% of the total CYP3A protein (Perrett et al., 2007). Thus, substantial amounts of hepatic CYP3A5 protein are available to metabolize CYP3A substrates in CYP3A5*1 individuals.
A number of chemicals have been shown to have moderate (5- to 10-fold) IC50 and/or intrinsic clearance differences between CYP3A4 and CYP3A5 (Ekins et al., 2003). Individuals taking specific drug combinations with differing CYP3A4/5 intrinsic clearance or inhibitory potential are likely to have altered susceptibility to drug-drug interactions depending on their CYP3A5 genotype.
The clinical significance of CYP3A5 polymorphisms has been demonstrated in pharmacokinetic and drug-drug interaction studies. The immunosuppressant tacrolimus requires trough concentration to be maintained between 5 and 15 ng/ml. Patients who express active CYP3A5 (*1/*1 or *1/*3) require approximately twice the dose compared with *3/*3 patients to maintain an appropriate tacrolimus concentration (Zhao et al., 2005; Barry and Levine, 2010). The CYP3A5 genotype was also shown to be involved in drug-drug interactions caused by fluconazole, which inhibits CYP3A4 2 to 5 times more potently than CYP3A5. Concomitant dosing of fluconazole increased the area under the curve of intravenously administered midazolam, resulting in larger increases in midazolam exposure in patients lacking the *1 allele, 124 versus 198 nM*h, P = 0.02 (Isoherranen et al., 2008).
CYP3A5 *3/*3 single-donor microsomes can be used to essentially isolate CYP3A4 activity, but there is not a similar CYP3A4 loss-of-function mutation allowing for the isolation of CYP3A5 activity. A selective CYP3A5 substrate will facilitate more accurate predictions when using human microsomes than those that could be achieved with recombinant P450. Human liver microsomes (HLM) have full-length P450 enzyme without modification of the membrane spanning region and have physiologic ratios of P450s, NADPH-oxidoreductase, and cytochrome b5. Studies using CYP3A4 coexpressed with NADPH-oxidoreductase in bacteria (Escherichia coli), yeast (Saccharomyces cerevisiae), and human B-lymphoblastoid cells demonstrated 9-fold differences in the maximal rates of midazolam and diazepam metabolism between the different expression systems, leading to high variability in the predicted intrinsic clearance (Andrews et al., 2002). Batch-to-batch variability is also a concern, where published IC50 values using recombinant 3A4 showed up to 29-fold variation (Stresser et al., 2000; Wang et al., 2000; Andrews et al., 2002).
We describe the CYP3A5 selective catalysis of an N-oxide metabolite of T-5, T-1032 [methyl 2-(4-aminophenyl)-1-oxo-7-(pyridin-2-ylmethoxy)-4-(3,4,5-trimethoxyphenyl)-1,2-dihydroisoquinoline-3-carboxylate]. T-1032 was first synthesized by Tanabe Seiyaku Co. (Osaka, Japan). Before the clinical trials were discontinued, T-1032 had advanced to phase II as a selective cyclic GMP phosphodiesterase-5 inhibitor, intended to compete with Viagra (sildenafil citrate; Pfizer, New York, NY). We refer to the compound as T-5 to reflect the role of Tenabe and the properties of the molecule as a selective inhibitor of phosphodiesterase-5 and a selective marker substrate for evaluation of CYP3A5 activity.
Materials and Methods
Chemicals.
Unless otherwise indicated, chemicals were purchased from Sigma-Aldrich (St. Louis, MO). T-5 (T-1032) was originally purchased from Sigma Chemical as part of a high-throughput screening library (LOPAC-1080). T-5 was discontinued by Sigma-Aldrich and an alternative commercial vendor could not be found. Additional T-5 and T-5 N-oxide was obtained through contract synthesis from WuXi PharmaTech (Shanghai, People’s Republic of China) and was later synthesized at Scripps Florida (Scripps Research Institute, Jupiter, FL). T-5 (#A622635) and T-5 N-oxide (#A622640) can now be obtained from Toronto Research Chemical (Toronto, Ontario, Canada). SR-9186 [1-(4-(3H-imidazo[4,5-b]pyridin-7-yl)phenyl)-3-(4′-cyano-[1,1′-biphenyl]-4-yl)urea] (Li et al., 2012; Song et al., 2012) was synthesized at Scripps Florida. All solvents used for liquid chromatography coupled with tandem mass spectrometry (LC-MS/MS) were chromatographic grade. Pooled HLM was purchased from Xenotech (Lenexa, KS).
Recombinant CYP3A4 and CYP3A5 were obtained from PanVera Corporation (Madison, WI). In later phenotyping studies, 11 recombinant human cytochromes P450 (CYP1A1, 1A2, 2A6, 2B6, 2C8, 2C9, 2C19, 2D6, 3A4, 3A5, and 3A7) and three recombinant human flavin-containing monooxygenases (FMO1, FMO3, and FMO5) were purchased from BD Biosciences (Woburn, MA). Recombinant P450 enzymes were microsomal preparations coexpressing P450, NADPH-oxidoreductase, and cytochrome b5. Recombinant P450 enzymes were supplied from the vendor at a concentration of 1 pmol enzyme per microliter.
CYP3A5 genotyped individual donor hepatic microsomes were purchased from both Xenotech and BD Biosciences. Donor lots were as follows (Xenotech lots start with the HH prefix, and donor sex is indicated with an M or F): CYP3A5 *1/*1 donors were HH739(F), HH47(F), HH867(M), HH785(M), HH860(F), 07100271(F), 0710272(F), and 0810554(F); CYP3A5 *1/*3 donors were HH757(M), HH868(M), HH54(F), 0710239(F), 0710231(M), and 0710232(F); CYP3A5 *3/*3 donors were HH61(M), HH792(F), HH189(F), HH837(F), 0710233(F), 0710253(M), and 0710234(M). Cryopreserved human hepatocytes were obtained from Celsis In Vitro Technologies (Baltimore, MD). The donor lot information is as follows: CYP3A5*1/*1 donors were RQM(F), LUH(F), and ZQM(M); CYP3A5*1/*3 donors were OJE(M), NRJ(F), and VLS(F); CYP3A5*3/*3 donors were KQN(F), JCM(F), and XPD(F).
Synthesis of T-5 and T-5 N-Oxide.
The synthesis of T-5 was modified from a previously published method (Ukita et al., 2001). A detailed procedure noting which procedures were changed along with the NMR characterization data for intermediates are included as Supplemental Material and Supplemental Figures 14–17.
Incubations with cDNA-Expressed P450 and Human FMO Enzymes.
Triplicate 200-µl incubations were set up containing 10 pmol/ml recombinant P450 (0.2 mg protein/ml for FMO incubations), 5 µM T-5, 5 mM MgCl2, and 100 mM phosphate buffer, pH 7.4. In accord with the manufacturer recommendations, TRIS buffer was used for CYP2A6, 2C9, and 3A7 incubations. The reactions were shaken at 37°C for 3 minutes to equilibrate temperature before the addition of 1 mM NADPH to start the reaction. After 15 minutes, incubations were stopped with an equal volume of ice-cold acetonitrile (ACN) (containing 0.1 µM dextrorphan as an internal standard), chilled, and centrifuged. The solution was filtered and submitted for LC-MS/MS analysis.
To determine the Michaelis-Menten parameters, a range of T-5 concentrations (0.1–50 µM) were tested, and T-5 N-oxide was quantitated using a standard curve (5, 10, 25, 50, 100, 250, 500, 2500 nM). The LC-MS/MS data were processed using analyst 1.6 software. The standard curve was fit by quadratic regression with correlation coefficients between 0.9997–1.0000 and calculated concentrations for each standard were within 20% of their nominal concentration. The in vitro clearance was calculated for individual enzymes by determining the T-5 half-life with each recombinant enzyme and then fitting the data to the equation CLin vitro = (Incubation volume in µl/pmol enzyme) * ln2/Half-life.
HLM Incubations.
Hepatic microsomal incubations using pooled HLM (150 donors, mixed gender) and individual-donor 3A5-genotyped HLM were conducted at 37°C in 100 mM potassium phosphate buffer, pH 7.4, in a final volume of 250 µl. Each reaction consisted of 0.1 mg protein/ml and contained 5 µM T-5 unless otherwise indicated. All reactions were initiated by the addition of 1 mM NADPH and stopped after 15 minutes by the addition of an equal volume of ACN.
For inhibition studies, the inhibitors included: 10 µM furafylline (CYP1A2), 30 µM phenyl-piperidinyl propane (CYP2B6), 25 µM ticlopidine (CYP2B6/2C19), where the first three inhibitors are time-dependent inhibitors and were preincubated for 30 minutes before initiating the reaction by the addition of T-5; 10µM tranylcypromine (CYP2A6/2B6), 20 µM sulfaphenazole (CYP2C9), 1 µM quinidine (CYP2D6), 1 µM montelukast (CYP2C8), 1 µM SR-9186 (CYP3A4), and 1 µM ketoconazole and ritonavir for total CYP3A. Incubation reactions were conducted in 96-well plates on a shaking incubator maintained at 37°C. At the end of the assay, the reactions were stopped by the addition of an equal volume of cold ACN (containing 0.1 µM internal standard), centrifuged, passed through a Millipore MultiScreen Solvinert 0.45 µm low-binding polytetrafluoroethylene (PTFE) hydrophilic filter plate (Millipore, Billerica, MA), and analyzed by LC-MS/MS. All reactions were performed in triplicate.
Vincristine M1 [2β,3β,4β,5α,12R,19α)-4-(acetyloxy)-6,7-didehydro-1-formyl-3-hydroxy-16-methoxy-15-[(5S,7S)-1,2,3,4,5,6,7,8-octahydro-7-(methoxycarbonyl)-5-(2-oxobutyl)azonino[5,4-b]indol-7-yl]aspidospermidine-3-carboxylic acid methyl ester] formation in genotyped individual donor microsomes was performed using previously published methods (Dennison et al., 2006; Li et al., 2012).
Cryopreserved Human Hepatocyte Incubations.
Cryopreserved human hepatocytes were obtained from Celsis In Vitro Technologies. Nine individual donors comprising three donors each of CYP3A5 *1/*1, *1/*3, and *3/*3 genotype were evaluated. Hepatocytes were thawed according to Celsis’s protocol and resuspended in Krebs-Henseleit buffer to 1,500,000 cells/ml. Then 50 µl of cells were incubated with T-5 (0.021–45 µM) or midazolam (0.18–400 µM) in a final reaction volume of 100 µl, containing 0.5% dimethylsulfoxide. Incubations were stopped after 30 minutes by the addition of an equal volume of methanol. The concentration of 1′-OH midazolam and T-5 N-oxide were determined by LC-MS/MS, and the data were expressed as the pmol of metabolite generated per minute per million live cells.
Relative Quantification of CYP3A5 Content in 3A5-Genotyped Individual-Donor HLM.
To correlate T-5 N-oxide activity with CYP3A5 levels, the relative content of CYP3A5 in individual-donor HLM was determined using a previously published LC-MS/MS method (Williamson et al., 2011). A refined protocol can be downloaded from the AB Sciex Web site (AB Sciex, 2011).
Hepatic microsomes (95 µl at a concentration of 10 mg microsomal protein/ml) were denatured for 5 minutes at 37°C by the addition of 5 µl of 20% N-octyl glucoside. The sample was reduced by adding 10 µl of 50 mM tris(2-carboxyethyl) phosphine and incubated at 50°C for 30 minutes before the addition of 10 µl of 0.2 M iodoacetamide. The mixture was digested overnight at 37°C by adding 20 µg of trypsin. In the morning, 100 µl of ice cold ACN containing 0.5% formic acid was added to the trypsin digested solution. The sample was filtered and subjected to LC-MS/MS analysis.
Chromatographic separations were performed on a Shimadzu Prominence Series 20 High-Performance Liquid Chromatography (HPLC) system (Shimadzu Scientific Instruments Inc., Columbia, MD) fit with a C18 column (Jupiter 5 μm C18 300A, 150 × 2.0 mm i.d.; Phenomenex Inc., Torrance, CA) with a flow rate of 0.7 ml/min. The mobile phase consisted of 0.1% formic acid water (mobile phase A) and 0.1% formic acid in ACN (mobile phase B). Tryptic peptides were eluted using a series of linear gradients: 5% B 0–0.1 minutes, increased to 30% B at 7.0 minutes, 90% B at 10–13 minutes, and back to 5% B from 13.1–18.0 minutes.
An AB Sciex 6500 QTRAP (AB Sciex, Framingham, MA) was used to quantitate the peptides. Initially, all nine multiple reaction monitoring transitions (MRM) listed in Williamson et al. (2011) were followed, representing three transitions for each of three unique CYP3A5 peptides. However, only five transitions had acceptable chromatograms for all samples. Peptides used for quantitation were DTINFLSK(244-251) where the doubly charged parent ion (m/z = 469.5) was fragmented to singly charged fragments, 608.3 and 721.4 AMU. Similarly, the doubly charged ion of the peptide SLGPVGFMK(107-115) was detected using a parent ion of 468.3 and a fragment ion of 735.5. The triple charged ion of GSMVVIPTYALHHDPK(391-406) was detected using a parent ion of 589.1 and fragment ions of 696.0 and 745.5. In the same analytic run, CYP3A4 levels were determined using the following transitions: parent ion 439.7 and fragment ions of 532.3, 549.3, and 650.4; parent ion 564.3 and fragment ions of 689.4, 745.9, and 789.5; parent ion 798.4 and fragment ions of 819.4, 932.5, and 1003.5. The peak area of the individual-donor microsomes were normalized against the 150-donor pool and expressed as a percentage. A representative chromatogram showing the detected peptide signals for different genotypes is available in Supplemental Figures 11–13.
Detection of T-5 and Its Metabolites.
A 5.5-minute chromatographic separation was achieved using an ACE C18-PFP column (50 × 3.0 mm; Advanced Chromatography Technologies Ltd., Aberdeen, Scotland, United Kingdom) with an aqueous mobile phase containing 0.1% formic acid (solvent-A) and ACN with 0.1% formic acid (solvent-B) run at a flow rate of 0.4 ml/min. Linear gradients were used as follows: 0–0.2 minutes = 5% B; 2.0–3.0 minutes = 95% B; and 3.1–5.5 = 5% B.
Metabolite characterization was performed by LC-MS/MS using an API4000 Q-trap (Applied Biosystems, Foster City, CA) or an AB Sciex 6500 QTRAP mass spectrometer. T-5, T-5 N-oxide, and O-dealkylated T-5 were detected using the mass transitions of m/z 568.2→476.2, m/z 584.2→476.2, and m/z 477.2→445.2, respectively. The optimized declustering potential and collision energy were 110 and 37 eV, respectively. The most intense fragment ion for both T-5 and T-5 N-oxide corresponded to fragmentation at the ether bond yielding a fragment of 476.2 AMU. Due to in-source fragmentation, both compounds had significant “crosstalk” with the 477.2→445.2 transition used to monitor the O-dealkylated metabolite of T-5.
NMR of Metabolites.
Metabolites generated by recombinant CYP3A5 were HPLC purified. Peaks were resolved using an ACE Excel 2, C18-PFP, 150 × 4.6 mm analytical column with a 20:1 in-line diverter located between the column and the mass spectrometer. This allowed for simultaneous analysis and sample collection. Samples were concentrated by vacuum centrifugation, resuspended in 0.05 ml of dimethyl sulfoxide-D6 (Cambridge Isotope Laboratories, Andover, MA), and placed in 1.7 mm diameter NMR tubes. The NMR spectra were recorded on a Bruker Avance 600 MHz system (Bruker, Karlsruhe, Germany) controlled by TopSpin v2.0 (Bruker), equipped with a 1.7-mm triple (TCI) cryoprobe. One-dimensional spectra were recorded using a sweep width of 12,000 Hz and a total recycle time of 7.2 seconds. The resulting time-averaged free induction decays were transformed using an exponential line broadening of 1.0 Hz to enhance signal to noise. All spectra were referenced using residual dimethyl sulfoxide-d6 (1H δ = 2.5 ppm and 13C δ = 39.5 relative to TMS, δ = 0.00). Phasing, baseline correction, and integration were all performed manually. If needed, the BIAS- and SLOPE-functions for the integral calculation were adjusted manually.
Other supporting NMR experiments were recorded using the standard pulse sequences provided by Bruker, including homonuclear correlation spectroscopy, total correlation spectroscopy, multiplicity edited heteronuclear single-quantum correlation spectroscopy, and heteronuclear multiple-bond correlation spectroscopy data. Two-dimensional experiments were typically acquired using a 1K × 128 data matrix with 16 dummy scans. The data were zero-filled to a size of 1K × 1K. Unless otherwise noted, for 2D experiments a relaxation delay of 1.5 seconds was used between transients. Postacquisition data analysis was performed with Mnova V8.1.1 software (Mestrelab Research, Santiago de Compostela, Spain).
Data Analysis.
Data were curve fitted to the Michaelis-Menten equation using nonlinear regression analysis in GraphPad Prism (GraphPad Software Inc., San Diego, CA). Correlation analysis was performed using the Pearson method with the two-tailed P value determination, which assumes the data are from Gaussian populations. Calculation of P values testing the statistical significance of the CYP3A5 genotype on T-5 N-oxide formation were done with a one-tailed t test assuming unequal variance. A one-tailed test was chosen instead of two-tailed because the result of having the CYP3A5*1 allele would be increased CYP3A5 expression, and the Gaussian distribution would primarily present with a positive tail for the increased CYP3A5 expression.
Results
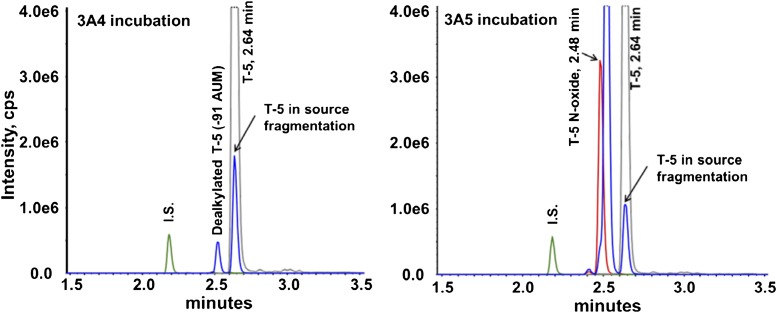
Preliminary incubations of T-5 with recombinant CYP3A4 and CYP3A5 resulted in the formation of metabolites corresponding to a mass increase of +16 AMU, consistent with the addition of an oxygen, or a loss of −91 AMU, corresponding to O- or N-dealkylation of the methylpyridine or amino phenyl, respectively. Statistically significant differences between CYP3A4 and CYP3A5 were observed for the major +16 AMU metabolite (Fig. 1), where the peak area of the CYP3A5 specific (+O) metabolite was almost 100-fold greater than that from CYP3A4 incubations. CYP3A5 was also more efficient at generating the −91 AMU metabolite, but the ratio was smaller than for the +16 AMU metabolite. A second −91 AMU peak was observed in the mass spectrometer, but this was caused by in-source fragmentation of T-5 as mentioned in the Materials and Methods section. The tandem mass spectrometry (MS/MS) spectra for each peak is included as Supplemental Figure 10.
Fig. 1.
Chromatograms from T-5 incubations. Incubations contained 5 µM T-5 and 10 pmol/ml recombinant P450 and were initiated with 1 mM NADPH. After 15 minutes, the incubation was stopped with an equal volume of ACN containing 0.1 µM dextrorphan as an internal standard. The multiple reaction monitoring (MRM) chromatograms obtained from incubations containing CYP3A4 and CYP3A5 are presented with traces representing T-5 (gray), along with +16 AMU (red) and −91 AMU (blue) metabolites.
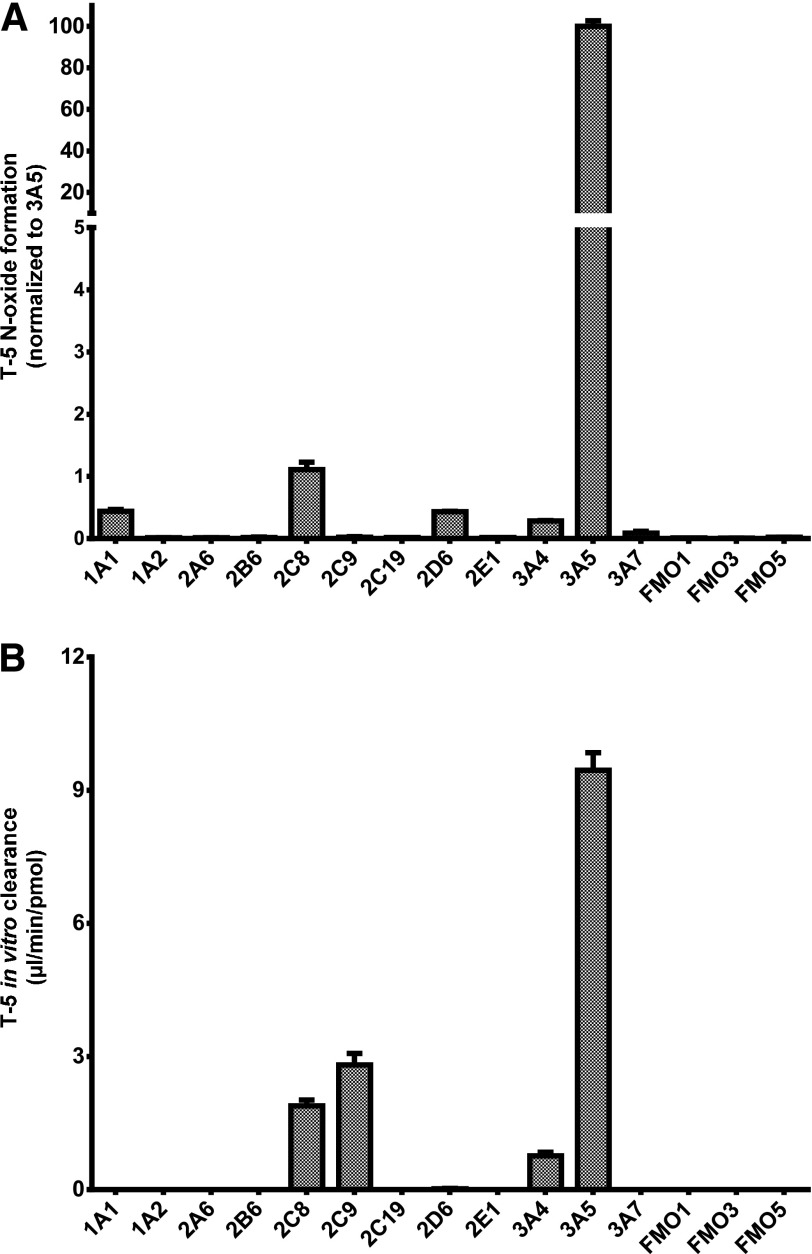
A larger panel of recombinant P450s and FMOs were examined after T-5 depletion and metabolite formation. As shown in Fig. 2A, formation of the major +16 AMU metabolite eluting at 2.48 minutes was found to be highly CYP3A5 selective. The concentration of T-5 in Fig. 2 was 5 µM, but similar selectivity was observed when 40 µM T-5 was used (data not shown). T-5 depletion was similarly evaluated using recombinant human P450 enzymes and FMOs (Fig. 2B). The in vitro clearance of T-5 was at least 3 times greater than other enzymes.
Fig. 2.
Formation of T-5 N-oxide in recombinantly expressed enzymes. Twelve P450 and three FMO enzymes were compared. Incubations contained 5 µM T-5 and 10 pmol/ml recombinant enzyme and were initiated with 1 mM NADPH. To minimize the potential for thermal inactivation, FMO incubations were initiated by the addition of FMO. (A) After 15 minutes, the incubation was stopped with an equal volume of ACN, and T-5 N-oxide formation was evaluated by LC-MS/MS. (B) T-5 depletion was monitored in parallel incubations using similar conditions, and the data are expressed in terms of in vitro clearance.
The MS/MS fragmentation pattern of the selective +16 AMU metabolite was ambiguous as the incorporated oxygen could be assigned to either the amino phenyl or the methylpyridine ring (structure shown in Fig. 10). Each would result in a fragment of C6H7NO, 109.0528 AMU. The metabolite was tentatively assigned as an N-oxide based on incorporation of deuterium (data not shown). Deuterium incorporation was tested by diluting an incubated sample into D2O and changing the water fraction of the HPLC mobile phase to deuterated water. The observed mass of both T-5 and its selective +16 AMU (+oxygen) metabolite both increased 2 AMU due to exchange of two amino hydrogen with deuterium. If the oxygen had been incorporated through hydroxylation of T-5 on the methylpyridine or amino phenyl rings, this would have resulted in an additional 1 AMU increase in the observed molecular mass because the acidic phenolic (or pyridine-ol) hydrogen would have exchanged with deuterium. Incorporation of the oxygen through formation of an N-oxide would not change the number of exchangeable hydrogen.
Fig. 10.
Kinetic comparison in genotyped human hepatocytes. T-5 N-oxide formation was evaluated in human hepatocytes from nine individual donors, comprising three donors each of the CYP3A5 *1/*1, *1/*3, and *3/*3 genotype. Incubations were 100 µl volume containing 75,000 cells and were stopped after 30 minutes by the addition of an equal volume of methanol. Parallel incubations using the same hepatocyte lots were set up after midazolam hydroxylation to show that the hepatocytes were metabolically viable and that the low level of T-5 N-oxide formation in CYP3A5 *3/*3 donor hepatocytes was not due to low total CYP3A expression.
Further evidence of the formation of an N-oxide metabolite comes from the addition of TiCl3. The proposed N-oxide metabolite was reduced upon the addition of TiCl3 (data not shown) to reform T-5. TiCl3 is known to efficiently reduce nitrogen-oxide back to its amine form, but does not reduce hydroxylated phenyl or pyridine (Seaton et al., 1984; Kulanthaivel et al., 2004).
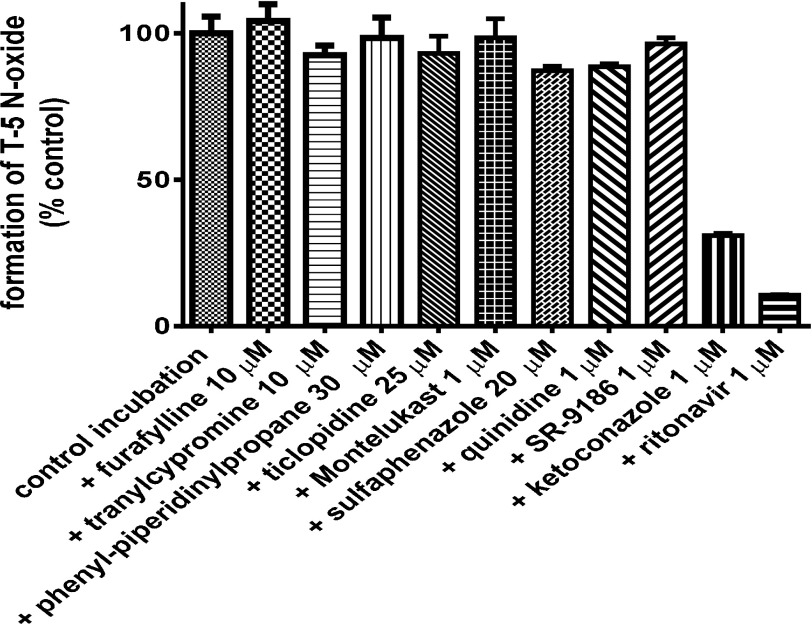
The selective N-oxide metabolite was formed in incubations containing T-5 and human liver microsomes (Fig. 3). Selective inhibitors of several P450 enzymes, including SR-9186, a selective inhibitor of CYP3A4 (Song et al., 2012), did not decrease formation of the N-oxide metabolite. Addition of 1 µM ketoconazole inhibited the reaction by 69%, which is consistent with the published potency of ketoconazole against CYP3A5 (ketoconazole IC50 = 20–50 nM for CYP3A4 and 150-300 nM for CYP3A5) (Soars et al., 2006). Ritonavir inhibited by 89%, consistent with ritonavir being a potent inhibitor of both CYP3A enzymes. The ritonavir incubation was repeated to include a 20-minute preincubation in the presence of NADPH, which resulted in increased inhibition due to the time-dependent properties of ritonavir’s CYP3A inhibition (data not shown).
Fig. 3.
Inhibition of T-5 N-oxide formation in human liver microsomes. Incubations contained 5 µM T-5 and 0.2 mg/ml HLM protein and were initiated with the addition of 1 mM NADPH. After 15 minutes, the incubation was stopped with an equal volume of ACN (with 0.1 µM dextrorphan as internal standard), and the T-5 N-oxide formation was evaluated by LC-MS/MS. Selective inhibitors included furafylline (CYP1A2), tranylcypromine (CYP2A6/2B6), 2-phenyl-2-(1-piperidinyl)propane (PPP) (CYP2B6), ticlopidine (CYP2B6/2C19), montelukast (CYP2C8), sulfaphenazole (CYP2C9), quinidine (CYP2D6), SR-9186 (CYP3A4), ketoconazole (CYP3A4 and CYP3A5), and ritonavir (CYP3A4 and CYP3A5).
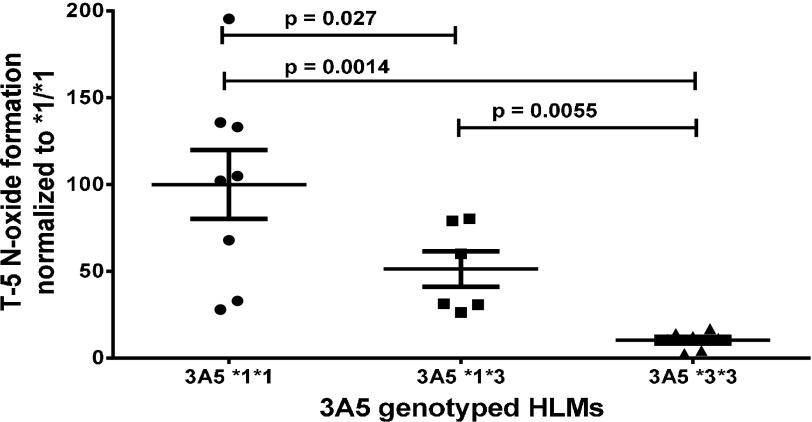
T-5 was used to characterize individually genotyped HLM. At least six individual donors with CYP3A5 *1/*1, *1/*3, or *3/*3 genotype were tested (Fig. 4). Donors who had a least one copy of the *1 allele had statistically significantly higher rates of T-5 N-oxide formation. Minimal T-5 N-oxide formation was observed in the *3/*3 donors. Of interest, a commercial 150-donor mixed gender pool of HLM behaved the most similar to the *3/*3 genotyped donors.
Fig. 4.
T-5 N-oxide formation in genotyped HLM. Incubations contained 5 µM T-5, 0.1 mg/ml CYP3A5-genotyped individual-donor hepatic microsomes and 1 mM NADPH. T-5 N-oxide quantitation was based on peak area and normalized to the average for the *1/*1 donors. Error bars are standard deviation, and P values are one-tailed t test assuming unequal variance.
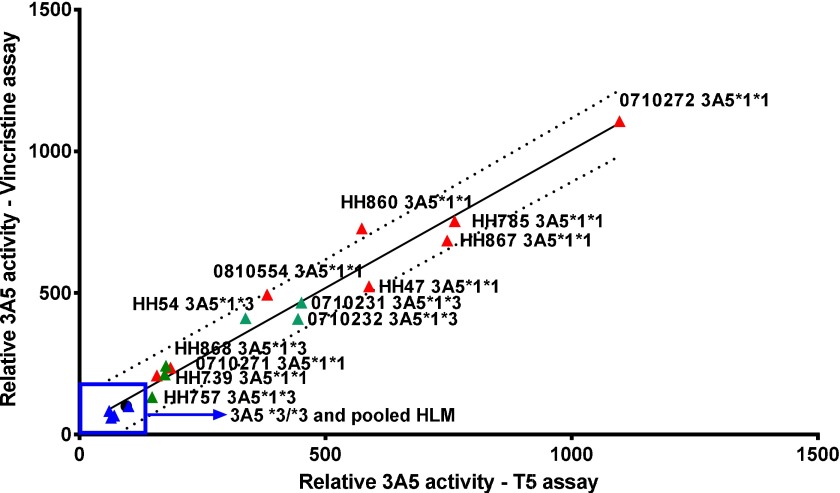
N-oxide formation in individually genotyped HLM was compared with vincristine M1 formation (Fig. 5). Vincristine M1 is 5-fold to 10-fold selective for CYP3A5 over CYP3A4 (Dennison et al., 2006, 2007), which makes it useful for correlation studies; however, M1 formation is not sufficiently selective for CYP3A5 inhibition studies because the levels of CYP3A4 greatly exceed CYP3A5 in commercial batches of pooled hepatic microsomes, resulting in similar levels of M1 formed by both 3A4 and 3A5 in an unbiased pool with a large number of donors. Additionally, M1 is unstable and degrades if left on the autosampler or under basic conditions.
Fig. 5.
Activity correlation. The relative rates of vincristine M1 and T-5 N-oxide formation were compared. Incubations contained 0.1 mg/ml hepatic microsomes and 1 mM NADPH with either 5 µM T-5 or 20 µM vincristine. Activity was normalized against a 150-donor HLM pool, represented by a black circle that is partially obscured by the *3/*3 donor in the upper right-hand side of the boxed-in area. The dashed lines of the regression are the 90% prediction bands. The Pearson r value of the correlation was 0.982, P < 0.0001.
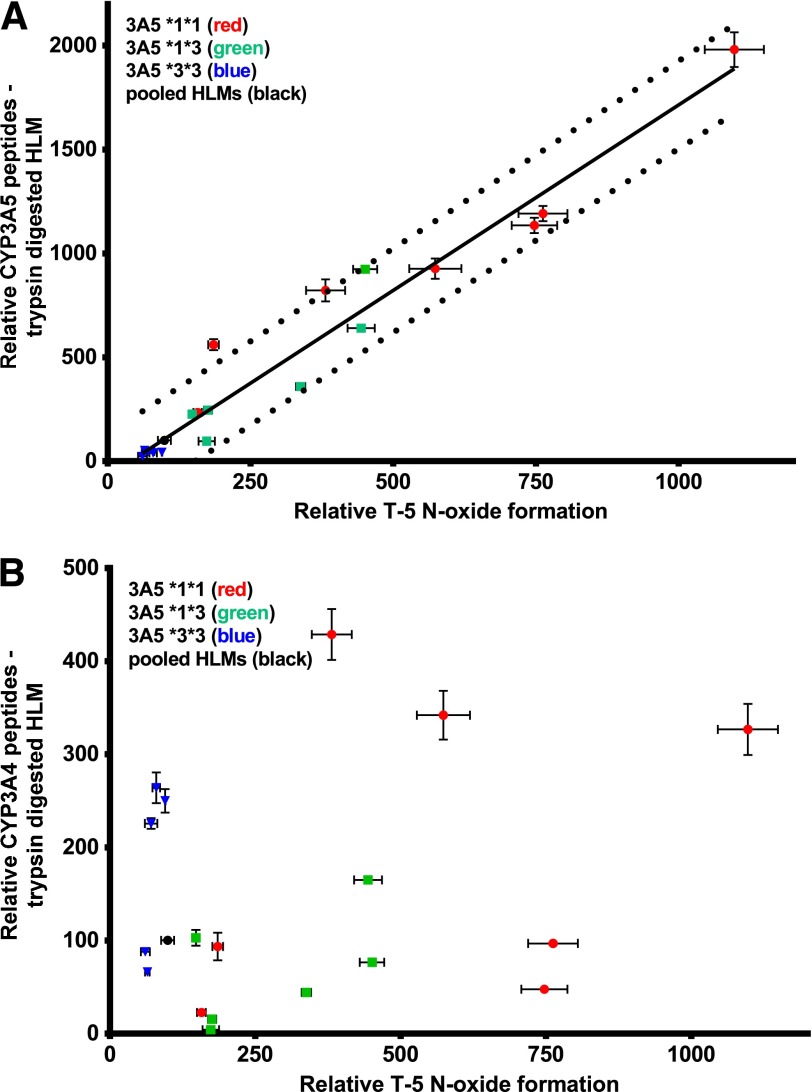
To further evaluate the correlation of T-5 N-oxide formation and the CYP3A5 genotype, individual-donor microsomes were digested with trypsin, and unique CYP3A5 peptides were monitored (Fig. 6A). The activity and peptide levels were both normalized to the Xenotech 150-donor pooled liver microsomes. One of the donors in Fig. 5 had been depleted and could not be reordered, so a new lot of genotyped individual-donor microsomes was substituted. Similar to the activity assays, peptide quantification indicated that the 150-donor pool most closely reflected the *3/*3 donors. A similar analysis with CYP3A4 showed no correlation (Fig. 6B).
Fig. 6.
Correlation of T-5 N-oxide formation versus CYP3A5 expression level. The relative rate of T-5 N-oxide formation was determined and normalized (expressed as a percentage of the level in pooled HLM). Incubations contained 0.1 mg/ml hepatic microsomes, 5 µM T-5 and 1 mM NADPH. CYP3A4 and 3A5 content was estimated by digesting 1 mg microsomal protein with 20 µg trypsin in an overnight incubation at 37°C. P450 specific peptides were evaluated by LC-MS/MS. All error bars reflect standard deviation of triplicate analysis and the dashed lines of the regression are the 90% prediction band. The Pearson r value of the correlation for CYP3A5 (A) was 0.9736, P < 0.0001, and CYP3A4 (B) was 0.2791, and the correlation was not statistically significant.
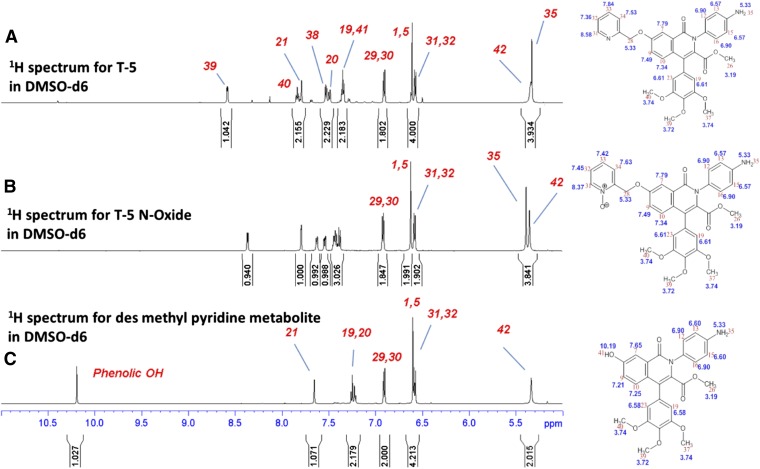
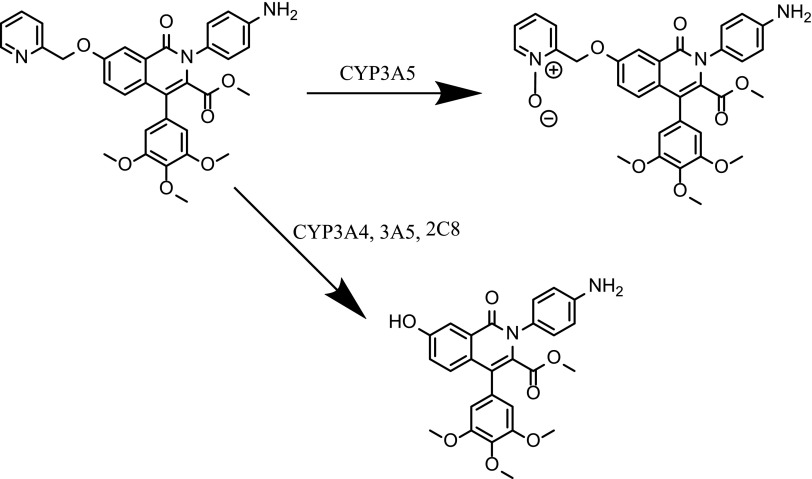
T-5 (T-1032) was discontinued by Sigma-Aldrich before completion of the characterization. Additional compound could be obtained only through contracting for custom synthesis. The contracted synthesis, which was based on methods from the original patent, worked very poorly. After pooling the final product from three attempts, 13 mg was obtained (≈10% of the target quantity). However, this was sufficient to set up parallel incubations of T-5 in recombinant CYP3A5. A 20:1 splitter was inserted between the HPLC and the mass spectrometer to allow the majority of the volume to be collected while still getting real-time MS/MS verification of the eluted peaks. The fractions from multiple injections were combined, lyophilized, and analyzed by NMR using a 1.7-mm cryoprobe. The two metabolites were referred to as M1 and M2 until their structures were determined. The complete 1D and 2D data sets as well as complete 1H and selected 13C assignments for T-5, T-5 N-oxide (M1), and desmethyl pyridine T-5 (M2) are contained in Supplemental Figures 1–9. The 1H spectrum T-5-M1 retained all of the resonances observed in T-5 with only minor changes in the chemical shifts to those resonances of the pyridine ring (Fig. 7B). This strongly supports the proposed N-oxide structure of T5-M1. In the 1H spectrum of T-5-M2, the resonances of the methyl pyridine hydrogens are absent, and there is an additional singlet with a chemical shift of 10.21 ppm (Fig. 7C). These data are consistent with the T-5 metabolites depicted in Fig. 8.
Fig. 7.
Aromatic portion of the 1H spectrum of (A) T-5, (B) T-5 N-oxide, and (C) dealkylated T-5. Additional annotated NMR spectra are included in Supplemental Figures 1–9.
Fig. 8.
Major metabolites generated by CYP3A4 and CYP3A5.
In collaboration with the Micalizio group, the published synthesis of T-5 was significantly improved, and a simple detour was established to generate the N-oxide. A detailed synthesis along with spectral properties for all intermediates is included in the Supplemental Material. The authentic standards were used to confirm the metabolites by NMR and LC-MS/MS.
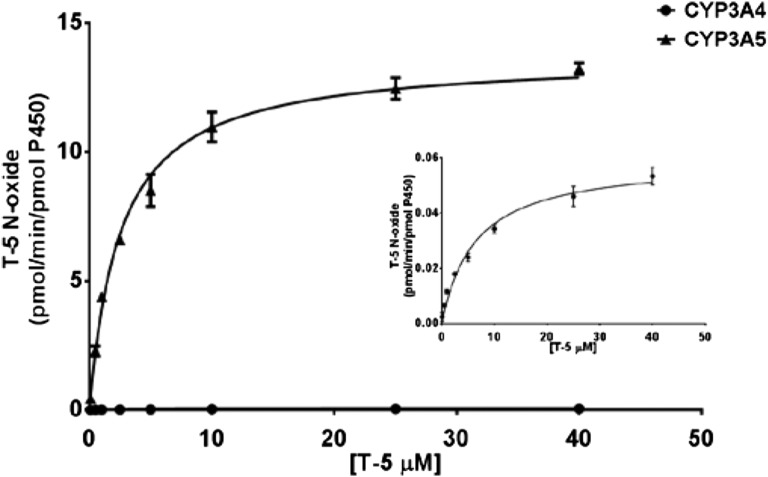
The kinetics of T-5 N-oxide formation were repeated when a T-5 N-oxide standard was available. This allowed for absolute rather than relative quantitation. The activity versus concentration curve for CYP3A4 and CYP3A5 are shown in Fig. 9. The CYP3A4 curve is lost in the baseline, so an insert is provided where the y-axis is 250-times zoomed. Determined KM and Vmax along with calculated Vmax/KM values are provided in Table 1.
Fig. 9.
Kinetics of T-5 N-oxide formation. Multiple concentrations of T-5 (0.1–40 µM) were incubated with 10 pmol/ml recombinant CYP3A4 or CYP3A5 in the presence of 1 mM NADPH for 15 minutes. Incubations were stopped by the addition of an equal volume of ACN. Results were fit to the Michaelis-Menten equation. When plotted on the same scale, CYP3A4 results cannot be discerned from the x-axis and are presented as an insert to aid in evaluation of the data. Calculated kinetic constants are provided in Table 1.
TABLE 1.
T-5 N-oxide kinetic constants
Kinetic constants were determined using 10 pmol/ml recombinant P450 or 0.1 mg/ml HLM and are reported as pmol/min/pmol P450 except with pooled HLM where the units are pmol/min/mg microsomal protein.
| Enzyme |
Km |
Vmax |
Vmax/Km |
|---|---|---|---|
| µM | pmol/min/pmol | ||
| rCYP2C8 | 1.6 | .22 | 0.14 |
| rCYP2D6 | 31 | .30 | 0.01 |
| rCYP3A4 | 6.4 | .06 | 0.01 |
| rCYP3A5 | 2.6 | 13.9 | 5.4 |
| HLM | 5.1 | 19.6a |
Units are pmol/min/mg microsomal protein.
To ensure that T-5 can be used in cellular environments, hepatocyte incubations were conducted, and the rate of T-5 N-oxide formation was determined. Similar to microsomal incubations, the level of T-5 N-oxide formation was minimal in *3/*3 donors when compared with individuals with at least one *1 allele. Comparison incubations were conducted using midazolam to ensure that the lower level of T-5 N-oxide formation in the *3/*3 donors was due to lower levels of CYP3A5 and not due to low levels of total CYP3A protein. Calculated Km values for the hepatocyte incubations were 6.2 ± 1.4 µM for the *1/*1 donors, 6.6 ± 2.4 µM for the *1/*3 donors, and 3.1 µM for the *3/*3 donors. The calculated KM in hepatocyte incubations were similar to what was found with pooled HLM: 5.1 µM (Table 1).(Fig.10).
Discussion
The ability to predict human pharmacokinetics based on in vitro experimentation and preclinical animal studies has long been a challenge. Before 1990, one of the major causes of clinical failure was poor pharmacokinetics, particularly oral bioavailability, which to approximately 40% of clinical failures are attributed. By the year 2000, this number was below 10% (Kola and Landis, 2004), and today figures of 1%–3% are quoted. This improvement reflects a major advancement in the field of drug metabolism and pharmacokinetics.
As the field continues to progress, we are no longer limited to pharmacokinetics predictions for the average patient; now, we can start to predict special populations such as patients with hepatic or renal dysfunction or those with specific P450 polymorphisms. Predictions are needed to evaluate the potential of drugs to be both the victim and perpetrator in drug-drug interactions. All of these models are predicated on the ability to obtain high-quality preclinical data.
In the case of CYP3A4 and CYP3A5, these two enzymes have long been acknowledged to have different catalytic efficiencies for different compounds, but the lack of quality substrates and inhibitors has given rise to the longstanding practice of lumping the two together and pretending that they reflect a single enzyme.
Using recombinantly expressed enzymes, several substrates have been shown to have higher catalytic efficiency with either CYP3A4 or CYP3A5 (Ekins et al., 2003), but the tools were not available for the evaluation of these activities in microsomal or hepatocyte incubations. With the introduction of two selective CYP3A4 inhibitors in 2012, the suicide inhibitor Cyp3cide (Walsky et al., 2012) and competitive inhibitor SR-9186 (Li and Cameron, 2012; Song et al., 2012), along with the substrate detailed in our study, the tools to evaluate differences in CYP3A4/5 and the importance of the CYP3A5 genotype have significantly improved.
We found the 150-donor mixed-gender pool of HLM from Xenotech to have minimal CYP3A5 protein levels, and the CYP3A5 activity was similar to *3/*3 donors. This likely reflects a low percentage of *1/*1 donors used to generate the pool. If the commercial pools from other vendors have a similar profile, this may have significant consequences as microsomal experiments would be unlikely to identify the metabolic contribution of CYP3A5 even for compounds with significant preference for CYP3A5 over CYP3A4.
The enzymatic conversion of T-5 to T-5 N-oxide highly correlated to CYP3A5 levels and represents a CYP3A5 selective marker reaction. We hesitate to term T-5 as a CYP3A5 selective substrate because other enzymes can metabolize T-5 to generate alternate metabolites. The in vitro clearance of T-5 by CYP3A5 was three times greater than other enzymes tested, implying that CYP3A5 may be a major metabolic pathway for CYP3A5*1 individuals. For CYP3A5*3/*3 individuals, CYP2C8, 2C9, and 3A4 would be expected to play significant roles in T-5 metabolism.
Increased T-5 N-oxide formation was statistically significant for microsomes from patients with a CYP3A5 *1/*1 genotype over those with *1/*3. This difference was not observed with hepatocytes. It is unclear if the difference is due to the low number of tested microsome and hepatocyte donors, or if there are additional undetermined factors to consider. In all cases there was a large and statistically significant difference between those donors with at least one *1 allele and those without.
Based on the intercept of the regression line when T-5 N-oxide formation was correlated to CYP3A5 content, determined by tryptic digestion of the microsomes, there appears to be a low level of background T-5 N-oxide formation. This may be a cumulative contribution from all other P450 enzymes, FMO, and unknown enzymes toward the generation of T-5 N-oxide or may be due to low levels of a hydroxyl metabolite that coelutes with the N-oxide and is observed with the same mass transitions. In most cases, this background level is likely to be of little consequence, but it becomes more prominent as CYP3A5 levels decrease. It should be pointed out that all samples regardless of genotype did contain CYP3A5. Chromatographic peaks for CYP3A5 specific peptides were detectable for all of the *3/*3 donors. Control samples using digested mouse and rat microsomes did not contain peaks corresponding to the CYP3A5 peptide (data not shown).
T-5 was in clinical trials as a selective phosphodiesterase type 5 inhibitor (T-1032). Unfortunately, the data are not publicly available to determine whether there was an associated change in T-1032 pharmacokinetics depending on the patient’s CYP3A5 genotype. Based on the in vitro experimentation presented in our study, it would be expected that patients with at least one CYP3A5 *1 allele may have significantly higher concentrations of the N-oxide and/or desmethylpyridine metabolites, and it is possible that overall T-5 clearance would be altered. How this might affect the pharmacodynamics or safety of T-1032 in CYP3A5*1 patients would be of interest. Because the *1 allele is much more prevalent in African Americans than in Caucasian or Asian populations, it is possible that there could be a racial component to the drug efficacy or safety.
The idea of personalized medicine has primarily focused on pairing patients with the best drug for optimal efficacy. However, personalized medicine should not be reserved to efficacy. As the contribution of genetics and disease state become understood, improvement in patient safety should be achievable, with optimal drug pairings or dose adjustments determined in a proactive rather than reactionary setting. To achieve this goal, having the appropriate in vitro tools to advance the science is paramount.
We believe T-5 represents an exciting new discovery in the ability to elucidate the influence of the CYP3A5 genotype on currently marketed drugs and those being developed in the future. Cases where the CYP3A5 genotype appears to have a high potential to influence exposure or metabolite profile can be studied with intelligently designed clinical trials, similar to those currently used for patients with high and low CYP2D6 activity.
Supplementary Material
Abbreviations
- ACN
acetonitrile
- FMO
flavin-containing monooxygenase
- HLM
human liver microsomes
- HPLC
high-performance liquid chromatography
- LC-MS/MS
liquid chromatography coupled with tandem mass spectrometry
- MS/MS
tandem mass spectrometry
- SR-9186
1-(4-(3H-imidazo[4,5-b]pyridin-7-yl)phenyl)-3-(4′-cyano-[1,1′-biphenyl]-4-yl)urea
- T-1032
methyl 2-(4-aminophenyl)-1-oxo-7-(pyridin-2-ylmethoxy)-4-(3,4,5-trimethoxyphenyl)-1,2-dihydroisoquinoline-3-carboxylate
- vincristine M1 [2β
3β,4β,5α,12R,19α)-4-(acetyloxy)-6,7-didehydro-1-formyl-3-hydroxy-16-methoxy-15-[(5S,7S)-1,2,3,4,5,6,7,8-octahydro-7-(methoxycarbonyl)-5-(2-oxobutyl)azonino[5,4-b]indol-7-yl]aspidospermidine-3-carboxylic acid methyl ester
Authorship Contributions
Participated in research design: Cameron, Li, Jeso.
Conducted experiments: Li, Jeso, Heyward, Walker, Sharma.
Contributed new reagents or analytic tools: Jeso, Micalizio.
Performed data analysis: Cameron, Li, Jeso, Walker.
Wrote or contributed to the writing of the manuscript: Cameron, Li, Jeso.
Footnotes
This work was supported by a research grant from the National Institutes of Health National Institute of Diabetes and Digestive and Kidney Diseases [Grant R21 DK091630] (to M.D.C.).
 This article has supplemental material available at dmd.aspetjournals.org.
References
- AB Sciex (2011) CYP450 Protein Assay—Human Induction Kit: Reagents for Relative Protein Quantification of Cytochrome P450 Isoforms—Human 1A2, 2B6, 3A4, and 3A5. AB Sciex Pte. Ltd., Foster City, CA; http://www.absciex.com/Documents/Downloads/Software/CYP450-FINAL-PROTOCOL-4444550D.pdf [Google Scholar]
- Andrews J, Abd-Ellah MF, Randolph NL, Kenworthy KE, Carlile DJ, Friedberg T, Houston JB. (2002) Comparative study of the metabolism of drug substrates by human cytochrome P450 3A4 expressed in bacterial, yeast and human lymphoblastoid cells. Xenobiotica 32:937–947 [DOI] [PubMed] [Google Scholar]
- Barry A, Levine M. (2010) A systematic review of the effect of CYP3A5 genotype on the apparent oral clearance of tacrolimus in renal transplant recipients. Ther Drug Monit 32:708–714 [DOI] [PubMed] [Google Scholar]
- Bu HZ. (2006) A literature review of enzyme kinetic parameters for CYP3A4-mediated metabolic reactions of 113 drugs in human liver microsomes: structure-kinetics relationship assessment. Curr Drug Metab 7:231–249 [DOI] [PubMed] [Google Scholar]
- Daly AK. (2006) Significance of the minor cytochrome P450 3A isoforms. Clin Pharmacokinet 45:13–31 [DOI] [PubMed] [Google Scholar]
- Dennison JB, Jones DR, Renbarger JL, Hall SD. (2007) Effect of CYP3A5 expression on vincristine metabolism with human liver microsomes. J Pharmacol Exp Ther 321:553–563 [DOI] [PubMed] [Google Scholar]
- Dennison JB, Kulanthaivel P, Barbuch RJ, Renbarger JL, Ehlhardt WJ, Hall SD. (2006) Selective metabolism of vincristine in vitro by CYP3A5. Drug Metab Dispos 34:1317–1327 [DOI] [PubMed] [Google Scholar]
- Ekins S, Stresser DM, Williams JA. (2003) In vitro and pharmacophore insights into CYP3A enzymes. Trends Pharmacol Sci 24:161–166 [DOI] [PubMed] [Google Scholar]
- Hustert E, Haberl M, Burk O, Wolbold R, He YQ, Klein K, Nuessler AC, Neuhaus P, Klattig J, Eiselt R, et al. (2001) The genetic determinants of the CYP3A5 polymorphism. Pharmacogenetics 11:773–779 [DOI] [PubMed] [Google Scholar]
- Isoherranen N, Ludington SR, Givens RC, Lamba JK, Pusek SN, Dees EC, Blough DK, Iwanaga K, Hawke RL, Schuetz EG, et al. (2008) The influence of CYP3A5 expression on the extent of hepatic CYP3A inhibition is substrate-dependent: an in vitro-in vivo evaluation. Drug Metab Dispos 36:146–154 [DOI] [PubMed] [Google Scholar]
- Kola I, Landis J. (2004) Can the pharmaceutical industry reduce attrition rates? Nat Rev Drug Discov 3:711–715 [DOI] [PubMed] [Google Scholar]
- Kuehl P, Zhang J, Lin Y, Lamba J, Assem M, Schuetz J, Watkins PB, Daly A, Wrighton SA, Hall SD, et al. (2001) Sequence diversity in CYP3A promoters and characterization of the genetic basis of polymorphic CYP3A5 expression. Nat Genet 27:383–391 [DOI] [PubMed] [Google Scholar]
- Kulanthaivel P, Barbuch RJ, Davidson RS, Yi P, Rener GA, Mattiuz EL, Hadden CE, Goodwin LA, Ehlhardt WJ. (2004) Selective reduction of N-oxides to amines: application to drug metabolism. Drug Metab Dispos 32:966–972 [PubMed] [Google Scholar]
- Lamba JK, Lin YS, Schuetz EG, Thummel KE. (2002) Genetic contribution to variable human CYP3A-mediated metabolism. Adv Drug Deliv Rev 54:1271–1294 [DOI] [PubMed] [Google Scholar]
- Li X, Cameron MD. (2012) Potential role of a quetiapine metabolite in quetiapine-induced neutropenia and agranulocytosis. Chem Res Toxicol 25:1004–1011 [DOI] [PubMed] [Google Scholar]
- Li X, Song X, Kamenecka TM, Cameron MD. (2012) Discovery of a highly selective CYP3A4 inhibitor suitable for reaction phenotyping studies and differentiation of CYP3A4 and CYP3A5. Drug Metab Dispos 40:1803–1809 [DOI] [PMC free article] [PubMed] [Google Scholar]
- Liu YT, Hao HP, Liu CX, Wang GJ, Xie HG. (2007) Drugs as CYP3A probes, inducers, and inhibitors. Drug Metab Rev 39:699–721 [DOI] [PubMed] [Google Scholar]
- Niwa T, Murayama N, Emoto C, Yamazaki H. (2008) Comparison of kinetic parameters for drug oxidation rates and substrate inhibition potential mediated by cytochrome P450 3A4 and 3A5. Curr Drug Metab 9:20–33 [DOI] [PubMed] [Google Scholar]
- Perrett HF, Barter ZE, Jones BC, Yamazaki H, Tucker GT, Rostami-Hodjegan A. (2007) Disparity in holoprotein/apoprotein ratios of different standards used for immunoquantification of hepatic cytochrome P450 enzymes. Drug Metab Dispos 35:1733–1736 [DOI] [PubMed] [Google Scholar]
- Roy JN, Lajoie J, Zijenah LS, Barama A, Poirier C, Ward BJ, Roger M. (2005) CYP3A5 genetic polymorphisms in different ethnic populations. Drug Metab Dispos 33:884–887 [DOI] [PubMed] [Google Scholar]
- Seaton QF, Lawley CW, Akers HA. (1984) The reduction of aliphatic and aromatic N-oxides to the corresponding amines with titanium(III) chloride. Anal Biochem 138:238–241 [DOI] [PubMed] [Google Scholar]
- Soars MG, Grime K, Riley RJ. (2006) Comparative analysis of substrate and inhibitor interactions with CYP3A4 and CYP3A5. Xenobiotica 36:287–299 [DOI] [PubMed] [Google Scholar]
- Song X, Li X, Ruiz CH, Yin Y, Feng Y, Kamenecka TM, Cameron MD. (2012) Imidazopyridines as selective CYP3A4 inhibitors. Bioorg Med Chem Lett 22:1611–1614 [DOI] [PMC free article] [PubMed] [Google Scholar]
- Stresser DM, Blanchard AP, Turner SD, Erve JC, Dandeneau AA, Miller VP, Crespi CL. (2000) Substrate-dependent modulation of CYP3A4 catalytic activity: analysis of 27 test compounds with four fluorometric substrates. Drug Metab Dispos 28:1440–1448 [PubMed] [Google Scholar]
- Thummel KE, Wilkinson GR. (1998) In vitro and in vivo drug interactions involving human CYP3A. Annu Rev Pharmacol Toxicol 38:389–430 [DOI] [PubMed] [Google Scholar]
- Ukita T, Nakamura Y, Kubo A, Yamamoto Y, Moritani Y, Saruta K, Higashijima T, Kotera J, Takagi M, Kikkawa K, et al. (2001) Novel, potent, and selective phosphodiesterase 5 inhibitors: synthesis and biological activities of a series of 4-aryl-1-isoquinolinone derivatives. J Med Chem 44:2204–2218 [DOI] [PubMed] [Google Scholar]
- Walsky RL, Obach RS, Hyland R, Kang P, Zhou S, West M, Geoghegan KF, Helal CJ, Walker GS, Goosen TC, et al. (2012) Selective mechanism-based inactivation of CYP3A4 by CYP3cide (PF-04981517) and its utility as an in vitro tool for delineating the relative roles of CYP3A4 versus CYP3A5 in the metabolism of drugs. Drug Metab Dispos 40:1686–1697 [DOI] [PubMed] [Google Scholar]
- Wang RW, Newton DJ, Liu N, Atkins WM, Lu AY. (2000) Human cytochrome P-450 3A4: in vitro drug-drug interaction patterns are substrate-dependent. Drug Metab Dispos 28:360–366 [PubMed] [Google Scholar]
- Wilkinson GR. (1996) Cytochrome P4503A (CYP3A) metabolism: prediction of in vivo activity in humans. J Pharmacokinet Biopharm 24:475–490 [DOI] [PubMed] [Google Scholar]
- Williamson BL, Purkayastha S, Hunter CL, Nuwaysir L, Hill J, Easterwood L, Hill J. (2011) Quantitative protein determination for CYP induction via LC-MS/MS. Proteomics 11:33–41 [DOI] [PubMed] [Google Scholar]
- Yuan R, Madani S, Wei XX, Reynolds K, Huang SM. (2002) Evaluation of cytochrome P450 probe substrates commonly used by the pharmaceutical industry to study in vitro drug interactions. Drug Metab Dispos 30:1311–1319 [DOI] [PubMed] [Google Scholar]
- Zhao Y, Song M, Guan D, Bi S, Meng J, Li Q, Wang W. (2005) Genetic polymorphisms of CYP3A5 genes and concentration of the cyclosporine and tacrolimus. Transplant Proc 37:178–181 [DOI] [PubMed] [Google Scholar]
Associated Data
This section collects any data citations, data availability statements, or supplementary materials included in this article.


