Abstract
In the present work, lattice Boltzmann method (LBM) is applied for simulating flow in a three-dimensional lid driven cubic and deep cavities. The developed code is first validated by simulating flow in a cubic lid driven cavity at 1000 and 12000 Reynolds numbers following which we study the effect of cavity depth on the steady-oscillatory transition Reynolds number in cavities with depth aspect ratio equal to 1, 2 and 3. Turbulence modeling is performed through large eddy simulation (LES) using the classical Smagorinsky sub-grid scale model to arrive at an optimum mesh size for all the simulations. The simulation results indicate that the first Hopf bifurcation Reynolds number correlates negatively with the cavity depth which is consistent with the observations from two-dimensional deep cavity flow data available in the literature. Cubic cavity displays a steady flow field up to a Reynolds number of 2100, a delayed anti-symmetry breaking oscillatory field at a Reynolds number of 2300, which further gets restored to a symmetry preserving oscillatory flow field at 2350. Deep cavities on the other hand only attain an anti-symmetry breaking flow field from a steady flow field upon increase of the Reynolds number in the range explored. As the present work involved performing a set of time-dependent calculations for several Reynolds numbers and cavity depths, the parallel performance of the code is evaluated a priori by running the code on up to 4096 cores. The computational time required for these runs shows a close to linear speed up over a wide range of processor counts depending on the problem size, which establishes the feasibility of performing a thorough search process such as the one presently undertaken.
Keywords: Lattice Boltzmann method (LBM), Single relaxation time (SRT), High Reynolds number flows, Lid driven cavity flows, Parallel computations, Large eddy simulation (LES)
1. Introduction
Lattice Boltzmann method (LBM) is evolving as an alternative method to simulate a variety of fluid flows ranging from low Reynolds number to highly turbulent flows in simple and complex geometries [7, 28]. A few advantages of LBM compared to conventional Navier-Stokes simulations are simple numerical implementation, absence of solving a pressure Poisson equation at every time step and ease of parallelization that stems from local collision and streaming operators. These advantages have made it gain popularity over the past few decades and a variety of applications to blood flows [27, 17, 47], microfluidics [46] and multiphase flows [12, 31] can be found in the literature. Fluid flow in a lid driven cavity is a classical benchmark problem that was studied extensively by many researchers owing to its simple geometric configuration and yet showing a variety of flow features such as corner eddies, bifurcation and transition to turbulence. In the following we present a quick review of previous studies on lid driven cavity flows including experiments, Navier-Stokes equations based and lattice Boltzmann method based numerical simulations and thereafter we move on to the goal of the present study.
1.1. Previous Studies
Benchmark data on two-dimensional lid driven cavity flow were first reported by Ghia et al. [14] and Schreiber and Keller [33]. These results served as classical benchmark data to perform verification and validation studies of several numerical solvers [41, 10, 8, 36, 37]. Very accurate two-dimensional simulations were performed by Botella and Peyret [5] using a spectral method. Later, Hopf bifurcation studies were performed by Goodrich et al. [16], Shen [35], Abouhamza and Pierre [1] and Auteri et al. [3]. These studies have shown that in two-dimensional lid driven cavity flows oscillatory flows can be supported at Reynolds numbers of the order of O(104), whereas three-dimensional lid driven cavity flow become unstable at Reynolds numbers an order of magnitude lesser [2]. A review of flow dynamics in the lid driven cavity problem can be found in Shankar and Deshpande [34] and a quick overview of linear stability in lid driven cavity flows can be found in Theofilis [42].
There have been a number of studies on flow in a three-dimensional lid driven cavity [9, 15, 13, 21, 32]. Numerical benchmark data for a Reynolds number of 1000 in a cubic lid driven cavity were reported by Albensoeder and Kuhlmann [2] using a Chebyshev-collocation in space and Adams-Bashforth backward-Euler scheme in time. Steady state results were reported for a Reynolds number of 865 and 1000 respectively by Tuner et al. [43] and Sun et al. [40] in the code verification and validation studies. Recently, Feldman et al. [11] numerically predicted the onset of oscillatory instability in a three-dimensional lid driven flow in a cubic cavity and found that the oscillatory instability of the flow sets in via a symmetry-breaking sub-critical Hopf bifurcation approximately at a Reynolds number of 1914. In order to further support these numerical observations, they have also performed experiments using particle image velocimetry (PIV) in Liberzon et al. [24]. Through these experiments they were able to obtain a good agreement for the bifurcation Reynolds number and oscillation frequency.
Coming to numerical studies previously undertaken using lattice Boltzmann method, Patil et al. [30] simulated flow in two-dimensional deep lid driven cavities. They showed that the structure of the primary eddy that gets formed just below the top lid has a drastic change with the Reynolds number, but it is not much affected by the depth of the cavity. They conclude that as the cavity depth increases, the flow-structure near the bottom-wall approaches the limiting case of creeping flow. Recently, Lin et al. [26] have performed simulations of two-dimensional deep lid driven cavities at several aspect ratios using a multi relaxation time lattice Boltzmann method. They noted that at a Reynolds number of 7500 steady state results were obtained for a square cavity whereas unsteady solutions prevailed in the deep cavity flow with rapid changes in the shape and location of the corner vortices. In addition, they captured four primary vortices at a cavity depth of 4 using a multi relaxation time model which was not captured by a single relaxation time model. They conclude that multi relaxation time model is more suited for parallel computations when compared with a single relaxation time model, due to the fact that the former has intense local computations. This is somewhat similar to increasing the problem size per process in a parallel computation so that the communication time does not supersede, thus giving rise to a better parallel speed up curves. In another study, they further analyzed transition in two-dimensional deep lid driven cavity flows using parallelization obtained through Graphical Processing Unit (GPU) [25]. By defining an amplitude coefficient they found that in two-dimensional driven cavity flows first Hopf bifurcation Reynolds number decreases with the increase of the cavity depth.
1.2. Present Study
The present effort is motivated following the recent work in identifying the steady-oscillatory transition in three dimensional cubic cavity [11, 24] and in two-dimensional deep lid driven cavities [26, 25]. The effect of side walls on the transition Reynolds number of flow in a real three dimensional cavity scenario and the suitability of LBM solver to carry out a range of time dependent calculations are the driving factors in undertaking the present work. Therefore, the aim of the present study is to characterize the onset of oscillatory instability in lid driven cavity flow at several cavity depths using a three-dimensional fluid domain. The rest of the paper is organized as follows. Lattice Boltzmann method including the governing equations, types of lattice models and boundary conditions are discussed in Section 2. Validation of the developed solver, selection of the grid size and lattice type, parallel performance of the solver and finally the studies on oscillatory instability on cubic and deep lid driven cavities are presented in Section 3. Finally the results obtained are discussed and conclusions are made in Section 4.
2. Lattice Boltzmann Method
2.1. Governing equations
In LBM, the governing equations are the Boltzmann equations given as:
| (1) |
where f(x, t) is particle distribution function that dictates the probability of finding a particle with a velocity e at a location x = (x, y, z) at a particular time instant t, and Ω(f) denotes the collision term. The single relaxation time Bhatnagar, Gross and Krook (BGK) [4] model is used as the collision operator, as follows:
| (2) |
where τ is the relaxation time taken by the non-equilibrium part of the particles to reach the equilibrium distribution function state represented in the equation as feq(x, t). The relaxation time of the particles is related to the microscopic fluid viscosity (ν) as follows:
| (3) |
where Δx and Δt represent the grid size and time step size after a space-time discretization of the equations. The equilibrium distribution function depends on the local density ρ(x, t) and the velocity field u(x, t). In LBM, the evolution of the particle distribution function governed by the Boltzmann equation is discretized on a lattice type [29]. To derive the lattice Boltzmann equation, the Boltzmann equation needs to be discretized in the microscopic velocity space into a finite number of velocity links eα and we have a corresponding discrete set of fα and . An incompressible counterpart of the BGK model is proposed for low-Reynolds number 2D plane Poiseuille flow [18] and was applied recently using LES in the lattice Boltzmann framework [22, 20]. While the standard BGK scheme computes the fluid density ρ and momentum ρu as the moments of the distribution function f(x, t) the incompressible model computes the sum of the distribution function that represents small perturbations about a reference density ρ0 = O(1). The macroscopic density perturbations and the macroscopic velocity are then given by,
| (4) |
| (5) |
where αmax equals the number of lattice sites depending on the lattice model chosen. For example, αmax equals 18 for D3Q19 model and takes a value of 26 for the D3Q27 model. The incompressible BGK scheme reduces significantly the intensity of numerical pressure wave [22] and was used previously for simulating turbulent flows using LBM [20, 22]. The equilibrium distribution function is defined as a function of the macroscopic quantities ρ0, δρ and u as follows:
| (6) |
Following a standard trapezoidal time-space integration and change of variables [39][19], we finally obtain the fully-discretized lattice Boltzmann equation:
| (7) |
Next, we present the types of lattice models evaluated in the present work.
2.2. 3D lattice models
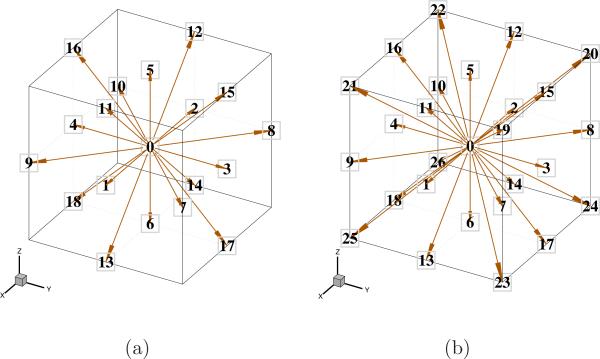
Two lattice models are considered in the present study, namely, D3Q19 and D3Q27, which have 19 and 27 velocity links respectively inside a cubic lattice. The lattice types are shown plotted in Fig. 1. The velocity set eα and the corresponding weights ωα, where α = {0, 1, ..., 18} for the D3Q19 model are defined as:
| (8) |
| (9) |
and for the D3Q27 model, where α = {0, 1, ..., 26} are defined as:
| (10) |
| (11) |
where the lattice speed after space-time discretization.
Figure 1.
Two lattice types considered in the present study (a) D3Q19 model (b) D3Q27 model.
2.3. Large eddy simulation
As the present work involves a large parameter space containing the depth aspect ratio k = 1, 2, 3 and a possible Reynolds number range to search for 1000 – 3000 to within O(102) interval, it is important that an upper limit on the mesh size be kept so that results can be obtained in a reasonable amount of time. To accomplish this, we resort to LES modeling approach, in which the large scales are directly resolved while the effect of the small sub grid scales (SGS) on the large scales is modeled. The classical Smagorinsky model [38] is used as the SGS model that directly operates on the local distribution functions in its implementation. In LES, we write the filtered lattice Boltzmann equations with BGK collision operator as:
| (12) |
where f̄α and represents the filtered distribution functions and equilibrium. The formulation of the above equation is almost the same as Eq. 7 except for the relaxation time. The original microscopic relaxation time τ is now replaced with total relaxation time τ* in this equation. Similar to the definition of τ, in Eq. 7, the total relaxation time is defined to include the effect of eddy viscosity νt, as:
| (13) |
where the eddy relaxation time τt is related to the eddy viscosity νt as:
| (14) |
We are now left with modeling of the eddy viscosity νt. In the SGS models, the turbulent stress is written as:
| (15) |
where Δ is the filter width and S̄ij is the filtered strain rate tensor, given by:
| (16) |
The eddy viscosity can be represented in the Smagorinsky model as:
| (17) |
where is the local filtered strain rate magnitude. Now that the eddy viscosity is related to the filtered strain rate magnitude, we present here how the second order tensor (S̄ij in case of Smagorinsky model), is computed. In LBM, the filtered strain rate tensor S̄ij can be directly computed from the second-order moments of the filtered non-equilibrium distribution functions as:
| (18) |
where the filtered momentum flux Q̄ij is defined:
| (19) |
Another way to compute S̄ij is to use a traditional central difference scheme based on the macroscopic velocity u. Yu et al. [45] showed that the former method generates more accurate and stable results. In this study, we adopt the first method for the calculating S̄ij. The total relaxation time τ* for Smagorinsky model can be written as:
| (20) |
where Csmag is the Smagorinsky constant which in the present work is taken to be equal to 0.1 and cs is the speed of sound, ρ = ρ0 + δρ. For every time step of LBM calculation, Eq. 20 is applied after the streaming and boundary condition process to adjust the total relaxation time τ* for collision process.
2.4. Boundary conditions
A stationary wall boundary condition is applied on all walls of the cavity except the top lid on which a moving wall boundary condition is applied. The stationary wall boundary condition in which ū = v̄ = w̄ = 0 is set through a simple node bounce back of the distribution function as follows:
| (21) |
where asterisk on the distribution function indicates those distribution functions which are pointing into the fluid domain from the wall and the one without asterisk is the corresponding pairing link depending on the lattice type. The node bounce back boundary condition for moving wall is derived by Bouzidi et al. [6]. This is used in updating the distribution functions pointing into the fluid domain as follows:
| (22) |
where ulid = (ū(x, kL, z), 0, 0) is the regularized velocity boundary condition imposed on the top lid of the cavity.
3. Results
3.1. Geometry and flow conditions
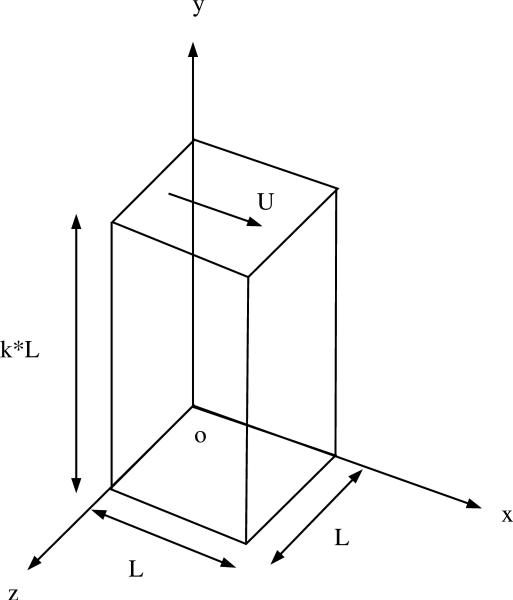
A schematic of generic lid driven cavity is shown in Fig. 2. All the walls of the cavity are stationary except the top wall which moves with a velocity (ū, 0, 0) as shown in the figure. A regularized velocity boundary condition [23, 36, 35] is applied on the top wall of the cavity with the distribution given by,
| (23) |
where U is the maximum velocity of the top wall, L is the width of the cavity with square cross section and k is depth aspect ratio factor. The Reynolds number that characterizes the flow can by defined as,
| (24) |
where U0 and ν0 are physical macroscopic velocity and kinematic viscosity, the depth aspect ratio of the cavity is given by the value k and each side of the cavity measure L = 2 units. A physical time is defined relating the number of collision/streaming time steps, lattice lid velocity and the number of grid points in the x direction as follows:
| (25) |
where Nt is the number of time steps, Nx is number of mesh points in x direction. Next, we move to validating the developed solver by comparing the results obtained to existing data in the literature at couple of Reynolds numbers.
Figure 2.
Schematic of lid driven cavity in three-dimensions. L is the width of the side of the cavity and k denotes the depth aspect ratio of the cavity. All the walls of the cavity are stationary except the top wall which moves with a velocity of (ū, 0, 0). Origin is denoted by o and the width of the cavity is taken as L = 2 in the present simulations.
3.2. Validation of solver for flow in a cubic cavity
Our in-house LBM solver (hereafter referred as LABLES), is first validated by simulating a cubic cavity case at Reynolds numbers of 1000 and 12000 and by comparing them to the available data in the literature. Simulation results obtained by Wu and Shu [44] are used for making comparisons in the case of 1000 Reynolds number, whereas the direct numerical simulation (DNS) data of Leriche et al. [23] is used for the 12000 case. In the process of validating the LABLES solver we select an optimum grid size and lattice type to be used for further deep lid driven cavity studies.
3.2.1. Selection of grid size and lattice type
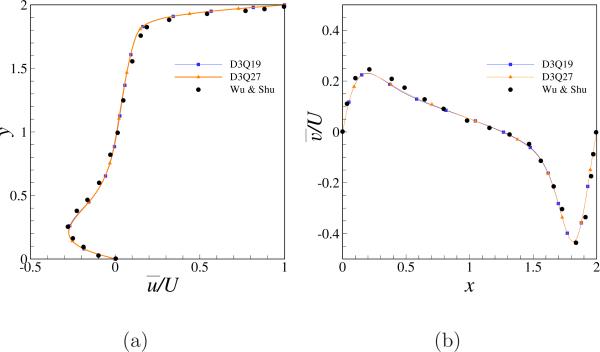
In this section, we present the grid sensitivity and lattice type selection studies that are carried out to come up with an optimum mesh size that resolves the mean and turbulence statistics accurately and at the same time not computationally expensive. In the cubic cavity case (k = 1), the grid size in each direction is set equal. First, we consider cubic cavity case at a Reynolds number of 1000. The profiles of mean velocity on the bisecting plane at z = 1 are shown plotted in Fig. 3 for two lattice types. A mesh size of 803 is used for both the simulations and the results obtained by Wu & Shu [44] are also shown plotted. The variation of ū/U along y at x = 1 and variation of v̄/U as a function of x at y = 1 are shown plotted in frames (a) and (b) of the figure respectively. A good match with the results of Wu & Shu [44] is obtained and the effect of lattice types on the simulation result is not readily noticeable from these results. Although the Reynolds number is only 1000, LES modeling is still used to validate and come up with a consistent framework to perform steady-oscillatory transition studies. As both lattice types result in very close agreement with the existing results from literature, this test only serves to establish the mesh size as 803 together with the LES model to perform simulation in the Reynolds number of the order of O(103).
Figure 3.
Profiles of mean velocity extracted on the bisecting plane at z = 1 at a Reynolds number of 1000, for indicated lattice type. (a) Variation of filtered u velocity (ū/U) along y-axis (b) Variation of filtered v velocity (v̄/U) along x-axis.
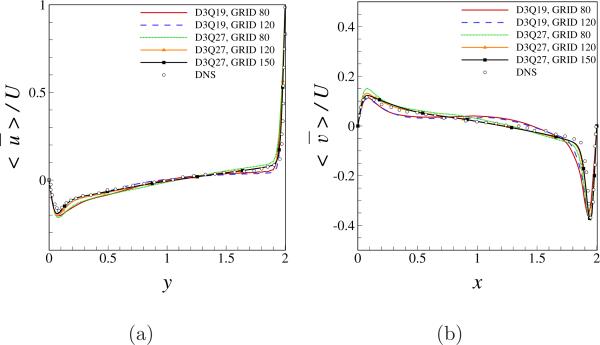
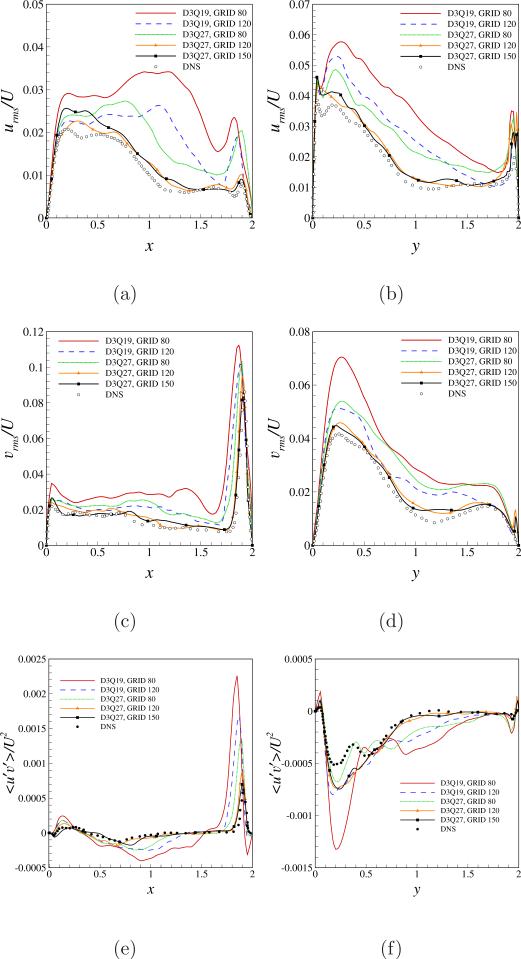
Next, we consider flow in a cubic driven cavity at a Reynolds number of 12000 for which there exist DNS results in the literature [23]. Three grid size of 803, 1203 and 1503 are considered. Also, two lattice types as in the previous simulation, D3Q19 and D3Q27 are used in order to evaluate the best lattice type for further simulations. All the simulations are run on 125 processors, for 15 × 105 numerical time steps and turbulent statistics are collected over the last 10 × 105 time steps. Mean velocity and turbulent statistics extracted on the bisecting plane at z = 1 are shown plotted in Fig. 4. Frames (a) and (b) in the figure show the variation of time averaged, filtered velocities along the lines indicated. From the frame (a) of the Fig. 4, it can be noted that, mean u velocity profiles are slightly off close to the bottom and the top wall regions for both lattice types at a grid size of 80. Lattice type D3Q19 shows a closely matching result for 120 grid size for most of the region except close to the top wall regions (1.5 ≤ y ≤ 2.0). Lattice type D3Q27, shows very good match with the DNS results for both 120 and 150 grid sizes. Similar observations can be made from the mean v velocity profiles shown in the frame (b) of the figure, with D3Q27 on grid sizes 120 and 150 giving comparatively better match with the DNS data. Overall, a good match with the DNS results is observed from the mean velocity profiles and the results obtained with 803 mesh size and D3Q19 lattice type show more deviation from the remaining results.
Figure 4.
Profiles of mean velocity extracted on the bisecting plane at z = 1 at a Reynolds number of 12000, for indicated lattice type and mesh sizes. (a) Variation of time averaged, filtered u velocity (< ū > /U) along y-axis (b) Variation of time averaged, filtered v velocity (< v̄ > /U) along x-axis.
Variation of root mean square (rms) quantities of fluctuations and one component of Reynolds stress (< u′ v′ > /U2)are shown plotted in Fig. 5. Frames (a) and (b) denote the variation of urms/U, frames (c) and (d) depict variation of vrms/U and Reynolds stress < u′ v′ > /U2 profiles are shown plotted in frames (e) and (f). Each plot also contains the results obtained from the DNS by Leriche et al. [23]. The performance of the grid size and lattice type can be better gauged from the turbulent statistics profiles shown in frames (a) through (f) in Fig. 5. Profiles of urms and vrms plotted along x and y lines on the central bisecting plane z = 1 clearly show that D3Q27 lattice type accurately captures urms and vrms profiles on grid sizes 1203 and 1503. Similarly, the Reynolds stress profiles show a good match with D3Q27 lattice type with mesh sizes of 1203 and 1503. The other mesh sizes and lattice type D3Q19 although show qualitatively similar profiles the peak values obtained close to the right wall at 1.5 ≤ x ≤ 2 and close to the bottom wall 0 ≤ y ≤ 0.5 are relatively large when compared to the DNS data.
Figure 5.
Profiles of turbulent statistics extracted on the bisecting plane at z = 1 at a Reynolds number of 12000, for indicated lattice type and mesh sizes. (a) Variation of urms/U along x-axis (b) Variation of urms/U along y-axis (c) Variation of vrms/U along x-axis (d) Variation of vrms/U along y-axis (e) Variation of < u′ v′ > /U2 along x-axis (f) Variation of < u′ v′ > /U2 along y-axis.
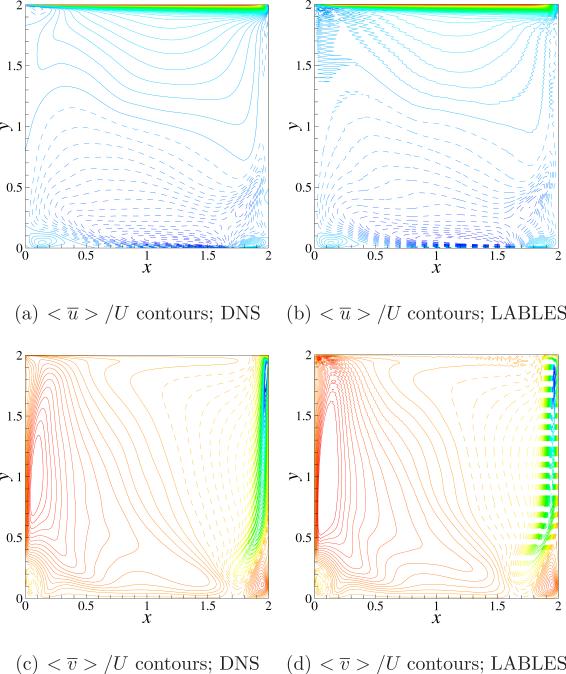
In addition to the profile comparisons performed above we also compare the contours of time averaged mean velocity on the z = 1 plane. The contours of < ū > /U and < v̄ > /U obtained from the present simulation are shown plotted in the right column (frames (b) and (d)) of Fig. 6 and the corresponding contours obtained by Leriche et al. [23] are shown plotted in the left column (frames (a) and (c)). Both the plots capture the corner vortices at the bottom of the cavity and the contour levels seem to be closely similar to the DNS results specifically in the lower three quarters of the cavity depth. In the upper quarter of the cavity there seem to be pressure fluctuations originating from the corners of the lid and extending into some portion of the cavity. These fluctuations may be avoided by incorporating a fine grid at these corner locations. With these two validation cases representing an order of magnitude different Reynolds numbers, we select a mesh size of 803 when the Reynolds number is in the order of O(103) and a mesh size of 1203 when the order is O(104) for all the further studies together with the LES model being active to limit the mesh size. The identification of steady-oscillatory involves a thorough search process and a parallel scaling study of LABLES code would provide insights into the efficiency of the solver, serves as a guide in choosing the number of processors and further can bolster the feasibility of the present study. Therefore, in the next section we evaluate the parallel performance of the present solver by considering two different mesh sizes.
Figure 6.
Comparison of mean velocity contours between the present simulation results obtained using LABLES and the DNS data of Leriche et al. [23] at a Reynolds number of 12000 on the bisecting plane at z = 1. (a) Contours of < ū > /U from DNS, 100 equally spaced contour levels are shown plotted between –0.2 to 1.0. (b) Contours of < ū > /U from LABLES (c) Contours of < v̄ > /U from DNS, 100 equally spaced contour levels are shown plotted between –0.6 to 0.1. (d) Contours of < v̄ > /U from LABLES.
3.2.2. Parallel performance of the solver
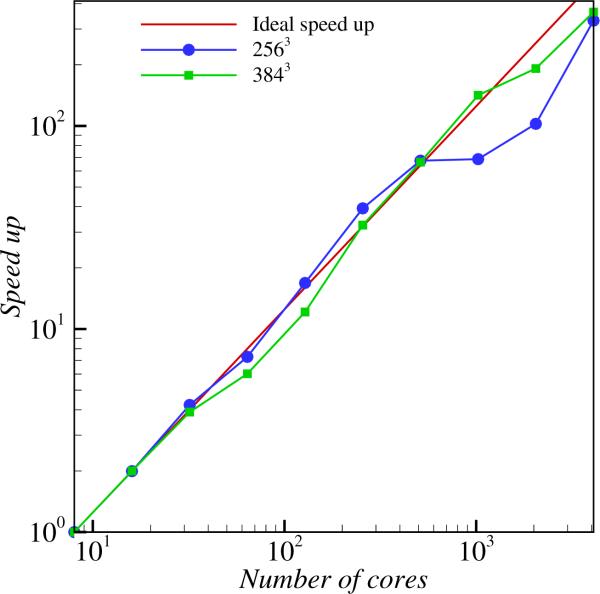
LABLES is parallelized using Message Passing Interface (MPI), in order to be able to run on a large number of processors. The parallel performance of the solver is evaluated by choosing the cubic cavity case and by varying the number of processors for several mesh sizes. For all the tests three dimensional decomposition of the domain is used. Parallel performance of LABLES code is measured by considering two different grid size cases. A mesh of approximately 16 million grid points (256 grid points in each direction) and further a fine mesh of approximately 56 million grid points (384 points in each direction) are run for a sample of 100 time steps to measure the time taken by the solver. The Reynolds number of the flow is fixed at 12000 and the processor count is varied starting from 8 (2 processors in each direction) to 4096 (16 processors in each direction). A plot of ideal speedup and the actual speedup obtained by LABLES code for each of the mesh sizes are shown plotted in Fig. 7. The time taken by the 8 processor case is used as the basis to calculate the speedup. As can be seen from this figure for the 2563 case close to linear speedup is obtained in the processor range of 8 to 64, whereas super linear speedup is noted in the processor range of 128 to 512. Further increase of processor count results in sudden drop of speedup curve at processor counts of 1024 and 2048 and then recovers back to a better speedup curve at a processor count of 4096. In the 3843 case, close to linear speedup is obtained up till a processor count of 1024. Similar to the 2563 case the speedup curve shows a dip upon increase of further processor count till 4096. The early degradation of speedup curve in the smaller grid size case could be because of the dominance of the communication time over the computation time taken per processor at large processor counts. The results from parallel scaling test thus establishes that LABLES can be used to obtain results in an appropriate time frame when run on a large number of processors depending on the problem size. Details about the number of processors used in identifying steady-oscillatory transition Reynolds number simulations are presented here. All the cubic cavity and deep lid driven cavity with k = 2 simulations are run on 125 processors (5 processors in each direction), where as deep lid driven cavity cases with k = 3 are run on 375 processors (5 processors each in x and z directions and 15 processors in y direction). The parallel cluster contained 48 GB RAM per node and two 2.1 GHz 12-core AMD Opteron 6172 processor making it a total of 24 cores per node. All the nodes of the cluster are connected through a 10 Gigabit Ethernet interconnect. The typical CPU time required to simulate 106 time steps is 4 hours on 125 processors for the cubic cavity case at an given Reynolds number. All the studies discussed in the next section to identify the transition Reynolds number are run till 20 × 106 time steps. The validation studies performed in this section enabled us to select the mesh size and lattice type whereas the parallel scaling study proved the feasibility of applying the present solver, with this we now move onto identifying the steady-oscillatory transition Reynolds number in the lid driven cavities with depth aspect ratios equal to 1, 2 and 3.
Figure 7.
Parallel performance of LABLES code on two grid sizes of 2563 and 3843.
3.3. Study of oscillatory instability
In this section, we perform several simulations to identify the steady-oscillatory transition in the lid driven cavity with aspect ratios 1, 2 and 3. In order to ascertain the transition from steady to oscillatory nature of the three-dimensional flow field instantaneous velocity magnitude is monitored continuously from the beginning of the simulation. An amplitude coefficient of instantaneous velocity magnitude is defined as follows:
| (26) |
where umax and umin correspond to maximum and minimum values attained by umag(t) in one periodic cycle. This amplitude coefficient enables us to determine whether the flow in the cavity is steady or not. A value of Camp greater than 10–6 is taken as oscillatory in the present work. Depending on the depth aspect ratio of the cavity, a set of probes are continuously monitored for the evolution of velocity magnitude (umag) in the lid driven cavity. The probe locations are listed in the Table 1. The probes are primarily located on two parallel planes one on the mid plane z = 1 and the other set on a plane located at z = 0.5.
Table 1.
Location of several probes (x, y, and z coordinates) used to monitor the evolution of instantaneous velocity magnitude in the driven cavity with side of length L and depth kL with k = 1, 2, 3 depending on the cavity considered. The location of the origin of the domain can be found in the schematic shown in Fig. 2.
| Probe (x, y, z) | Probe (x, y, z) |
|---|---|
| P1 (L/8, 13L/16, L/4) | P2 (L/8, 13L/16, L/2) |
| P3 (L/8, 13L/8, L/4) | P4 (L/8, 13L/8, L/2) |
| P5 (L/8, 39L/16, L/4) | P6 (L/8, 39L/16, L/2) |
First, we consider the cubic cavity case and perform several simulations with varying Reynolds numbers to locate the steady-oscillatory transition. Results obtained from a set of Reynolds numbers equal to 2100, 2250, 2300 and 2350 are only discussed here. A mesh size of 803 together with the LES model is used for all the simulations owing to the order of magnitude of the Reynolds number range considered. The time history of velocity magnitude measured at probe P1 is shown plotted in Fig. 8(a) for the indicated Reynolds numbers. The profiles are offset by 0.01 for clarity in visualization in frame (a) whereas an enlarged view of part of the time history is shown plotted in frame (b) of the same figure. The amplitude coefficient computed for each of the time history profiles is shown in Table 2. From this table, we note that the amplitude coefficient jumps to O(10–4) when the Reynolds number is increased to 2250 whereas it is only of the order of O(10–8) at 2100. This indicates that the steady-oscillatory Reynolds number for the cubic cavity case lies in the range of 2100 to 2250. This value is approximately 10 to 17 percent higher than the recently reported sub-critical Hopf bifurcation Reynolds number of 1914 by Feldman & Gelfgat [11] and Liberzon et al. [24]. From Fig. 8, we notice that for Reynolds numbers 2100, 2250 and 2300 the initial transients decay by t = 1000, however, long time small amplitude oscillations shown up in the cases 2250 and 2300 as can be seen in frame (b) of the Fig. 8. The Reynolds number of 2350 case shows consistent periodic oscillations throughout. Hence, we can see that all the three cases starting from 2250 show oscillatory flow field, however a close look at the two dimensional flow field reveals interesting results in how these oscillatory cases differ in what follows.
Figure 8.

(a) Time history of velocity magnitude measured at P1 at indicated Reynolds numbers for a cavity depth aspect ratio k = 1. The profiles at each Reynolds number value are shown offset by a value of 0.01 for clarity. (b) An enlarged view of frame (a), with no offset, over the indicated time period.
Table 2.
Variation of instantaneous amplitude coefficient with Reynolds number at indicated cavity depth aspect ratios. The limits of Reynolds number over which oscillatory instability occurs is identified with an asterisk in the superscript on the Reynolds number value.
| k = 1 | Re | 2100* | 2250* | 2300 | 2350 |
| Grid = 80 × 80 × 80 | Camp | 1.0e - 08 | 4.8e - 04 | 4.8e - 03 | 3.8e - 01 |
| k = 2 | Re | 1300* | 1450* | 1550 | - |
| Grid = 80 × 160 × 80 | Camp | 1.0e - 08 | 5.0e - 02 | 8.5e - 02 | - |
| k = 3 | Re | 1200* | 1300* | 1400 | 1500 |
| Grid = 80 × 240 × 80 | Camp | 1.0e - 08 | 5.6e - 03 | 4.0e - 01 | 5.7e - 01 |
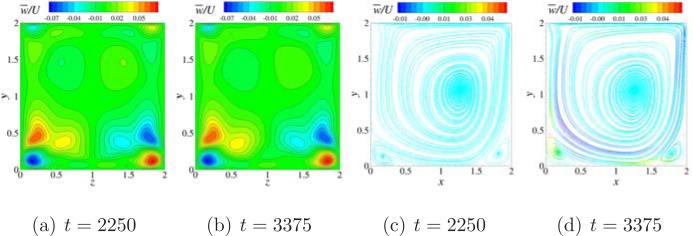
The instantaneous contours of w̄/U on x = 1 plane and instantaneous streamlines colored by w̄/U on z = 1 plane are shown plotted in Fig. 9 for the cubic lid driven cavity case at a Reynolds number of 2250. Frames (a) and (b) depict w̄/U contours at two time instants of t = 2250 and t = 3375 respectively. Frames (c) and (d) depict the streamlines at the same time instants on z = 1 plane. At a time of t = 2250 the oscillations are decaying and thus we can observe an anti-symmetric flow field on the x = 1 plane as seen in frame (a) where the contours are anti-symmetric about z = 1 line. The same phenomenon can be seen in frame (c) which shows there is no flow crossing the z = 1 plane as shown by the color of the streamlines. At a later time, however, the flow field starts developing small but consistent periodic oscillations as can be seen from Fig. 8(a) and (b). To visualize these small oscillations that persist in the cubic cavity case at Re = 2250 we plot instantaneous contours of w̄/U and streamlines in frames (b) and (d) of Fig. 9 at a time of t = 3375. From frame (b) we see that the contours are not antisymmetric about z = 1 as was the case at t = 2250. Also, the streamline plot shown in frame (d) confirms the cross flow all along the walls except the top wall and the central cavity region where the cross flow magnitude is small.
Figure 9.
Contours of w̄/U and streamlines for the cubic lid driven cavity case at Re = 2250. (a) Contours of w̄/U on x = 1 plane at t = 2250 (b) Contours of w̄/U on x = 1 plane at t = 3375 (c) Streamlines colored by w̄/U on z = 1 plane at t = 2250 (d) Streamlines colored by w̄/U on z = 1 plane at t = 3375.
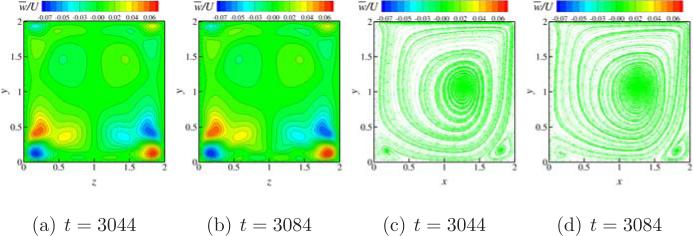
Next, we turn our focus to look at the instantaneous contours of w̄/U on x = 1 plane and instantaneous streamlines colored by w̄/U on z = 1 plane at a Reynolds number of 2350 in the cubic cavity case. These are shown plotted in Fig. 10. Two instants t = 3044 and t = 3084 are considered for analyzing this case, as they are the locations at which the instantaneous velocity magnitude reaches a maximum and a minimum value respectively in the periodic solution. As can be seen from frames (a) and (b) the contours of w̄/U are anti-symmetric at the two time instants about z = 1 line on the x = 1 plane. The streamlines shown plotted in frames (c) and (d) also confirm the same with no flow crossing the z = 1 plane, as depicted by their color. The oscillations seen in the umag/U time history plots in Fig. 8 hence are anti-symmetry preserving throughout the time range considered in the present simulations. The primary eddy and the two corner eddies seem to be preserving their shape during the oscillations with small changes in their locations giving rise to periodic oscillations as noticed from Fig. 8 and Fig. 10(c) and (d).
Figure 10.
Contours of w̄/U and streamlines for the cubic lid driven cavity case at Re = 2350. (a) Contours of w̄/U on x = 1 plane at t = 3044 (b) Contours of w̄/U on x = 1 plane at t = 3084 (c) Streamlines colored by w̄/U on z = 1 plane at t = 3044 (d) Streamlines colored by w̄/U on z = 1 plane at t = 3084.
Hence, from the simulation of cubic driven cavity we observe that, a steady flow field is obtained at a Reynolds number of 2100, whereas anti-symmetry breaking oscillations about z = 1 plane are obtained during later times of the simulation at Reynolds numbers 2250 and 2300. Upon further increase of the Reynolds number to a value of 2350 sustained periodic oscillations with anti-symmetry preserving about z = 1 plane are noticed. Previously, Feldman & Gelfgat [11] and Liberzon et al. [24] also reported anti-symmetry breaking sub-critical instability at a Reynolds number of 1914 as is observed in the present simulations. In addition to this behavior we also observe, anti-symmetry restoring periodic oscillations at higher Reynolds numbers which is a new insight gained from the present work.
By increasing the cavity depth aspect ratio from k = 1 to k = 2, we generate a deep lid driven cavity case. A mesh size of 80 × 160 × 80 is used together with the LES model to investigate the steady-oscillatory transition behavior in this case. The time history of velocity magnitude recorded at probe P 2 is shown plotted in Fig. 11. Frame (a) of the figure shows the entire time history simulated, each case offset by 0.01 for clarity in visualization, whereas frame (b) only brings out a small portion of t = 2900 to 3100 with no offset so that even the smallest oscillations can be better visualized. As can be seen from Fig. 11, at a Reynolds number of 1300 the flow is steady with Camp of the order of 10–8 as shown in Table 2, whereas sustained oscillations can be seen after t = 1500 in the case of Re = 1450 and a change in type of oscillations is noticed at around t = 1400 in the case of Re = 1550. Unlike the Re = 1450 case the oscillations do not decay in the initial times of the solution in the case of Re = 1550. From these time history plots, we can conclude that the steady-oscillatory transition Reynolds number occurs between 1300 and 1450 in the case of deep lid driven cavity with k = 2. This Reynolds number is smaller by a value of 800 approximately, when compared with the cubic cavity case studied earlier. Also, it can be noted from frame (b) of Fig. 8 and Fig. 11 that the oscillations seen in the k = 2 case have higher harmonics than just one harmonic seen in the k = 1 case which is further discussed later in the frequency spectrum analysis carried out.
Figure 11.

(a) Time history of velocity magnitude measured at P2 at indicated Reynolds numbers for a cavity depth aspect ratio k = 2. The profiles at each Reynolds number value are shown offset by a value of 0.01 for clarity. (b) An enlarged view of frame (a), without offset, over the indicated time period.
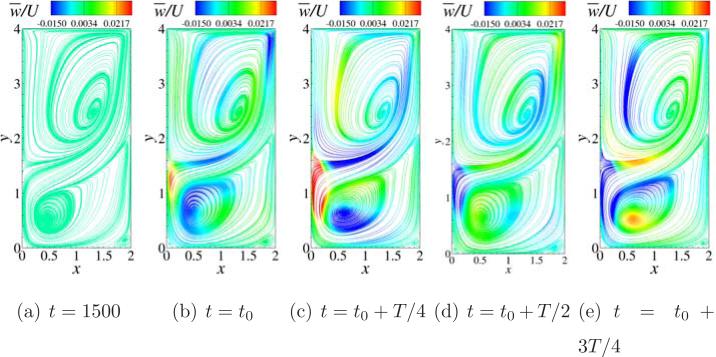
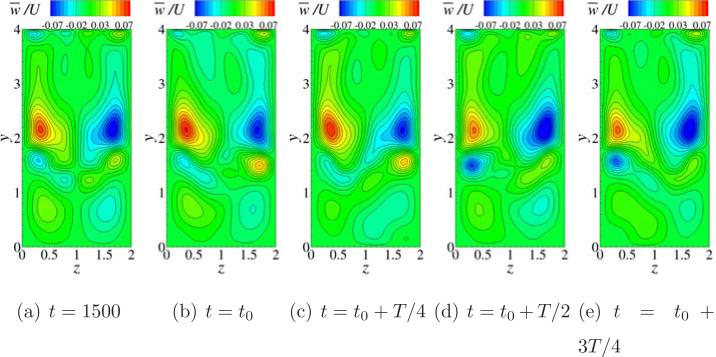
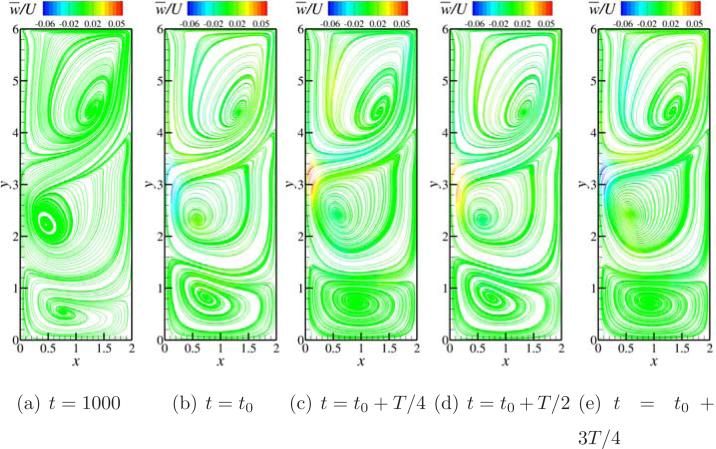
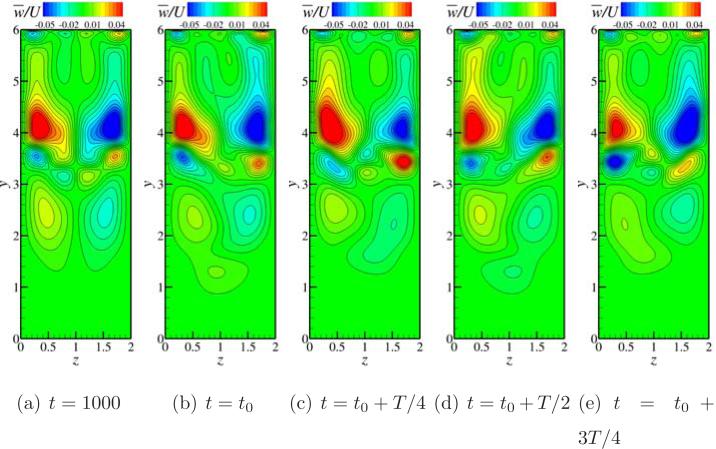
To further understand the type of oscillations occurring in the deep lid driven cavity case with k = 2, we turn our focus to look at the streamlines and contours of w̄/U on z = 1 plane and x = 1 plane respectively. The in-plane instantaneous streamlines (generated using u and v velocity components) are shown plotted in Fig. 12 colored by w̄/U at indicated times for a Reynolds number of 1450. Frame (a) indicates the streamlines at a time of t = 800 at which time we can see from Fig. 11(a) that the initial oscillations have damped out. As seen in the Fig. 12(a) there is no cross flow depicted by the color of the streamlines. Next, we sample one time period (T ≈ 70) of the oscillations that start developing past t = 1500 as seen in the Fig. 11(a) and (b) into 4 equal times and starting with the initial time these are shown plotted in frames (b), (c), (d) and (e) of Fig. 12 which correspond to times t0, t0 + T/4, t0 + T/2 and t0 + 3T/4 respectively. As can be seen from these frames, the overall global structure of the streamlines remains similar with small changes in the location of the two primary eddies, with cross flow across the z = 1 plane as shown by the color of the streamlines. This is a result of the anti-symmetry breaking along the z = 1 plane. To support this observation, we plot contours of w̄/U on the x = 1 plane in Fig. 13 at the same time instants as considered in Fig. 12. From Fig. 13, we can see that at time t = 800 although anti-symmetric contours of w̄/U are observed, they loose anti-symmetric behavior once the periodic oscillations start developing beyond t = 1500 as seen in the frames (b) through (e). This behavior is similar to that observed in the cubic lid driven cavity case at Reynolds numbers of 2250 and 2300, however, in the deep cavity case with k = 2 it is seen as early as Re = 1450.
Figure 12.
In plane streamlines generated using u and v velocity components and colored by w component of velocity on the z = 1 plane at the indicated time instants for deep lid driven cavity with k = 2 and at a Reynolds number of 1450. The starting time t0 = 2255 and the time period of the oscillations is measured to be T ≈ 70.
Figure 13.
Contours of w̄/U on x = 1 plane at indicated times for deep lid driven cavity with k = 2 and at a Reynolds number of 1450. The starting time is t0 = 2255 and the time period of the oscillations is measured to be T ≈ 70.
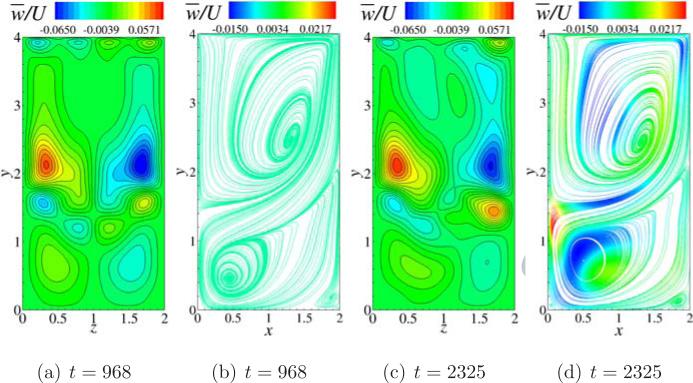
As we increase the Reynolds number to 1550 in the k = 2 case, we see similar long time behavior as Re = 1450 case, however, there are more harmonics in the oscillations that are noted as shown in the frame (b) of the Fig. 11, also the initial oscillations do not damp out rather consistent oscillations that get transformed into anti-symmetry breaking oscillations at a time of t = 1400 are seen as shown in the frame (a) of Fig. 11. In order to support this observation, we further plot streamlines on z = 1 plane and contours of w̄/U on the x = 1 plane at two time instants, t = 968 that lies in the initial oscillations region and t = 2325 that lies in the transformed oscillations with higher harmonics, in Fig. 14. As seen in frames (a) and (b) the oscillations maintain anti-symmetric w̄/U contours about z = 1 line on x = 1 plane and the streamlines show that there is no cross flow through their color coding. However, the frames (c) and (d) denote that the antisymmetric w̄/U contours is not preserved anymore at t = 2325 and the streamlines also indicate cross flow that is occurring. Like in the cubic cavity case (Re = 2350), whether there exists a Reynolds number that shows antisymmetry preserving periodic oscillations is not further investigated in the deep lid driven cavity cases.
Figure 14.
Deep lid driven cavity with k = 2 at a Reynolds number of 1550. (a) Contours of w̄/U on x plane at a time t = 968 (b) Contours of w̄/U on x plane at a time t = 2325 (c) Streamlines colored by w̄/U on z plane at time t = 968 (d) Streamlines colored by w̄/U on z plane at time t = 2325.
In order to comment on the correlation between the depth of the cavity and the steady-oscillatory transition Reynolds number, we consider another deep cavity case with k = 3 as that would make it three data points to observe the trend. We consider a mesh size of 80 × 240 × 80 together with the LES model. The time history of velocity magnitude umag/U recorded at the probe location P 3 is shown plotted at indicated Reynolds numbers in Fig. 15. As can be seen from this figure, at a Reynolds number of 1200 the flow is steady and the amplitude coefficient is very small of the order of O(10–8), at a Reynolds number of 1300 although the initial transient oscillations decay quickly there exist small oscillations at later times and this is confirmed through the amplitude coefficient which has a value of 5.6e – 03. At higher Reynolds numbers of 1400 and 1500 we see consistent periodic oscillations in the later part of the time history. A closer look at the periodic oscillations can be seen in frame (b) of the Fig. 15. From these profiles and the values of Camp we can comment that the steady-oscillatory transition Reynolds number lies between 1200 and 1300 for the deep cavity case with k = 3. This value is 100 smaller than the Reynolds number value noted for the deep cavity case with k = 2.
Figure 15.

(a) Time history of velocity magnitude measured at P3 at indicated Reynolds numbers for a cavity depth aspect ratio k = 3. The profiles at each Reynolds number value are shown offset by a value of 0.04 for clarity. (b) An enlarged view of frame (a), without offset, over the indicated time period.
In order to further characterize the oscillation behavior, we identify few instantaneous locations and plot streamlines and contours of w̄/U on z = 1 and x = 1 planes as shown in Fig. 16 and Fig. 17 at a Reynolds number of 1500. At a time of t = 1000 large periodic oscillations have not yet started in the case of Re = 1500 and from frame (a) of Fig. 15 only small periodic oscillations can be noted. These oscillations are anti-symmetry preserving as confirmed from frames (a) of Fig. 16 and Fig. 17. The streamlines show no cross flow and the contours of w̄/U are anti-symmetric about z = 1 line on the x = 1 plane. Next we identify four instants equally distributed in one time period (T ≈ 50) starting at a time of t0 = 2255. The corresponding streamlines and w̄/U contours are shown plotted in frames (b) through (e) in Figs. 16 and 17. These contours and color coding of streamlines supports the idea that sustained long time periodic oscillations observed at a Reynolds number 1500 are indeed anti-symmetry breaking. Unlike the deep cavity with k = 2, in the present case, the cross flow oscillations are limited to the upper lid region 1 ≤ y ≤ 6 and the bottom most eddy is free of any cross flow as can be seen from frames (b) through (e) in Fig. 16. The same can also be noted from the w̄/U contour plots in frames (b) through (e) in Fig. 17.
Figure 16.
In plane streamlines generated using u and v velocity components and colored by w component of velocity on z = 1 plane at the indicated time instants at a Reynolds number of 1500. The starting time t0 = 2255 and the time period of the oscillations is measured to be T ≈ 50.
Figure 17.
Contours of w-component of velocity on x = 1 plane at indicated times at a Reynolds number of 1500. The starting time t0 = 2255 and the time period of the oscillations is measured to be T = 50.
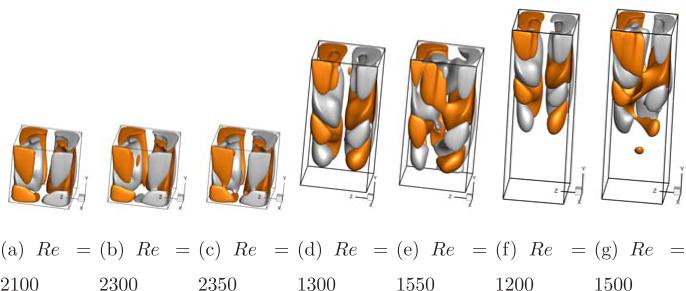
In order to clearly visualize and appreciate the anti-symmetry preserving and breaking phenomenon in the several lid driven cavities studied in the present work at steady and oscillatory Reynolds numbers we plot iso-surfaces of w̄/U = ±0.01 in Fig. 18. Frames (a), (b) and (c) show the cubic lid driven cavity case at 2100, 2300 and 2350 Reynolds numbers respectively. Steady flow field with anti-symmetric w̄/U iso-surfaces about z = 1 plane are observed in frame (a) at a Reynolds number of 2100. The anti-symmetry breaking oscillations seen at 2300 can be observed in frame (b) with the iso-surfaces crossing z = 1 plane from each side, whereas the restoration of anti-symmetric fields at 2350 is noted as noted before in frame (c). Similarly for deep cavities with k = 2 and k = 3 steady flow fields with anti-symmetric w̄/U iso-surfaces are seen in frames (d) and (f) at Reynolds numbers of 1300 and 1200 respectively. The anti-symmetry breaking oscillations as evidenced by iso-surfaces crossing z = 1 plane from either side can be seen in frames (e) and (g) for the deep cavities with k = 2 and k = 3 at Reynolds numbers 1550 and 1500 respectively.
Figure 18.
Instantaneous iso-surfaces of w̄/U = 0.01 and w̄/U = –0.01 at the indicated Reynolds number for k = 1 in (a), (b) and (c), k = 2 in (d) and (e), k = 3 in (f) and (g).
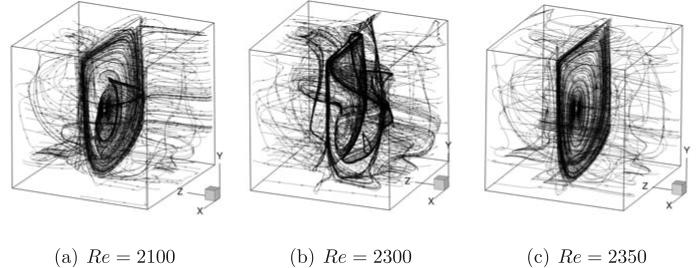
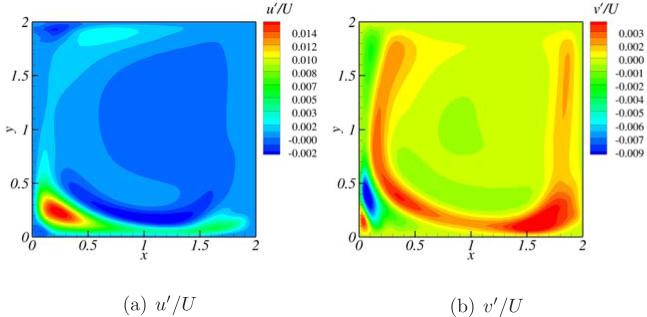
To examine the anti-symmetry and its breaking in the case of cubic cavity (k = 1) the streamlines corresponding to instantaneous flow field are shown for Reynolds numbers 2100, 2300 and 2350 in frames (a), (b) and (c) respectively of Fig. 19. From this figure we note anti-symmetric flow field for Re = 2100 and Re = 2350 whereas symmetry breaking flow field is noticed at Re = 2300. The spatial patterns of oscillation amplitude are shown in Fig. 20 to gain insight into the distribution of velocity fluctuations. Frames (a) and (b) of this figure represent normalized instantaneous u and v velocity fluctuations at a time instant when the velocity magnitude measured at P1 reaches a maximum value for Re = 2350 and k = 1. These spatial patterns are qualitatively similar to those reported in the literature by Liberzon et al. [24] at a Reynolds number of Re = 1970. Further differences such as the present oscillation amplitudes correspond to an instant where the velocity magnitude is maximum at P1 whereas in Liberzon et al. [24] maximum oscillation amplitudes for each of the velocity components are presented. Despite these differences the spatial distribution of oscillation amplitudes seem to be attaining maximum values close to the bottom corner regions similar to the experimental and numerical simulations in the literature [24].
Figure 19.
Streamlines for the cubic cavity case at the indicated Reynolds number.
Figure 20.
Contours of instantaneous velocity fluctuations at a time instant where umag reaches a maximum value of oscillation amplitude for a Re = 2350 and k = 1.
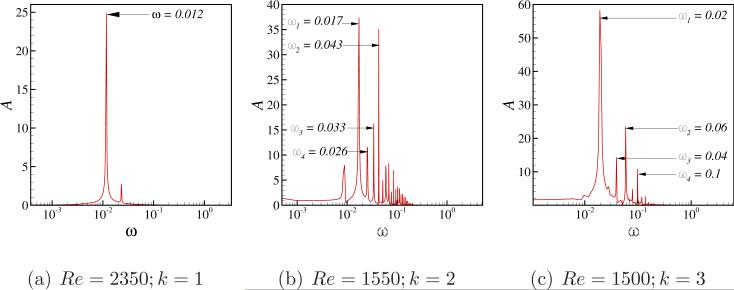
Finally, to characterize the oscillation frequencies occurring in cubic and deep lid driven cavities, we performed frequency analysis of the periodic oscillations. Frequency spectrum of the time-dependent velocity magnitude fluctuations for cavity depths k = 1, 2 and 3 at Reynolds numbers 2350, 1550 and 1500 respectively are shown plotted in frames (a), (b) and (c) of Fig. 21. From frame (a) we note that cubic cavity displays a single dominant frequency located at ω = 0.012 at a Reynolds number of 2350. Whereas, deep lid driven cavities display more harmonics and the first four of which are shown plotted in frames (b) and (c). From frames (b) and (c) we can see that when the cavity depth ratio is increased from k = 2 to k = 3 the first four dominant frequency modes seem to be increasing even at a lower oscillatory Reynolds number of 1500 in the case of k = 3 than 1550 in the case of k = 2. The deep lid driven cavities clearly show a signature of higher harmonics from the frequency spectrum plots in frames (b) and (c) in contrast to the cubic cavity which shows a single coherent frequency of oscillation centered at 0.012.
Figure 21.
Frequency spectrum of the oscillatory fields obtained for the indicated Reynolds numbers and cavity depths considered in the present study.
4. Discussion and summary
An in-house LBM solver, referred as LABLES, is developed with Smagorinsky SGS model for performing turbulence modeling using LES. The solver is parallelized using MPI and shows a close to linear speed up over a wide range of processor counts depending on the mesh size considered. LABLES is first validated by simulating flow in a cubic lid driven cavity at 1000 and 12000 Reynolds numbers by comparing the results obtained to the existing results in the literature. Good agreement with DNS results for both mean and turbulence statistics is obtained for the 12000 Reynolds number case and from the lattice types and mesh sizes considered a mesh of 803 is selected for Reynolds number simulations in the order of O(103) and a mesh size of 1203 is selected for simulations in the order of O(104) with D3Q27 as the lattice type together with the LES model to limit the mesh size to an optimum value.
The validated code is then applied to determine the steady-oscillatory transition Reynolds number in cubic and deep lid driven cavities with depth aspect ratios equal to 2 and 3. Consistent with the previous two-dimensional flow in lid driven cavities [25], it is noted that the transition Reynolds number is negatively correlated with the cavity depth in the present three-dimensional simulations. For the cubic cavity (k = 1), the transition Reynolds number lies in the range of 2100 to 2250, whereas it decreases to a range of 1300 to 1450 for the deep cavity with k = 2 and further down to 1200 to 1300 when the depth of the cavity is increased to k = 3. The cubic lid driven cavity exhibits interesting anti-symmetry breaking oscillatory flow fields at Reynolds numbers of 2250 and 2300, which gets restored to anti-symmetry preserving oscillatory flow fields at a Reynolds number of 2350. Search for such an anti-symmetry preserving oscillatory flow fields, if exist, in deep cavities is not performed in the present study. However, both the k = 2 and k = 3 deep cavity cases simulated in the present study depict anti-symmetry breaking oscillatory flow fields in the Reynolds number range considered. Both the deep cavity cases show a very long initial transient period after which the flow transforms itself into oscillatory or a steady flow field depending on the Reynolds number considered. The Reynolds number for steady-oscillatory transition obtained from the present simulations for cubic cavity case lies in the range of 10 to 17 percent to the Navier-Stokes based simulations and experimentally measured results obtained by Feldman & Gelfgat [11] and Liberzon et al. [24]. The use of regularized velocity boundary condition on the top lid as well as the presence of the LES model are thought to be reasons for obtaining a higher transition Reynolds number as compared to the ones reported in the literature [11, 24]. Frequency spectrum analysis shows that cubic cavity exhibits a single frequency of oscillations, whereas deep lid driven cavities show a signature of higher harmonics with the first four dominant frequencies increasing as the cavity depth is increased.
Highlights.
LBM solver is validated for Re = 1000 and 12000 in a lid driven cavity.
Steady-oscillatory transition Re negatively correlates with cavity depth in 3D.
Single and multiple frequencies are seen in cubic and deep cavities respectively.
Linear parallel speed up is obtained using the developed LBM solver.
Acknowledgments
KA is partially supported by National Institute of Health (NIH) Grant HL098353 and the same is acknowledged. The computational resources provided by Information Technology at Purdue University, West Lafayette, Indiana are greatly acknowledged. We would also like to thank Dr. Emmanuel Leriche, Université Jean-Monnet, France for providing us the data from the DNS database to make the comparisons. Further, the authors would like to acknowledge the comments and suggestions by the reviewers that improved the quality of the present paper.
Footnotes
Publisher's Disclaimer: This is a PDF file of an unedited manuscript that has been accepted for publication. As a service to our customers we are providing this early version of the manuscript. The manuscript will undergo copyediting, typesetting, and review of the resulting proof before it is published in its final citable form. Please note that during the production process errors may be discovered which could affect the content, and all legal disclaimers that apply to the journal pertain.
References
- 1.Abouhamza A, Pierre R. A neutral stability curve for incompressible flows in a rectangular driven cavity. Mathematical and Computer Modelling. 2003;38(1):141–157. [Google Scholar]
- 2.Albensoeder S, Kuhlmann H. Accurate three-dimensional lid-driven cavity flow. Journal of Computational Physics. 2005;206(2):536–558. [Google Scholar]
- 3.Auteri F, Parolini N, Quartapelle L. Numerical investigation on the stability of singular driven cavity flow. Journal of Computational Physics. 2002;183(1):1–25. [Google Scholar]
- 4.Bhatnagar PL, Gross EP, Krook M. A model for collision processes in gases. I. Small amplitude processes in charged and neutral one-component systems. Physical Review. 1954;94(3):511. [Google Scholar]
- 5.Botella O, Peyret R. Benchmark spectral results on the lid-driven cavity flow. Computers & Fluids. 1998;27(4):421–433. [Google Scholar]
- 6.Bouzidi M, Firdaouss M, Lallemand P. Momentum transfer of a Boltzmann-lattice fluid with boundaries. Physics of Fluids. 2001;13:3452. [Google Scholar]
- 7.Chen S, Doolen GD. Lattice Boltzmann method. Annuual Review of Fluid Mechanics. Kadanoff; 1998. 1986. [Google Scholar]
- 8.De S, Nagendra K, Lakshmisha K. Simulation of laminar flow in a three-dimensional lid-driven cavity by lattice Boltzmann method. International Journal of Numerical Methods for Heat & Fluid Flow. 2009;19(6):790–815. [Google Scholar]
- 9.de Vahl Davis G, Mallinson GD. An evaluation of upwind and central difference approximations by a study of recirculating flow. Computers & Fluids. 1976;4(1):29–43. [Google Scholar]
- 10.Degani A, Fox G. Parallel multigrid computation of the unsteady incompressible Navier-Stokes equations. Journal of Computational Physics. 1996;128(1):223–236. [Google Scholar]
- 11.Feldman Y, Gelfgat AY. Oscillatory instability of a three-dimensional lid-driven flow in a cube. Physics of Fluids. 2010;22:093602. [Google Scholar]
- 12.Filippova O, Hänel D. Lattice-Boltzmann simulation of gas-particle flow in filters. Computers & Fluids. 1997;26(7):697–712. [Google Scholar]
- 13.Freitas CJ, Street RL, Findikakis AN, Koseff JR. Numerical simulation of three-dimensional flow in a cavity. International Journal for Numerical Methods in Fluids. 1985;5(6):561–575. [Google Scholar]
- 14.Ghia U, Ghia K, Shin C. High-Re solutions for incompressible flow using the Navier-Stokes equations and a multigrid method. Journal of Computational Physics. 1982;48(3):387–411. [Google Scholar]
- 15.Goda K. A multistep technique with implicit difference schemes for calculating two-or three-dimensional cavity flows. Journal of Computational Physics. 1979;30(1):76–95. [Google Scholar]
- 16.Goodrich JW, Gustafson K, Halasi K. Hopf bifurcation in the driven cavity. Journal of Computational Physics. 1990;90(1):219–261. [Google Scholar]
- 17.He X, Duckwiler G, Valentino DJ. Lattice Boltzmann simulation of cerebral artery hemodynamics. Computers & Fluids. 2009;38(4):789–796. [Google Scholar]
- 18.He X, Luo L. Lattice Boltzmann model for the incompressible Navier–Stokes equation. Journal of Statistical Physics. 1997;88(31-4):927–944. [Google Scholar]
- 19.He X, Luo L. Theory of the lattice Boltzmann method: From the Boltzmann equation to the lattice Boltzmann equation. Physical Review E. 1997;56(6):6811. [Google Scholar]
- 20.Kang S, Hassan Y. The effect of lattice models within the lattice Boltzmann method in the simulation of wall-bounded turbulent flows. Journal of Computational Physics. 2012 [Google Scholar]
- 21.Koseff JR, Street R. On end wall effects in a lid-driven cavity flow. Journal of Fluids Engineering. 1984;106(4):385–389. [Google Scholar]
- 22.Lammers P, Beronov K, Volkert R, Brenner G, Durst F. Lattice BGK direct numerical simulation of fully developed turbulence in incompressible plane channel flow. Computers & Fluids. 2006;35(10):1137–1153. [Google Scholar]
- 23.Leriche E, Gavrilakis S. Direct numerical simulation of the flow in a lid-driven cubical cavity. Physics of Fluids. 2000;12(6):1363. [Google Scholar]
- 24.Liberzon A, Feldman Y, Gelfgat AY. Experimental observation of the steady-oscillatory transition in a cubic lid-driven cavity. Physics of Fluids. 2011;23:084106. [Google Scholar]
- 25.Lin LS, Chang HW, Lin CA. Multi relaxation time lattice Boltzmann simulations of transition in deep 2D lid driven cavity using GPU. Computers & Fluids. 2013;80:381–387. [Google Scholar]
- 26.Lin LS, Chen YC, Lin CA. Multi relaxation time lattice Boltzmann simulations of deep lid driven cavity flows at different aspect ratios. Computers & Fluids. 2011;45(1):233–240. [Google Scholar]
- 27.Liu Y. A lattice Boltzmann model for blood flows. Applied Mathematical Modelling. 2012;36(7):2890–2899. [Google Scholar]
- 28.Luo Ls, Krafczyk M, Shyy W. Lattice Boltzmann Method for Computational Fluid Dynamics. Fluid Dynamics. 2010;(0):1–10. [Google Scholar]
- 29.McNamara GR, Zanetti G. Use of the Boltzmann equation to simulate lattice-gas automata. Physical Review Letters. 1988;61(20):2332–2335. doi: 10.1103/PhysRevLett.61.2332. [DOI] [PubMed] [Google Scholar]
- 30.Patil D, Lakshmisha K, Rogg B. Lattice Boltzmann simulation of lid-driven flow in deep cavities. Computers & Fluids. 2006;35(10):1116–1125. [Google Scholar]
- 31.Poyurs CS. Ph.D. thesis. Cornell University; 2010. Application of the Lattice Boltzmann method to capillary seals and dynamic phase interfaces. [Google Scholar]
- 32.Prasad AK, Koseff JR. Reynolds number and end-wall effects on a lid-driven cavity flow. Physics of Fluids A: Fluid Dynamics. 1989;1:208. [Google Scholar]
- 33.Schreiber R, Keller H. Driven cavity flows by effcient numerical techniques. Journal of Computational Physics. 1983;49(2):310–333. [Google Scholar]
- 34.Shankar P, Deshpande M. Fluid mechanics in the driven cavity. Annual Review of Fluid Mechanics. 2000;32(1):93–136. [Google Scholar]
- 35.Shen J. Hopf bifurcation of the unsteady regularized driven cavity flow. Journal of Computational Physics. 1991;95(1):228–245. [Google Scholar]
- 36.Shetty DA, Fisher TC, Chunekar AR, Frankel SH. High-order incompressible large-eddy simulation of fully inhomogeneous turbulent flows. Journal of Computational Physics. 2010;229(23):8802–8822. [Google Scholar]
- 37.Sheu TW, Lin Y, Yu C. Numerical study of two regularization models for simulating the turbulent flows. Computers & Fluids. 2013;74:13–31. [Google Scholar]
- 38.Smagorinsky J. General circulation experiments with the primitive equations. Monthly Weather Review. 1963;91(3):99–164. [Google Scholar]
- 39.Succi S. Lattice Boltzmann Equation. Oxford University Press on Demand; 2001. [Google Scholar]
- 40.Sun DL, Qu ZG, He YL, Tao WQ. Performance analysis of IDEAL algorithm for three-dimensional incompressible fluid flow and heat transfer problems. International Journal for Numerical Methods in Fluids. 2009;61(10):1132–1160. [Google Scholar]
- 41.Thakur S, Shyy W, Udaykumar H, Hill L. Multiblock interface treatments in a pressure-based flow solver. Numerical Heat Transfer, Part B. 1998;33(4):367–396. [Google Scholar]
- 42.Theofilis V. Global linear instability. Annual Review of Fluid Mechanics. 2011;43:319–352. [Google Scholar]
- 43.Turner D, Nakshatrala K, Hjelmstad K. A variational multiscale Newton–Schur approach for the incompressible Navier–Stokes equations. International Journal for Numerical Methods in Fluids. 2010;62(2):119–137. [Google Scholar]
- 44.Wu J, Shu C. An improved immersed boundary-lattice Boltzmann method for simulating three-dimensional incompressible flows. Journal of Computational Physics. 2010;229(13):5022–5042. [Google Scholar]
- 45.Yu H, Luo L, Girimaji S. LES of turbulent square jet flow using an MRT lattice Boltzmann model. Computers & Fluids. 2006;35(8):957–965. [Google Scholar]
- 46.Zhang J. Lattice Boltzmann method for microfluidics: models and applications. Microfluidics and Nanofluidics. 2011;10(1):1–28. [Google Scholar]
- 47.Zhang J, Johnson PC, Popel AS. Red blood cell aggregation and dissociation in shear flows simulated by lattice Boltzmann method. Journal of Biomechanics. 2008;41(1):47–55. doi: 10.1016/j.jbiomech.2007.07.020. [DOI] [PMC free article] [PubMed] [Google Scholar]


