

Abstract
The Exxon Valdez oil spill occurred more than two decades ago, and the Prince William Sound ecosystem has essentially recovered. Nevertheless, discussion continues on whether or not localized effects persist on sea otters (Enhydra lutris) at northern Knight Island (NKI) and, if so, what are the associated attributable risks. A recent study estimated new rates of sea otter encounters with subsurface oil residues (SSOR) from the oil spill. We previously demonstrated that a potential pathway existed for exposures to polycyclic aromatic hydrocarbons (PAHs) and conducted a quantitative ecological risk assessment using an individual-based model that simulated this and other plausible exposure pathways. Here we quantitatively update the potential for this exposure pathway to constitute an ongoing risk to sea otters using the new estimates of SSOR encounters. Our conservative model predicted that the assimilated doses of PAHs to the 1-in-1000th most-exposed sea otters would remain 1–2 orders of magnitude below the chronic effects thresholds. We re-examine the baseline estimates, post-spill surveys, recovery status, and attributable risks for this subpopulation. We conclude that the new estimated frequencies of encountering SSOR do not constitute a plausible risk for sea otters at NKI and these sea otters have fully recovered from the oil spill.
Keywords: sea otter, Exxon Valdez oil spill, ecological risk assessment, Enhydra lutris, individual-based models, ecological recovery, attributable risk
INTRODUCTION
The Exxon Valdez oil spill (EVOS) occurred in Prince William Sound (PWS), Alaska, more than two decades ago, and the Sound's ecosystem has essentially recovered (Harwell and Gentile 2006; Integral Consulting 2006; Harwell et al. 2013). Nevertheless, discussion continues on whether or not ongoing effects from the oil spill still occur on sea otters (Enhydra lutris) at northern Knight Island (NKI). One major reason for the lack of scientific consensus appears to be a misunderstanding or misapplication of concepts relating to the assessment of ecological risks, ecological recovery, and attributable risk.
Northern Knight Island is an area in western PWS that was initially heavily oiled by the 1989 spill (Figure 1). The oil spill caused four primary stressors: (1) volatile organic compounds (VOCs), which dissipated very quickly but may have posed an early inhalation risk to marine mammals; (2) oiling, which caused most of the observed mortality to seabirds and sea otters through loss of thermoregulation in the cold PWS waters; the Exxon Valdez oil was largely eliminated from the water and shorelines by natural processes and clean-up activities in the initial months to few years after the spill (Neff et al. 1995; Boehm et al. 2011; Page et al. 2013); (3) polycyclic aromatic hydrocarbons (PAHs), the longer-term toxicity risk to exposed organisms; because essentially no bioavailable surface oil remains (Taylor and Reimer 2008), at present the only source of EVOS-derived PAHs is in subsurface oil residues (SSOR) located in the intertidal zone (ITZ); (4) physical disturbances and human presence from clean-up activities, which lasted through summer 1991 (Harrison 1991; Mearns 1996).
Figure 1.

Map of Prince William Sound, Alaska. The location of the Exxon Valdez oil spill is indicated by the red star; the location of the 1964 Great Alaska Earthquake (NRC 1971) is indicated by the black star. Shoreline oiling locations and initial oiling levels were derived from the Shoreline Cleanup & Assessment Technique (SCAT) II surveys conducted by Exxon (1989) following the oil spill. GIS data and map produced by Allison Zusi-Cobb, ABR Inc., Environmental Research and Services, Fairbanks, Alaska. (Color figure available online.)
Sea otters are particularly vulnerable to the physical effects of oiling because of their dense fur and unusually high metabolic rate, and oiling may cause decreased buoyancy and hypothermia from loss of insulating capacity (Lipscomb et al. 1994). They are also vulnerable to inhalation of VOCs and ingestion of oil-contaminated food, exacerbated by increased rates of grooming after oiling (Johnson and Garshelis 1995). As a result, the total observed mortality of sea otters from EVOS, which occurred in the immediate aftermath of the spill, was about 1000, consisting of 871 found carcasses and 123 deaths in rehabilitation centers (Estes 1991; Loughlin et al. 1996).
The year following EVOS, sea otters were largely absent from NKI; however, the initial post-spill survey, conducted in 1991, estimated ∼80 individuals at NKI (Garshelis and Johnson 2013b). Bodkin et al. (2002) reported that the sea otter subpopulation at NKI remained essentially unchanged (∼75 individuals in their surveys) during the period of 1993–2001, whereas the overall PWS population increased during that same period. Thus they concluded that the sea otters at NKI experienced delayed recovery both because those NKI numbers were well below a pre-spill survey estimate and because the NKI subpopulation numbers remained steady and failed to increase similarly to the overall PWS population growth. Bodkin et al. (2002, 2012) and Dean et al. (2002) attributed these putative effects to residual oil.
Bodkin et al. (2012) presented new data on the frequency at which pits that are excavated by sea otters while foraging for infaunal prey (primarily clams) in the ITZ potentially could intersect SSOR. They concluded that this pathway constituted a logical explanation for the persistent NKI subpopulation effect. No current effects have been posited for sea otters elsewhere in the Sound, even though SSOR is not limited to Knight Island.
The critical issue, however, is that demonstrating a pathway of potential exposure does not necessarily mean there is a significant risk. To conclude the existence of an ecological risk, there must also be sufficient assimilated doses from the exposure pathway, coupled with exceedance of a threshold of exposure that is demonstrated to cause chronic effects. In the case of this particular pathway, in which exposure occurs episodically, the resulting assimilated doses are a function of both the quantity of PAHs assimilated per SSOR encounter and the frequency of such encounters. Furthermore, assigning causality solely to EVOS-derived SSOR first requires a weight-of-evidence analysis of the potential risks that may be attributable to other natural and anthropogenic stressors. Finally, assessing the rate and extent of ecological recovery requires establishing an appropriate baseline condition, appropriate recovery objectives, and appropriate consideration of other natural and anthropogenic stressors impinging on the ecosystem.
Previously we presented a quantitative ecological risk assessment using a model that we developed to simulate this and other plausible pathways of PAH exposures to sea otters at NKI from EVOS (Harwell et al. 2010a). Here we evaluate the risks to sea otters using the newly revised estimates of exposure frequencies, compare them to those of our original study, discuss implications for assessing attributable risks, and provide a discussion of the concepts of ecological recovery, with an analysis focused specifically on sea otter recovery at NKI.
QUANTITATIVE RISK ASSESSMENT MODEL
The quantitative model that we, with colleagues, previously developed to predict exposures of PAHs to sea otters (Harwell et al. 2010a) is an individual-based model (IBM; DeAngelis and Gross 1992) designed to mimic the real-world by simulating a large number of individuals, each performing its routine activities on an hourly basis, parameterized using empirical databases on sea otters and the physical/chemical characteristics of the PWS environment in which they live. Because IBMs can explicitly present differing exposure regimes from one individual to another, or one day to another, just as an individual sea otter might experience the natural heterogeneity of exposures encountered in the real world, this class of models is ideal for assessing toxicological risks both to individuals and to populations (Munns et al. 2008).
The model's characteristics, sources of data, and results for the base model and the initial set of sensitivity analysis scenarios are presented in Harwell et al. (2010a). Briefly, our IBM simulates all plausible pathways for PAH exposures in the Sound (Figure 2), where sea otters feed primarily on epibenthic invertebrates like mussels or on infauna excavated from sediments, primarily clams (Calkins 1978; Doroff and Bodkin 1994; Johnson and Garshelis 1995; Dean et al. 2002; Harwell et al. 2012; Wolf et al. 2012). The sea otter's diet in the ITZ of the oil-affected part of the Sound is ∼50% clams (infauna) and 40% mussels (epifauna), whereas the subtidal zone (STZ) diet is ∼75% clams (Harwell et al. 2010a; Wolf et al. 2012). To collect clams, a sea otter excavates a pit by digging several centimeters into the sediments until clams are encountered (Shimek and Monk 1977; Calkins 1978; Hines and Loughlin 1980; Kvitek et al. 1988). One to several clams may be collected from a single pit during one or multiple dives, but consumption occurs at the water surface. Sea otters do not feed on shore, so foraging in the ITZ occurs only at the high part of the tidal cycle, when the benthos is underwater. Clams in PWS are restricted to the STZ and the lower ITZ, primarily ≤ +0.5 m relative to mean lower low water (MLLW) (Paul and Feder 1973; Nickerson 1977; Dean et al. 2002), which is also where the sea otter pits were found in surveys conducted at NKI by Boehm et al. (2007) and Bodkin et al. (2012). Thus, a potentially important pathway for PAH exposure occurs when a sea otter inadvertently intersects SSOR when foraging for infauna.
Figure 2.

Sea otter exposure pathways conceptual model. Exposure pathways conceptual model for sea otters at NKI from PAHs in SSOR, showing: (a) the release mechanism of direct exposure to PAHs by intersection of SSOR by a sea otter pit, including ingestion of both oil-phase and particulate-bound PAHs; (b) the release mechanisms of indirect exposure to PAHs through ingestion of PAHs in the diet. Reprinted from Harwell et al. (2010a) by permission of the publisher (Taylor & Francis Group, LLC). (Color figure available online.)
Essentially no STZ deposits of Exxon Valdez oil have been reported since shortly after the spill (O'Clair et al. 1996; Taylor and Reimer 2008). However, SSOR has been found in the ITZ under a 15–25 cm-thick layer of clean sediments, which in turn were located under a surface covering of stable armor composed of coarse gravel, cobble, and boulders (Hayes and Michel 1999; Taylor and Reimer 2008; Hayes et al. 2010). Short et al. (2006) reported that about 12% of SSOR occurred in the lower ITZ (i.e., the portion of the ITZ where virtually all sea otter foraging occurs), with the remaining 88% at the higher elevations in the ITZ and thus essentially not available for sea otter encounters. Moreover, SSOR rarely occurred in unarmored, finer-grained sediments (Taylor and Reimer 2008), which is the primary clam habitat in PWS.
The probability of a sea otter digging a pit that intersects SSOR is determined by the distribution of SSOR patches and clam habitat (i.e., their co-occurrence) as well as the number of pits excavated per sea otter per day in the ITZ. In our base model, the probability of a sea otter pit intersecting SSOR was modeled implicitly through the hourly activities of each individual. By the end of each 1-h time step, if a sea otter dug a pit that intersected SSOR, then the model assigned the quantity of each of 40 PAH analytes assimilated from each exposure pathway parameterized using SSOR samples from oiled areas of PWS. The other non-SSOR-intersecting pathways of PAH exposures for sea otters in oiled or unoiled areas also were modeled using PAH concentrations measured in their respective areas (e.g., in sediments and the tissues of various prey species).
To assess exposure variability from each pathway and each scenario, including the periodic but infrequent encounters with SSOR, the model simulated chronic doses to 500,000 sea otters by randomly assigning a specific value for each stochastic parameter in each simulation hour, sampled from empirically based lognormal data distributions. Many sensitivity analyses scenarios were conducted to explore alternative model parameters and model structures. Altogether, >1 billion sea otter-hours were simulated to capture the variability in environmental, SSOR, and sea otter characteristics. In this way, the simulated population captured the full range of plausible exposures to PAHs that could occur to sea otters at NKI. These analyses demonstrated that physically contacting SSOR was the dominant exposure pathway of PAHs to sea otters in oiled areas.
To provide highly conservative estimates of potential effects, we rank-ordered the assimilated doses from each scenario and focused on the 99.9% quantile sea otters (the 1-in-1000th most-exposed individuals, i.e., those in the upper 0.1% of the exposure distributions) for effects assessments; these are the sea otters in the stochastic model who just happened to have the most SSOR encounters at the highest PAH concentrations. Other quantiles were also calculated, allowing inferences about population-level effects (Harwell et al. 2012).
The effects component of the risk assessment (also described in detail in Harwell et al. 2010a) was based on deriving appropriate chronic toxicity reference values (TRVs) for PAH exposures to sea otters following a standard U.S. Environmental Protection Agency (USEPA)–approved methodology using data from the USEPA Eco-SSL toxicity database (USEPA 2005, 2007). The TRV is defined as the dose from chronic exposures above which ecologically relevant effects might occur to wildlife species and below which it is reasonably expected that such effects would not occur (USEPA 2005). We extracted the no-observed-adverse-effects (NOAEL) and lowest-observed-adverse-effects (LOAEL) levels from each of 42 selected toxicity studies, using the population-relevant endpoints of mortality, growth, or reproductive effects. From these, we derived conservative TRVs using the geometric 95% lower confidence levels across the toxicity studies. Geometric statistics are used in USEPA guidance to better represent the distribution of toxicity data across experiments and species. The geometric 95% lower CL is often used in ecological risk assessments to address interspecies sensitivity differences for untested species (see for instance the USEPA-issued guidance for establishing water quality criteria [Stephan et al. 1985] and sediment quality criteria [USEPA 1993]), rather than applying safety factors, as is commonly done in human health risk assessments. TRVs were established separately for 2–3 ring PAHs, 4–6 ring PAHs, and total PAHs (TPAH), following USEPA (2007) guidance. In general, the risks from 4–6 ring PAHs were consistently the highest.
The assimilated doses from our base model (i.e., the version of the model with the best-estimate values or the best-estimate lognormal distributions for each parameter) to the 99.9% quantile sea otters were ∼30 to 125 times lower than the NOAEL TRV threshold, and ∼75 to 310 times lower than the LOAEL threshold (the range varying across the seven modeled sea otter classes) (Harwell et al. 2010a). None of the sensitivity analyses came within an order-of-magnitude of causing an effect on even the single-most-exposed individual out of the entire simulated population of 500,000 individuals (i.e., the 99.9998% quantile). Harwell et al. (2010a) concluded therefore that there was no plausible risk to any individual sea otter at northern Knight Island from Exxon Valdez oil residues.
RISK ASSESSMENT USING THE BODKIN ET AL. (2012) SCENARIO
Bodkin et al.'s (2012) estimates of the frequency that a sea otter would encounter SSOR were based on newly reported field studies in which they surgically implanted time-depth recorders in 30 sea otters that were captured in the vicinity of NKI during 2003 and 2004. They attempted to recapture all sea otters with implants in 2004 and 2005, opportunistically recovering additional tide-depth recorders through 2008. Altogether the tide-depth recorders were recovered from 19 individuals (15 adult females and 4 adult males) after at least 1 year of data collection. (No indication was given of what happened to the other 11 sea otters.)
Using observational data collected simultaneously with a subset of the recorded dives, the authors developed a regression model to categorize dives as foraging or non-foraging; derived estimates of the depth of each foraging dive based on tidal elevation at the time of the dive (with a stated allowable surface error of 0.5 m); categorized dives as subtidal (which they defined as >1.5 m below MLLW) or intertidal (which they defined as > 1.5 m below MLLW); and for the latter, assigned the dive to one of the intertidal depth zones following Short et al. (2006). During summer 2008, they surveyed soft-sediment beaches for evidence of sea otter foraging in the ITZ (i.e., remnant pits) and for presence of clams through shell remains. Based on these diving data and the Short et al. (2006) estimated frequency of a random sea otter pit encountering SSOR (0.0037 pit−1), Bodkin et al. (2012) calculated the rates of sea otters encountering SSOR in the NKI environment: 10 yr−1 for females (range 2–24; n = 15) and 4 yr−1 for males (range listed both as 2–4 and 2–5; n = 4). By comparison the estimates from our base model were about 2–7 yr−1, depending on the sea otter age–gender class (Harwell et al. 2010a, 2012). Consequently, the Bodkin et al. (2012) estimates of the frequency of sea otter encounters with SSOR comport with our previously published estimates, in which the dive frequency data were derived from the observational database of our co-authors (Garshelis and Johnson) involving more than 3000 dives in PWS. (Note, however, that because the Short et al. [2006] calculations were based on the incorrect assumption that sea otters forage equally throughout the ITZ, instead of only in the lower intertidal zone, the Bodkin et al. [2010] SSOR encounter probabilities are overestimated by a factor of ∼8x.)
Bodkin et al. (2012) concluded that this pathway constitutes a “logical explanation” for delayed recovery of the NKI subpopulation. However, to understand the potential ecological effects of this exposure pathway and their implications, a quantitative risk assessment is required. Simply identifying a potential pathway and quantifying the frequency at which that pathway occurs are insufficient, by themselves, to assess the risks of adverse ecological effects. Consequently, we updated our quantitative individual-based model to predict exposures from the SSOR-encounter pathway at the rates of occurrence estimated by Bodkin et al. (2012), compared the assimilated doses to the TRVs, and assessed the expected effects on individuals and the subpopulation.
For the exposure assessment, we used a structurally modified model that bypasses all probabilistic algorithms for determining whether an SSOR-intersecting pit was dug by a sea otter (described in Harwell et al. 2010a). Instead, the modified model forces one SSOR-intersecting pit to occur per day while keeping all other stochastic processes unchanged. Because the TRVs and modeled assimilated doses are for chronic exposures averaged over time (measured as units of mg PAH · kg−1 sea otter weight · day−1), they are linearly scalable in this modified model (e.g., twice as many SSOR encounters per unit of time results in a doubled assimilated dose). This allows us to scale the one-pit-per-day outcomes to reflect any specified frequency of encountering SSOR while maintaining the other sources of variability in the assimilated doses. In that manner we estimated the hazard quotients (HQ; the ratio of assimilated dose to TRV) for adult male and female sea otters at the mean, minimum, and maximum values of SSOR-encounter frequencies of Bodkin et al. (2012). Because the resulting HQs were so low, we also assessed how many SSOR encounters would be required to cause an effect by artificially increasing the SSOR-encounter rate until the toxicity thresholds were reached (i.e., HQ = 1). Finally, we examined other quantiles in order to evaluate the SSOR-encounter rate that would be needed to cause subpopulation-level effects on the sea otters at NKI.
In addition to assessing sea otters' diving frequencies, Bodkin et al. (2012) reported TPAH levels in sediments collected in 2008 from below sea otter pits at four beach segments on oiled sites. Of the 41 samples collected, 18 (44%) had TPAH values exceeding background (listed as 17 ppb). Of those 18 samples, the geometric mean TPAH value was 136 ppb, range 19–56,568 (Table 4 of Bodkin et al. 2012). By comparison, the SSOR sediment PAH data used in our base model were much higher, with geometric means of 34,265 ppb (range 6595–137,950) for heavy oil residues (HOR), 3027 ppb (range 414–28,280) for medium oil residues (MOR), 1195 ppb (range 345–4868) for light oil residues (LOR), 260 ppb (range 44–654) for visible oil film, and 81 ppb (range 12–504) for sediments with no observable oiling (based on the Short et al. [2006] oiling level classification scheme for SSOR). Moreover: (1) our model sampled randomly from the lognormal distribution derived from the sample data for each oiling category for each SSOR patch encountered for each time step; (2) the relative frequencies of oiling levels in SSOR (HOR 8.3%; MOR 33.3%, LOR 31.7%, and oil-film trace 26.7%) were set in the model as measured by Short et al. (2006); (3) 500,000 sea otters were simulated for each scenario; (4) our results were based on the 99.9% quantile most-exposed sea otters. Thus, we can conclude that the SSOR sources encountered by sea otters in our base model were several orders-of-magnitude higher than in the Bodkin et al. (2012) sediment samples. Consequently, the results discussed below are very conservative compared to the results we would have derived had we used the Bodkin et al. (2012) sediment TPAH data.
RESULTS AND DISCUSSION
The results under the Bodkin et al. (2012) mean rates of SSOR-encounters (Table 1) reflect. a lower risk of adverse effects by a factor of ∼3.5× for males and ∼1.4–2.5× for females than predicted by our base model. These results also indicate a lower risk than the sensitivity analysis conducted using the sea otters' diving parameters of Ballachey and Bodkin (2006) by factors of ∼3.3× for males and ∼1.4× for females. Since our base model's results already indicated no plausible effects for individuals from SSOR-derived PAHs, the results using the new Bodkin et al. (2012) data reinforce the implausibility of adverse effects.
Table 1.
Hazard quotients for sea otters encountering SSOR. (A) HQs are reported for the 99.9% quantile adult male and female sea otters based on IBM simulations of 500,000 individuals in each gender class at the respective minimum, mean, and maximum encounter frequencies estimated by Bodkin et al. (2012). HQs were separately derived for the assimilated doses of 2–3-ring PAHs, 4–6-ring PAHs, and TPAH. (B) Values are shown for the HQs using the Harwell et al. (2010a) base model and selected sensitivity analyses, including the 1-SSOR-pit-per-day scenario based on data in Harwell et al. (2012). Also reported are the number of SSOR-intersecting pits per day required in order for the assimilated doses to reach the NOAEL and LOAEL TRV values (i.e., HQ = 1).
| Number of SSOR1 | 99.9% Quantile NOAEL HQ2 |
99.9% Quantile LOAEL HQ2,3 |
||||||
| Sea Otter Class | Encounters per Year | 2–3 Ring PAH4 | 4–6 Ring PAH5 | TPAH6 | 2–3 Ring PAH4 | 4–6 Ring TPAH5 | TPAH6 | |
| (A) Hazard Quotient Results from Bodkin et al. (2012) Scenarios | ||||||||
| Adult male | mean | 4 | 0.0004 | 0.0023 | 0.0014 | 0.0002 | 0.0009 | 0.0008 |
| min | 2 | 0.0002 | 0.0012 | 0.0007 | 0.0001 | 0.0004 | 0.0004 | |
| max | 5 | 0.0005 | 0.0029 | 0.0017 | 0.0002 | 0.0011 | 0.0011 | |
| Adult female | mean | 10 | 0.0011 | 0.0065 | 0.0039 | 0.0005 | 0.0025 | 0.0024 |
| min | 2 | 0.0002 | 0.0013 | 0.0008 | 0.0001 | 0.0005 | 0.0005 | |
| max | 24 | 0.0026 | 0.0157 | 0.0094 | 0.0013 | 0.0061 | 0.0058 | |
| (B) Hazard Quotient Results from Harwell et al. (2010a) Base Model and Selected Scenarios | ||||||||
| Adult male | ||||||||
| Base Model7 | 0.0014 | 0.0083 | 0.0050 | 0.0007 | 0.0032 | 0.0031 | ||
| Ballachey & Bodkin Parameters8 | — | 0.0076 | — | — | — | — | ||
| 1 SSOR Pit Per Day9 | 0.0340 | 0.2110 | 0.1250 | 0.0170 | 0.0820 | 0.0770 | ||
| Number of SSOR Pits Per Day for HQ=1 | 29.4 | 4.7 | 8.0 | 58.8 | 12.2 | 12.9 | ||
| Adult female | ||||||||
| Base Model Female without Pup7 | 0.0019 | 0.0091 | 0.0060 | 0.0010 | 0.0035 | 0.0037 | ||
| Base Model Female with Pup7 | 0.0027 | 0.0167 | 0.0097 | 0.0013 | 0.0065 | 0.0060 | ||
| Ballachey & Bodkin Parameters8 | — | 0.0091 | — | — | — | — | ||
| 1 SSOR Pit Per Day9 | 0.0390 | 0.2390 | 0.1430 | 0.0200 | 0.0930 | 0.0880 | ||
| Number of SSOR Pits | ||||||||
| Per Day for HQ=110 | ||||||||
| Female without Pup | 25.5 | 4.2 | 7.0 | 51.2 | 10.7 | 11.3 | ||
| Female with Pup | 32.9 | 5.4 | 9.2 | 66.0 | 13.9 | 14.9 | ||
SSOR = Subsurface oil residues remaining from the Exxon Valdez oil spill.
SSOR encounter rate estimates from Bodkin et al. (2012).
99.9% Quantile is the assimilated dose to the 1-in-1000th most-exposed sea otters in the simulated population of 500,000 individuals.
NOAEL = No-observed-adverse-effects-level based on toxicity reference values (TRV) derived from data in USEPA (2007); see text for details.
HQ = Hazard quotient = ratio of assimilated dose to the TRV.
HQs calculated by scaling from model outputs for the one-pit-per-day scenario reported in Harwell et al. (2012).
Harwell et al. (2012) differentiated two adult female classes and two adult male classes; data here based on highest value within each gender class.
LOAEL = Lowest-observed-adverse-effects-level based on TRV derived from data in USEPA (2007); see text for details.
The class of PAHs among the 40 simulated analytes having 2- or 3-ring structures; used for separate TRV following USEPA (2007).
The class of PAHs among the 40 simulated analytes having 4-, 5-, or 6-ring structures; used for separate TRV following USEPA (2007).
TPAH = Total PAHs = sum of the 40 simulated PAH analytes; used for separate TRV following USEPA (2007).
Results from base model (having best-estimate values for all parameters); data from Harwell et al. (2010a).
Results from sensitivity analysis using sea otter diving parameters from Ballachey and Bodkin (2006).
Results from modified model that forces one SSOR-intersecting pit per day throughout simulations; data from Harwell et al. (2012); sensitivity analysis conducted only on highest risk value (i.e., using 4–6-ring PAH NOAEL TRV).
Number of SSOR-intersecting pits per day required to reach HQ=1 level (i.e., assimilated dose = TRV value); data from Harwell et al. (2012).
These differences are illustrated in Figure 3. At the maximum rate of SSOR encounters estimated by Bodkin et al. (2012) for female sea otters (24 encounters · yr−1), the 99.9% quantile NOAEL HQs overlap our base model's predictions for both males and females. At lower SSOR encounter rates, the Bodkin et al. (2012) HQs are commensurately lower, so that in all cases, the values are at least two orders-of-magnitude below thresholds of effects. This means that the seasonality issue raised by Bodkin et al. (2012, p. 282; that higher values of SSOR encounters were predicted to occur in spring, and that estimates of exposure that do not account for this seasonality can produce biased estimates of risk) does not actually affect the overall risk conclusion.
Figure 3.
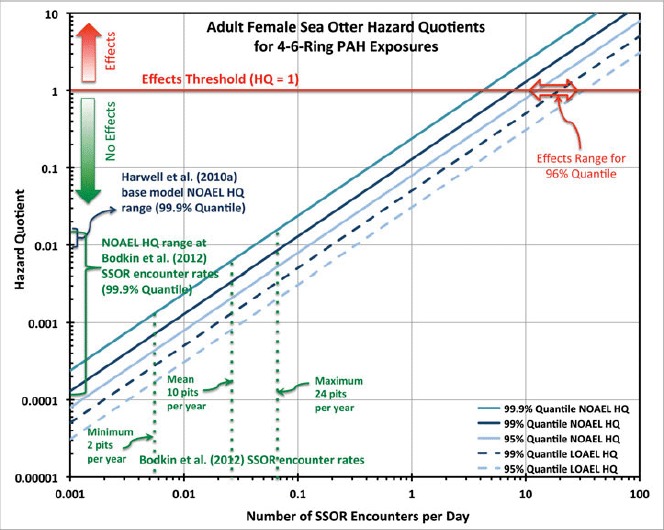
Hazard quotients versus number of SSOR encounters per day. HQ values are for simulations of 500,000 adult female sea otters exposed to 4–6-ring PAHs through encounters with SSOR. (HQ values are not shown here but were lower for both 2–3-ring PAHs and TPAH.) The horizontal red line shows the chronic effects threshold (i.e., HQ = 1), above which effects would be expected and below which no effects would be expected. NOAEL and LOAEL HQ values are shown for three selected quantiles (99.9%, 99%, and 95%); actual effects would be expected to occur between the NOAEL and LOAEL TRV values. Selected rates of encountering SSOR are shown, including the minimum, mean, and maximum rates predicted by Bodkin et al. (2012) and the probabilities of encountering SSOR predicted by the Harwell et al. (2010a) base model. Also shown is the range of SSOR encounters per day that would be required in order to cause effects for 4% of the population (i.e., the 96% quantile). (Color figure available online.)
Another way to understand these results is to calculate the degree to which these assimilated doses are below the toxicity thresholds. At the mean rates of SSOR encounters calculated by Bodkin et al. (2012), exposures for the 99.9% quantile adult females are ∼150–900× lower than NOAEL toxicity thresholds and ∼400–1800× lower than LOAEL toxicity thresholds (varying across PAH class); for males the values are more than ∼400–2600× and ∼1100–5300× lower, respectively. Thus, to cause effects on the most-exposed individuals, it would require assimilated doses that are hundreds to thousands of times above those that would result from the rates of SSOR encounters estimated by Bodkin et al. (2012).
Similarly, Harwell et al. (2012) assessed how many SSOR encounters per unit of time would be required to reach toxicity thresholds for an individual. Results showed (Table 1) that it would take ∼4 and 10 pits intersecting SSOR per day, occurring continuously for many months, for NOAEL and LOAEL TRV levels, respectively, to be reached for the 99.9% quantile sea otters. This means that four SSOR encounters per day would not be expected to cause effects for even the individuals with the highest PAH exposures, but 10 such daily encounters would be, so the actual effects threshold is somewhere in between those rates (a still higher rate would be needed to cause effects on the median-exposed sea otters). This effects threshold rate contrasts with our base model's predictions showing that one SSOR-intersecting pit would occur, on average, about once every 50 to 180 days, depending on the sea otter class (Harwell et al. 2012). This illustrates just how far below any plausible effects the SSOR-encountering rates estimated by Bodkin et al. (2012) (4–10 times · yr−1 versus 4–10 times · day−1) actually are.
Additionally, the data in Bodkin et al. (2012) indicate that the average number of foraging pits excavated per day in the ITZ was 44 for females and 11 for males. This suggests that to reach the 4–10 SSOR encounters per day required to cause effects for the most-exposed female sea otters, about 10–25% of the pits dug every day need to intersect SSOR (i.e., about 10–25% of the surface area of the foraging intertidal zone needs to contain SSOR); the comparable numbers for males are ∼35–90%. But Short et al. (2006) estimated the probability of randomly encountering SSOR throughout the ITZ was 0.37% (the rate would be about 0.043% in the lower ITZ where sea otter foraging actually occurs [Harwell et al. 2010a]), based on the NOAA survey for presence of subsurface oil residues in 2003. Thus, for effects to occur, the areal coverage would have had to have been ∼100–1000× higher than seen in the 2003 survey, now a decade ago; that extent of coverage likely occurred only in the early period after the oil spill.
In addition to the 99.9% quantile, we examined two other quantiles of exposures, 99% and 95% (Figure 3). Lower quantiles have the effect of moving the risk curve to the right (i.e., increasing the number of SSOR encounters necessary to cause effects). Of particular relevance is the 96% quantile (i.e., the exposure at which the assimilated doses to 4% of the population would exceed effects thresholds): A rationale provided by Bodkin et al. (2002) in concluding that the NKI subpopulation of sea otters continued to experience effects was their data showing essentially constant numbers (∼75 individuals) over an 8-yr period (1993–2000), during which time they estimated the overall western PWS population increased at the rate of about 4% yr−1. That translates into a net absence of ∼3 additional sea otters per year at NKI if that subpopulation were growing at the same rate as the total population in the Sound. Based on our estimated 96% quantile results (shown in Figure 3), we predict that it would require ∼20 SSOR-intersecting pits per day for each sea otter at NKI, occurring continuously over a period of weeks to months, for such a net loss to result from SSOR toxicity, a rate that far exceeds the estimated frequencies of 4–10 times per year of Bodkin et al. (2012). Thus, if there is an effect, it must be attributable to natural or anthropogenic stressors other than PAHs in residual Exxon Valdez oil.
Attributable Risk
Assessing and attributing risks to one of the many natural and anthropogenic stressors operating in a complex, highly dynamic environment like PWS are challenging (Harwell et al. 2010b). Of particular importance is establishment of a plausible causal relationship between each stressor and its effects on the valued ecological attribute, and then identifying the stressor(s) most likely to be causing observed effects (Suter et al. 2002; Suter 2007; USEPA 2010). One approach is to evaluate all the available evidence in a consistent manner using Hill's (1965) criteria, as adapted for ecological issues (Fox 1991; Beyers 1998). USEPA has incorporated this approach into its site-specific Causal Analysis/Diagnosis Decision Information System (CADDIS) (Suter et al. 2002; USEPA 2010), which provides a consistent and transparent framework for determining in a multi-stressor situation which of the candidate stressors has the most plausible causal association that is supported by the available information. This strength-of-evidence approach uses laboratory and field evidence to assess these causal characteristics: (1) co-occurrence—an effect occurs only where and when its cause occurs; (2) sufficiency—the causal factor should be of sufficient magnitude (e.g., intensity, frequency, duration) to produce the observed effect; (3) temporality—a cause must precede its putative effect; (4) coherence—the relationship between cause and effect must be consistent with scientific knowledge and theory (Suter 2007). The critical next step is to apply abductive inference for identifying which causal hypothesis best explains the available information (Josephson and Josephson 1996; Hacking 2001).
Bodkin et al. (2012) stated that since they established a potential pathway for SSOR exposure to sea otters, that pathway is a logical explanation for purported subpopulation effects, but this both erroneously equates exposure with risk (contrary to the USEPA [1992, 1998] definition of ecological risk) and erroneously presumes that Exxon Valdez oil-derived PAH toxicity is the sole causal factor to consider. To the contrary, many other stressors exist in Prince William Sound. In such circumstances, it is appropriate to apply the formal USEPA (2010) approach for assessing attributable risk in a multi-stressor environment.
Using conceptual models of the PWS-Gulf of Alaska ecosystem, in conjunction with ranking and causal analysis, Harwell et al. (2010b) demonstrated that stressors associated with natural processes truly dominate and shape this ecosystem, especially climatic and oceanographic variability (Minobe 1997; Hare and Mantua 2000; Mundy and Olsson 2002; Stabeno et al. 2004). Moreover, climatic and oceanographic variabilities in the northern Pacific periodically combine to cause climate regime shifts. In particular, the climate regime shifts that have occurred over the past few decades have caused major variability in the abundance of forage fish, which has cascaded through the ecosystem, causing effects on the marine mammals and sea birds that depend on them (Mantua et al. 1997; Peterson and Schwing 2003; Trites et al. 2007; Overland et al. 2008; Estes et al. 2009). Thus, we found that whereas immediately after Exxon Valdez, the oil spill–related stressors rose to the level of critical importance to the ecosystem, over time the long-term spill-related stressors have become trivial in comparison to natural processes.
As an example of the ecological importance of climate-ocean processes as a driver of ecosystem change in the region, the coastal Alaska sea otter population west of, but not including, PWS recently was listed as threatened by the U.S. Fish and Wildlife Service (USFWS 2005). This classification was because of dramatic declines in abundance by 55–67% (and >90% in some areas) since the mid-1980s, which USFWS (2005, 2010) and Estes et al. (1998) attributed to increased predation by transient killer whales (Orcinus orca). This apparently was driven by the cascading effects of climate regime shifts, exacerbated by overfishing, in which major changes in plankton populations caused large declines in foraging fish, which caused the collapse of the Steller sea lion (Eumetopias jubatus) and harbor seal (Phoca vitulina) populations, which in turn forced the transient killer whales to shift their prey base to increased reliance on sea otters (NRC 2003). A single killer whale could readily consume the presumed missing annual quota of three additional sea otters at NKI in just one feeding bout (Williams et al. 2004). Supporting this potential mechanism, predation by transient killer whales on sea otters in the vicinity of NKI has been reported in the literature (Hatfield et al. 1998), and Vos et al. (2006) found five dead sea otters in the stomach of a dead killer whale in Latouche Passage, just south of Knight Island.
Hypotheses of effects on local sea otter numbers from other potential stressors, both natural and anthropogenic, could also be envisioned, such as subsistence harvesting (e.g., 5 to 10% of the Knight Island sea otter population was legally harvested by Alaskan Natives in 2000 and 2003; Garshelis and Johnson 2013a,b). Perhaps even the extraordinarily intense studies of sea otters at NKI over the past two decades, as documented in many Trustee1-sponsored publications (http://www.evostc.state.ak.us), might have encouraged a few sea otters to seek another place to live (e.g., sea otters tend to leave areas with high boat traffic; Garshelis and Garshelis [1984]). Other potential causal factors have been listed elsewhere (Garshelis and Johnson 2013a,b). In any case, natural oceanic and climatic processes are the key drivers of the structure and function of the PWS ecosystem and, through species interactions and associated cascading effects, ultimately control the upper trophic-level constituents like sea otters (Harwell et al. 2010b; Estes et al. 2013). Consequently, these natural processes are much more important than merely very low level exposure to residual PAHs that occur in mostly inaccessible, buried deposits of oil residues, which in turn are located almost solely where sea otters do not dig for clams, from an oil spill that happened more than two decades previously. We do not claim that any one of these other causal factors necessarily caused persistent effects on the NKI subpopulation, if indeed any such effects occurred. However, we do assert that PAH toxicity from SSOR could not be the responsible agent, as it fails the sufficiency criterion.
Recovery of Sea Otters from the Oil Spill
Separate from the issue of whether or not the SSOR could cause effects is determining whether or not effects actually persist (i.e., the recovery status of the sea otters). The Natural Resources Damage Assessment (NRDA) regulations, derived from CERCLA (1980), and the Oil Pollution Act of 1990 (OPA 90) regulations (NOAA 1996, 2010) define ecological recovery as a return of injured resources and services to baseline, which is defined as the condition that would have existed had no spill occurred, taking into account natural variability and other ecosystem changes in the interim. But this regulatory definition leaves unresolved such critical issues as: What constitutes baseline? Which ecological attributes should be monitored to assess recovery, and which should not? How should recovery objectives be defined for each attribute? How does recovery relate to natural variability and to other non-spill-related stressors?
Inappropriate recovery objectives
The recovery status of some injured resources from the Exxon Valdez oil spill, including sea otters, is muddled by the specific recovery objectives that were developed by the Exxon Valdez Oil Spill Trustee Council. The Trustees (2010, p. 33) stated, “Sea otters will have recovered when the population in oiled areas returns to conditions that would have existed had the spill not occurred and when biochemical indicators of hydrocarbon exposure in otters in the oiled areas are similar to those in otters in unoiled areas” [italics added]. The first half of that definition clearly follows the NRDA regulations (although they seem to have ignored the part about natural variability and ecosystem changes), but the second does not: in ecological risk terminology, recovery under the NRDA and OPA 90 regulations is strictly an effects issue (i.e., condition). Recovery relates to exposure only insofar as stressors from the oil spill continued to occur at sufficient magnitude and duration to cause persistent effects, and merely observing changes in a biochemical indicator of exposure does not demonstrate biologically significant effects, even if the indicator were specific to the stressor.
The Trustees (2010) further compounded the issue by focusing their recovery status evaluations on a particular biochemical marker (CYP1A) that is not diagnostic of petrogenic hydrocarbons, let alone specific to PAHs from Exxon Valdez oil. Rather, CYP1A is a general indicator of cytochrome P450 induction, that is, activation of a system designed to detoxify a broad diversity of chemical agents (Lewis 2001). For example, CYP1A is also induced by PCBs, pyrogenic PAHs, and diesel oil, all of which are present in PWS. In fact, this generic detoxification system developed so early in the evolutionary process that it occurs in virtually all plant and animal life forms (Lewis 2001). Moreover, because the cytochrome P450 induction system is designed specifically to detoxify (i.e., eliminate the toxic chemical from the organism and thereby prevent effects on the individual), it is logical that CYP1A would be manifested at PAH levels below what would actually cause the loss of a sea otter or cause adverse effects on a subpopulation. Consequently, induction of CYP1A only means that the detoxification process is underway, not that it has failed to prevent effects. (For a more comprehensive discussion of limitations in the use of CYP1A as a biomarker for oil spills, see Oris and Roberts [2013].)
An additional problem with the Trustees' definition is that under a “no longer exposed” criterion, recovery could never be attained, whether from Exxon Valdez or any other source of hydrocarbons in the Sound. For example, PAHs still remain in PWS sediments from the heavy Monterey fuel oil that was released in the Great Alaska Earthquake of 1964 and from toxic chemicals related to a cannery that closed a century ago (NRC 1971; Kvenvolden et al. 1993; Page et al. 1999; Wooley 2002). Those PAHs may well be limited to localized patches, and their concentrations are likely far too low to pose any ecological risk, but, nevertheless, exposures continue to exist from background levels of PAHs, so by that definition, recovery has not been attained and never will be.
Ecological risk-based recovery assessment
We propose to step back from the narrow definition of recovery provided by the Trustees to examine the broader ecological context of recovery. In its theoretical foundations, ecological recovery is one facet of the concept of ecosystem stability (i.e., resilience), defined as whether or not, and how rapidly, an ecosystem returns to some pre-disturbance condition once the stressor is removed. Initially this was explored through analyses of model ecosystems, using eigenvalues and eigenvectors to characterize asymptotic post-perturbation responses of linear or linearized models (e.g., May 1974; Harte 1979). This approach is derived from stability analyses of engineering or economics systems using deterministic responses within a range of linearity, that is, sufficiently small displacements from steady-state to be tractable analytically (e.g., Bhatia and Szego 1970; Hadar 1971). Thus important issues of nonlinearities, thresholds of effects, non-steady-state dynamics, differential responses across ecosystem attributes, spatial and temporal variability, and regime shifts were all essentially ignored. Unfortunately, these simplifications missed much of the essence of recovery in real-world ecosystems, including Prince William Sound following the oil spill. They have served to reinforce the misperception that ecosystems have steady-state, balance-of-nature endpoints, and that recovery consists of return to a precise, deterministic pre-perturbation state, exactly where the system was before the stressor. This misperception has had unfortunate implications for assessing ecological recovery, as illustrated in the present case (see also Parker and Wiens 2005).
By contrast, we propose a risk-based approach that is more ecologically relevant and practical, focused less on analytical elegance and more on assessing ecological recovery in a complex and changing ecosystem. In this approach, each selected valued ecological attribute (such as sea otters) is considered not just in comparison to an estimate of its pre-spill numbers, but also in context of its history and dynamics, the other stressors impinging on the attribute, and the natural variability and dynamical changes occurring in the ecosystem over time. Attaining recovery involves both facets of risk: (1) each stressor from the spill has diminished to levels that are insufficient to cause continuing or additional effects, and (2) effects that are attributable to the oil spill are no longer ecologically significant (Gentile and Harwell 1998). Importantly, this risk-based approach remains faithful to the NRDA and OPA-90 regulatory definitions of recovery.
Thus, the issues of baseline and scale (particularly heterogeneity across space and time) are critical to assessing recovery. In the case of coastal Alaska sea otters, the population was rapidly increasing and expanding over the decades prior to EVOS, still recovering from its near-extinction until protected by the International Fur Seal Treaty (Doroff et al. 2003) in the early 20th century. As a result, many areas, including parts of PWS, may not have been at carrying capacity at the time of the spill, meaning that the baseline was not static, with a single value, but in the process of continual dynamic change over time. The sea otter population initially expanded into western PWS in the 1960s, reaching Knight Island by 1970, and continuing on through eastern PWS thereafter (Johnson and Garshelis 1995). Consequently, the baseline at the time of the spill may have varied considerably across different areas within the Sound. Moreover, the sea otter population may have been significantly impacted by the Great Alaska Earthquake of 1964 (NRC 1971), which centered remarkably close to where the Exxon Valdez grounded (Figure 1) and which essentially destroyed the ITZ through vertical displacements exceeding 10 m in many areas of the Sound (Stanley 1968).
Once mortality in the immediate aftermath of the oil spill ended, the sea otter numbers increased in western PWS, doubling from about 2000 in 1993 to about 4000 in 2009 (Bodkin et al. 2011). At least at this scale, there do not appear to be long-term population-level effects compared to the expected baseline conditions in the absence of the oil spill. However, at the smaller scale of the localized area of northern Knight Island, which has a subpopulation that represents but a small fraction of the western PWS sea otter population (<3% in the most-recent survey numbers [Bodkin et al. 2011]), uncertainties in baseline and carrying capacity become increased impediments to assessing recovery.
This phenomenon is further exacerbated if the value used as the baseline is unreliable in the first place. Unfortunately, there are problems with both of the baseline pre-spill NKI subpopulation estimates derived by Dean et al. (2000) that were used to assert that recovery has been delayed (Dean et al. 2002; Bodkin et al. 2002, 2012). One estimate, 165, was the number of sea otter casualties in the area immediately after the spill, either as carcasses collected or as captured injured individuals who died in rehabilitation centers, and the other estimate, 237, was based on the only published pre-spill survey of sea otters in PWS (Pitcher 1975).
There are two issues with the immediate post-spill casualty estimates, either of which could have resulted in a significant over-estimation of the actual NKI population at the time of the spill. First, as Garshelis and Johnson (2001, 2013a,b) have noted, both the prevailing currents and a large storm with strong northerly winds not long after the spill pushed the oil towards Knight Island (Galt and Peyton 1990), causing particularly heavy oiling on NKI even though it was much further from the spill site than many shorelines receiving little or no oiling (Figure 1). Thus, heavily oiled sea otters could also have been swept up by the advancing oil from a large area and pushed toward NKI, thereby increasing the numbers deposited there beyond just local mortalities, resulting in an inflated pre-spill subpopulation estimate. The other issue with the casualty estimate is the bias in “sampling” methods, in which widespread mortality of individuals in an area could indicate many more individuals than would be directly observed by helicopter surveys (the basis of the post-spill surveys).
In deriving the second estimate (237 sea otters), Dean et al. (2000, p. 282) stated, “The pre-spill estimate of sea otter abundance is based on data from a sound-wide aerial census conducted in June 1973 (Pitcher 1975). We estimated abundance within our study areas by taking subsets of the census data corresponding to these areas.” Details of the specific subsets selected were not provided. Unfortunately, the only way that we can reproduce exactly the 237 count from the Pitcher (1975) data is by including a significantly larger area than was used for Dean et al.'s (2000) post-spill survey (Figure 4).
Figure 4.

Pre-oil spill survey of sea otters at NKI, with the survey subsets and data reported by Pitcher (1975). The thick lines delineate the segments totaling a count of 237 sea otters, the value reported in Dean et al. (2000) as a pre-spill baseline count for NKI. The dotted lines delineate the area reported for all post-spill surveys by Dean et al. (2002), Bodkin et al. (2011), and Garshelis and Johnson (2013b). The Pitcher (1975) survey within the dotted lines totaled 105 sea otters, one of the best-available pre-spill estimates of NKI abundance.
The aerial-based Pitcher (1975) survey was conducted by the State of Alaska in 1973–1974 in anticipation of operations of the Trans-Alaska Pipeline explicitly in order to have a baseline estimate of the abundance and distribution of sea otters in PWS in case of oil spills. If one uses the Pitcher (1975) subsets that strictly correspond to the same area surveyed by Dean et al. (2000) and all the subsequent surveys reported in Bodkin et al. (2011), the pre-spill count is 105 (Figure 4).
The only other pre-Exxon Valdez oil spill survey of sea otters in PWS was conducted by the USFWS in 1984–1985 to explore colony relationships with habitat and to update information on sea otters' abundance and distribution (Irons et al. 1988). That document only reports the total sea otter counts for the Knight-Eleanor Island group; however, using the original data from the Irons et al. (1988) survey, Garshelis and Johnson (2013b) derived the estimate for northern Knight Island of 58 sea otters.
While the Irons et al. (1988) survey was closer in time to the oil spill, it was boat-based, whereas the Dean et al. (2000) and Pitcher (1975) surveys were both aerial-based; consequently, we suggest both surveys should be used as the best-available estimates of the pre-spill NKI subpopulation (58 and 105). Obviously, using an incorrect baseline (in the Dean et al. [2000] case, a value that exceeds these best-available estimates by a factor of 2.25x–4.0x) significantly compromises the ability to reliably assess recovery. Moreover, the Dean et al. (2000) baseline value of 237 may even exceed the carrying capacity of the area, in which case recovery could never be attained, and the sea otters would be incorrectly assessed as having been permanently impacted by the oil spill.
Beyond the initial baseline issue is the response of the NKI subpopulation since the spill (Figure 5). The relatively constant numbers during the period of 1993–2001 have often been used to indicate a lack of population growth during the time when the overall western PWS population was growing. However, the more complete data (Bodkin et al. 2011; Garshelis et al. 2013b) indicate a quite different picture: In the first case, concluding that there should have been three more sea otters each year during that selected 8-yr period is problematic considering the range of inter-annual variability (as illustrated in Figure 5). Second, immediately after this selected period, something happened to cause a major reduction in the NKI subpopulation, in which the numbers in 2001 were reduced by half in 2002. However, the NKI subpopulation subsequently increased rapidly, so that by the final date for which data are available (2009), it had tripled, reaching 116 (a value that was more than quadrupled from its lowest point in 2003). The same precipitous decline in numbers was seen in the larger western PWS population between 2001 and 2003, followed by rapid growth (Figure 5). Clearly, there is no plausible way to link this Sound-wide pattern causally to SSOR, so some other stressor(s) must have been involved.
Figure 5.
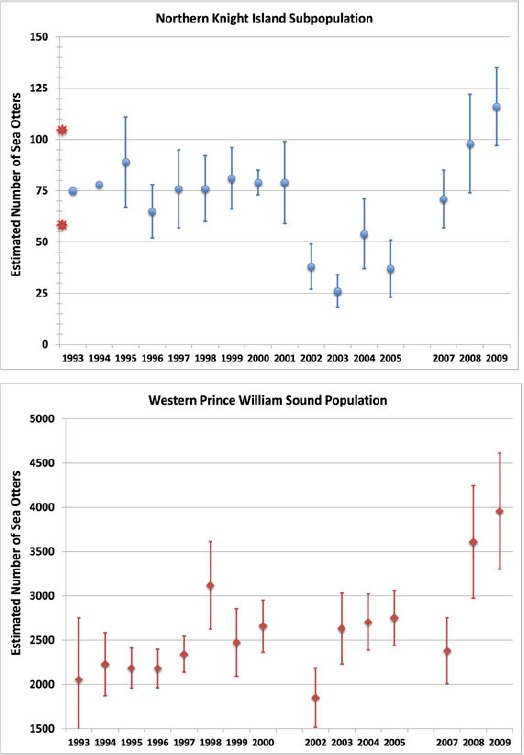
Sea otter abundances at (A) northern Knight Island and (B) western Prince William Sound (WPWS) following EVOS. Data are from Bodkin et al. (2011) based on the aerial surveys that they conducted for the two areas, showing all of the years for which their surveys were reported. Shown are sea otter abundance and standard error (s.e.) values. (No s.e. was reported for NKI in 1993 and 1994 as only a single survey was made during those years; no data were reported for NKI in 2006 or for WPWS in 2001 and 2006.) For comparison, the red stars indicate the two best-available estimates of the pre-oil spill sea otter abundance at NKI: 105 derived from the helicopter-based survey in 1973 by Pitcher (1975); and 58 derived by Garshelis and Johnson (2013b) from the data collected in the 1983–1984 boat-based surveys by Irons et al. (1988). (Color figure available online.)
Ecological recovery of sea otters from the Exxon Valdez oil spill
The conclusions that there was delayed recovery or that long-term effects persist at the northern Knight Island subpopulation (Dean et al. 2000; Bodkin et al. 2002, 2012; Trustees 2010) rely on various combinations of these flawed considerations that derive from misunderstanding or misapplying several crucial ecological risk concepts: (a) an incorrect pre-spill estimate based on using significantly different spatial areas for the surveys before and after the spill; (b) an incorrect pre-spill estimate based on estimates of sea otter casualties from exposure to oiling over a larger area than the immediate vicinity of NKI; (c) pre- and post-spill comparisons made on a subpopulation constituting only about 3% of the western PWS population; (d) essentially flat numbers (∼75) of the NKI subpopulation over an 8-yr period (see estimates in Figure 5 for NKI during 1993–2001) compared to having a net gain of just three additional sea otters each year, a difference lost in the inter-annual variability of that period and a difference easily explained by other factors; (e) focusing only on a selected period of time (1993–2001), whereas a quite different dynamic emerges in the total post-spill record (see estimates in Figure 5 for NKI and the overall western PWS during 2002–2009) that is clearly not attributable to EVOS and that demonstrates much larger-scale forces at play on the sea otter population; (f) recovery objectives based on an overly simplistic interpretation of ecological resilience, while ignoring the other anthropogenic and natural forces acting on sea otters and the PWS ecosystem before and after the oil spill, particularly the PWS sea otter population's ongoing return from complete extirpation several decades previously and the subsequent climate regime shifts that have cascaded throughout the PWS ecosystem; (g) recovery objectives based on a single biochemical marker of exposure, contrary to the NRDA definition of recovery, and focused specifically on a biochemical endpoint that responds to many chemicals occurring in PWS and thus is not diagnostic of petrogenic PAHs.
There are alternative plausible explanations for the observed post-spill dynamics of sea otters at NKI and more broadly throughout PWS. The most plausible and compelling is that supported by our ecological risk assessments and analysis of attributable risks: The NKI subpopulation essentially recovered its pre-spill numbers by the time of the first post-spill survey in 1991, and fluctuations since then are natural variability independent of EVOS. All but one of the stressors caused by EVOS were essentially gone within the first months to few years after the event, and the residual PAH stressors have continued to diminish in the intervening two decades to a point where the remaining risks are exceedingly small. Meanwhile, natural variability continues unabated, but the sea otters of Prince William Sound have long since fully recovered from the Exxon Valdez oil spill.
ACKNOWLEDGMENTS
The authors greatly appreciate the careful reviews and suggestions of the three formal peer reviewers approved by the editors of Human and Ecological Risk Assessment: Don DeAngelis, Chris Teaf, and David Weinstein. We also thank Ms. Allison Zusi-Cobb for her GIS skills and for preparation of the map of Prince William Sound. The authors acknowledge the financial support provided by Exxon Mobil Corporation for the time needed to prepare this article.
Glossary
LIST OF ABBREVIATIONS
- AK
Alaska
- CADDIS
Causal Analysis/Diagnosis Decision Information System
- CERCLA
Comprehensive Environmental Response, Compensation, and Liability Act of 1980
- CL
confidence levels
- CYP1A
Cytochrome P4501A
- Eco-SSL
Ecological Soil Screening Level
- EVOS
Exxon Valdez oil spill
- HOR
heavy oil residues
- HQ
hazard quotient
- IBM
individual-based model
- ITZ
intertidal zone
- LOAEL
lowest-observed-adverse-effects level
- LOR
light oil residues
- MLLW
mean lower low water
- MOR
medium oil residues
- NKI
northern Knight Island
- NOAA
National Oceanic and Atmospheric Administration
- NOAEL
no-observed-adverse-effects level
- NRC
National Research Council
- NRDA
Natural Resources Damage Assessment
- OPA 90
Oil Pollution Act of 1990
- PAHs
polycyclic aromatic hydrocarbons
- PCBs
polychlorinated biphenyls
- ppb
parts per billion
- PWS
Prince William Sound
- SCAT
Shoreline Cleanup and Assessment Technique
- s.e.
standard error
- SSOR
subsurface oil residues
- STZ
subtidal zone
- TPAH
total polycyclic aromatic hydrocarbons
- Trustees
Exxon Valdez Oil Spill Trustees Council
- TRVs
toxicity reference values
- USEPA
U.S. Environmental Protection Agency
- USFWS
U.S. Fish and Wildlife Service
- USGS
U.S. Geological Survey
- VOCs
volatile organic compounds
- WPWS
western Prince William Sound
Footnotes
The Exxon Valdez Oil Spill Trustees Council (Trustees) is a partnership of three State of Alaska agencies (Department of Fish and Game, Department of Environmental Conservation, and Department of Law) and three federal agencies (Department of Commerce [through NOAA's National Marine Fisheries Service], Department of Agriculture [through US Forest Service], and Department of Interior) formed to coordinate damage assessment activities and oversee the restoration of injured resources.
AUTHOR-DIRECTED PEER REVIEW
This manuscript was prepared under HERA's author-directed peer review process, wherein a manuscript's authors nominate proposed peer reviewers to HERA's Managing Editor for approval or revision. The following persons reviewed and approved the publication of this manuscript:
Dr. Donald DeAngelis, theoretical ecology and ecological modeling, U.S. Geological Survey, Department of Biology, University of Miami, Coral Gables, FL, USA
Dr. Christopher Teaf, toxicology and risk assessment, Associate Director, Center for Biomedical and Toxicological Research, Florida State University, Tallahassee, FL, USA
Dr. David A. Weinstein, ecosystems dynamics and responses to stress, Department of Natural Resources, Cornell University, Ithaca, NY, USA
REFERENCES
- Ballachey BE, Bodkin JL. Lingering Oil and Sea Otters: Pathways of Exposure and Recovery Status. Restoration Project 620 Draft Final Report. 2006. April 2006. Exxon Valdez Oil Spill Trustee Council, Anchorage, AK, USA; note: This report is no longer available from the Trustees' website; at some date after the sea otter diving parameters from this report were used for a sensitivity analysis reported in Harwell et al. (2010a), the authors' agency (USGS) has attached this disclaimer: “A portion of this report was based on data recently determined to be unverifiable; it will not be published or released to the public in its current form and therefore should not be cited.”.
- Beyers DW. Causal inference in environmental impact studies. J N Am Benthol Soc. 1998;17:367–73. [Google Scholar]
- Bhatia NP, Szego GP. Stability Theory of Dynamical Systems. New York, NY, USA: Springer-Verlag; 1970. [Google Scholar]
- Bodkin JL, Ballachey BE, Dean TA, et al. Sea otter population status and the process of recovery from the 1989 Exxon Valdez oil spill. Mar Ecol Prog Ser. 2002;241:237–53. [Google Scholar]
- Bodkin JL, Ballachey BE, Esslinger GG. Synthesis of Nearshore Recovery Following the 1989 Exxon Valdez Oil Spill: Trends in Sea Otter Population Abundance in Western Prince William Sound. 2011. Restoration Projects 070808, 070808A, and 090808 Final Report. US Geological Survey, Alaska Science Center, Anchorage, AK, USA.
- Bodkin JL, Ballachey BE, Coletti HA, et al. Long-term effects of the “Exxon Valdez” oil spill: Sea otter foraging in the intertidal as a pathway of exposure to lingering oil. Mar Ecol Prog Ser. 2012;447:273–87. [Google Scholar]
- Boehm PD, Page DS, Neff JM, et al. Potential for sea otter exposure to remnants of buried oil from the Exxon Valdez oil spill. Environ Sci Technol. 2007;41:6860–7. doi: 10.1021/es070829e. [DOI] [PubMed] [Google Scholar]
- Boehm PD, Page DS, Neff JM, et al. Are sea otters being exposed to subsurface intertidal oil residues? Mar Pollut Bull. 2011;62:581–9. doi: 10.1016/j.marpolbul.2010.11.026. [DOI] [PubMed] [Google Scholar]
- Calkins DG. Feeding behavior and major prey species of the sea otter, Enhydra lutris in Montague Strait, Prince William Sound, Alaska. Fish Bull. 1978;76(1):125–31. [Google Scholar]
- CERCLA. Comprehensive Environmental Response, Compensation and Liability Act of 1980. 43CFR11.10. Available at www.ecfr.gov (accessed November 14, 2013) [PubMed]
- Dean TA, Bodkin JL, Jewett SC, et al. Changes in sea urchins and kelp following a reduction in sea otter density as a result of the Exxon Valdez oil spill. Mar Ecol Prog Ser. 2000;199:281–91. [Google Scholar]
- Dean TA, Bodkin JL, Fukuyama AK, et al. Food limitation and the recovery of sea otters following the Exxon Valdez oil spill. Mar Ecol Prog Ser. 2002;241:255–70. [Google Scholar]
- DeAngelis DL, Gross LJ. Individual-Based Models and Approaches in Ecology: Populations, Communities and Ecosystems. New York, NY, USA: Springer-Verlag; 1992. [Google Scholar]
- Doroff AM, Bodkin JL. Sea otter foraging behavior and hydrocarbons in prey. In: Loughlin TR, editor. Marine Mammals and the Exxon Valdez. San Diego, CA, USA: Academic Press; 1994. pp. 193–208. [Google Scholar]
- Doroff AM, Estes JA, Tinker MT, et al. Sea otter population declines in the Aleutian archipelago. J Mamm. 2003;84(1):55–64. [Google Scholar]
- Estes JA. Catastrophes and conservation: Lessons from sea otters and the Exxon Valdez. Science. 1991;254:1596. doi: 10.1126/science.254.5038.1596. [DOI] [PubMed] [Google Scholar]
- Estes JA, Tinker MT, Williams TM, et al. Killer whale predation on sea otters linking oceanic and nearshore ecosystems. Science. 1998;282:473–6. doi: 10.1126/science.282.5388.473. [DOI] [PubMed] [Google Scholar]
- Estes JA, Doak DF, Springer AM, et al. Causes and consequences of marine mammal population declines in southwest Alaska: A food-web perspective. Phil Trans R Soc Lond B. 2009;364:1647–58. doi: 10.1098/rstb.2008.0231. [DOI] [PMC free article] [PubMed] [Google Scholar]
- Estes JA, Stenbeck RS, Lindberg DR. Exploring the consequences of species interactions through the assembly and disassembly of food webs: A Pacific-Atlantic comparison. Bull Mar Sci. 2013;89(1):11–29. [Google Scholar]
- Exxon. Shoreline Cleanup and Assessment Technique (SCAT) II Site Reports. 1989. Available at Alaska Resources Library and Information Service, Anchorage, AK, USA.
- Fox G. Practical causal inference for eco-epidemiologists. J Toxicol Environ Health. 1991;33:359–73. doi: 10.1080/15287399109531535. [DOI] [PubMed] [Google Scholar]
- Galt JA, Payton DL. Movement of oil spilled from the T/V Exxon Valdez. In: Bayha K, Kormendy J, editors. Sea Otter Symposium: Proceedings of a Symposium to Evaluate the Response Effort on Behalf of Sea Otters after the T/V Exxon Valdez Oil Spill into Prince William Sound, Anchorage, Alaska, April 17–19, 1990. Anchorage, AK, USA: US Fish and Wildlife Service; 1990. pp. 4–17. Biological Report 90(12) [Google Scholar]
- Garshelis DL, Garshelis JA. Movements and management of sea otters in Alaska. J Wildlife Manage. 1984;48:665–78. [Google Scholar]
- Garshelis DL, Johnson C. Sea otter population dynamics and the Exxon Valdez oil spill: Disentangling the confounding effects. J Appl Ecol. 2001;38:19–35. [Google Scholar]
- Garshelis DL, Johnson CB. Prolonged recovery of sea otters from the Exxon Valdez oil spill? A re-examination of the evidence. Mar Pollut Bull. 2013a;71:7–19. doi: 10.1016/j.marpolbul.2013.03.027. [DOI] [PubMed] [Google Scholar]
- Garshelis DL, Johnson CB. Sea otters: Trying to see the forest for the trees since Exxon Valdez. In: Wiens JA, editor. Oil in the Environment. Legacies and Lessons of the Exxon Va l dez Oil Spill. Cambridge, UK: Cambridge University Press; 2013b. [Google Scholar]
- Gentile JH, Harwell MA. The issue of significance in ecological risk assessments. Hum Ecol Risk Assess. 1998;4(4):815–28. [Google Scholar]
- Hacking I. An Introduction to Probability and Inductive Logic. Cambridge, UK: Cambridge University Press; 2001. [Google Scholar]
- Hadar J. Mathematical Theory of Economic Behavior. London, UK: Addison-Wesley; 1971. [Google Scholar]
- Hare SR, Mantua NJ. Empirical evidence for North Pacific regime shifts in 1977 and 1989. Prog Oceanogr. 2000;47:103–45. [Google Scholar]
- Harrison OR. Proceedings of the 1991 International Oil Spill Conference. Prevention, Behavior, Control, Cleanup. Washington, DC, USA: American Petroleum Institute; 1991. An overview of the Exxon Valdez oil spill; pp. 313–9. [Google Scholar]
- Harte J. Ecosystem stability and the distribution of community matrix eigenvalues. In: Halfon E, editor. Theoretical Systems Ecology. New York, NY, USA: Academic Press; 1979. pp. 453–65. [Google Scholar]
- Harwell MA, Gentile JH. Ecological significance of residual exposures and effects from the Exxon Valdez oil spill. Integr Environ Assess Manag. 2006;2(3):204–46. doi: 10.1897/1551-3793(2006)2[204:esorea]2.0.co;2. [DOI] [PubMed] [Google Scholar]
- Harwell MA, Gentile JH, Johnson CB, et al. A quantitative ecological risk assessment of the toxicological risks from Exxon Valdez subsurface oil residues to sea otters at Northern Knight Island, Prince William Sound, AK. Hum Ecol Risk Assess. 2010a;16(4):727–61. doi: 10.1080/10807039.2010.501230. [DOI] [PMC free article] [PubMed] [Google Scholar]
- Harwell MA, Gentile JH, Cummins KW, et al. A conceptual model of natural and anthropogenic drivers and their influence on the Prince William Sound, Alaska, ecosystem. Hum Ecol Risk Assess. 2010b;16(4):672–726. doi: 10.1080/10807039.2010.501011. [DOI] [PMC free article] [PubMed] [Google Scholar]
- Harwell MA, Gentile JH, Parker KR. Quantifying population-level risks using an individual-based model: Sea otters, Harlequin Ducks, and the Exxon Valdez oil spill. Integr Environ Manage Assess. 2012;8(3):503–22. doi: 10.1002/ieam.1277. [DOI] [PMC free article] [PubMed] [Google Scholar]
- Harwell MA, Gentile JH, Parker KR. Characterizing ecological risks, significance, and recovery. In: Wiens JA, editor. Oil in the Environment. Legacies and Lessons of the Exxon Valdez Oil Spill. Cambridge, UK: Cambridge University Press; 2013. [Google Scholar]
- Hatfield BB, Marks D, Tinker MT, et al. Attacks on sea otters by killer whales. Mar Mamm Sci. 1998;14:888–94. [Google Scholar]
- Hayes MO, Michel J. Factors determining the long-term persistence of Exxon Valdez oil in gravel beaches. Mar Pollut Bull. 1999;38:92–101. [Google Scholar]
- Hayes MO, Michel J, Betenbaugh DV. The intermittently exposed, coarse-grained gravel beaches of Prince William Sound, Alaska: Comparison with open-ocean gravel beaches. J Coast Res. 2010;26:4–30. [Google Scholar]
- Hill AB. The environment and disease: Association and causation. Proc Royal Soc Med. 1965;58:295–300. doi: 10.1177/003591576505800503. [DOI] [PMC free article] [PubMed] [Google Scholar]
- Hines AH, Loughlin TR. Observations of sea otters digging for clams at Monterey Harbor, California. Fish Bull. 1980;78:159–63. [Google Scholar]
- Integral Consulting, Inc. Exxon Valdez Oil Spill Restoration Project 060783 Final Report. Mercer Island, WA: Integral Consulting, Inc.; 2006. Information Synthesis and Recovery Recommendations for Resources and Services Injured by the Exxon Valdez Oil Spill. Available at http://www.evostc.state.ak.us (accessed November 14, 2013) [Google Scholar]
- Irons DB, Nysewander DR, Trapp JL. Prince William Sound Sea Otter Distribution in Relation to Population Growth and Habitat Type. Anchorage, AK, USA: Alaska Investigations Field Office, Branch of Wetlands and Marine Ecology, US Fish and Wildlife Service; 1988. April 1988. [Google Scholar]
- Johnson CB, Garshelis DL. Sea otter abundance, distribution, and pup production in Prince William Sound following the Exxon Valdez oil spill. In: Butler JN, Hughes JS, editors; Wells PG, editor. Exxon Valdez Oil Spill: Fate and Effects in Alaskan Waters. Philadelphia, PA, USA: American Society for Testing and Materials; 1995. pp. 894–929. ASTM STP 1219. [Google Scholar]
- Josephson J, Josephson S. Abductive Inference. Cambridge, UK: Cambridge University Press; 1996. [Google Scholar]
- Kvenvolden KA, Carlson PR, Threlkeld CN, et al. A possible connection between two Alaskan catastrophes occurring 25 yr apart (1964 and 1989) Geol. 1993;21:813–6. [Google Scholar]
- Kvitek RG, Fukuyama AK, Anderson BS, et al. Sea otter foraging on deep-burrowing bivalves in a California coastal lagoon. Mar Biol. 1988;98:157–67. [Google Scholar]
- Lewis DFV. Guide to Cytochromes P450 Structure and Function. New York, NY, USA: Taylor and Francis; 2001. [Google Scholar]
- Lipscomb TP, Harris RK, Rebar AH, et al. Pathology of sea otters. In: Loughlin TR, editor. Marine Mammals and the Exxon Valdez. San Diego, CA, USA: Academic Press; 1994. pp. 265–280. [Google Scholar]
- Loughlin TR, Ballachey BE, Wright BA. Overview of studies to determine injury caused by the Exxon Valdez oil spill to marine mammals. Proceedings of the Exxon Valdez Oil Spill Symposium. In: Spies RB, Wolfe DA, et al.Rice SD, editors. American Fisheries Society Symposium 18. Bethesda, MD, USA: Anchorage, AK. American Fisheries Society; 1996. pp. 798–808. February 2–5, 1993. [Google Scholar]
- Mantua NJ, Hare SR, Zhang Y, et al. A Pacific interdecadal climate oscillation with impacts on salmon production. Bull Am Meteorol Soc. 1997;78:1069–79. [Google Scholar]
- May RM. Stability and Complexity in Model Ecosystems. 2nd edit. Princeton, NJ, USA: Princeton University Press; 1974. [Google Scholar]
- Mearns AJ. Exxon Valdez shoreline treatment and operations: Implications for response, assessment, monitoring, and research. In: Rice SD, Spies RB, Wolfe DA, et al., editors. Proceedings of the Exxon Valdez Oil Spill Symposium. Bethesda, MD, USA: American Fisheries Society; 1996. pp. 209–328. American Fisheries Society Symposium 18; February 2–5, 1993; Anchorage, AK. [Google Scholar]
- Minobe S. A 50–70 year climatic oscillation over the North Pacific and North America. Geophys Res Lett. 1997;24:683–6. [Google Scholar]
- Mundy P, Olsson P. Climate and weather. The Gulf of Alaska, Biology and Oceanography. In: Mundy PR, editor. Alaska Sea Grant College Program. Fairbanks, AK, USA: University of Alaska; 2005. pp. 25–34. [Google Scholar]
- Munns WR, Jr., Gervais J, Hoffman AA, et al. Modeling approaches to population-level risk assessment. In: Barnthouse LW, Munns WR Jr., Sorensen MT, editors. Population-Level Ecological Risk Assessment. Boca Raton, FL, USA: CRC Press; 2008. pp. 179–210. [Google Scholar]
- Neff JM, Owens EH, Stoker SW, et al. Shoreline oiling conditions in Prince William Sound following the Exxon Valdez oil spill. In: Wells PG, Butler JN, Hughes JS, editors. Exxon Valdez Oil Spill: Fate and Effects in Alaskan Waters. Philadelphia, PA, USA: American Society for Testing and Materials; 1995. pp. 312–45. ASTM STP 1219. [Google Scholar]
- Nickerson RB. A study of the littleneck clam (Protothaca staminea Conrad) and the butter clam (Saxidomus giganteus Deshayes) in a habitat permitting coexistence, Prince William Sound, Alaska. Proceedings National Shellfish Association. 1977;67:85–102. [Google Scholar]
- NOAA (National Oceanic and Atmospheric Administration) Injury Assessment: Guidance Document for Natural Resource Damage Assessment Under the Oil Pollution Act of 1990, the Damage Assessment Remediation and Restoration Program, NOAA, August 1996. 1996. Available at http://www.darrp.noaa.gov (accessed November 14, 2013)
- NOAA. OPA Guidance. 2010. Available at http://www.darrp.noaa.gov (accessed November 14, 2013)
- NRC (National Research Council) The Great Alaska Earthquake of 1964. Biology. Washington, DC, USA: Committee on the Alaska Earthquake. National Academy Press; 1971. [Google Scholar]
- NRC. Untangling Food Webs and Fishing Nets. Washington, DC, USA: National Academy Press; 2003. Decline of the Steller Sea Lion in Alaskan Waters. [Google Scholar]
- O'Clair CE, Short JW, Rice SD. Rice SD, Spies RB, Wolfe DA, et al., editors. Contamination of intertidal and subtidal sediments by oil from the Exxon Valdez in Prince William Sound. Proceedings of the Exxon Valdez Oil Spill Symposium. 1996. pp. 61–94. American Fisheries Society Symposium 18. Bethesda, MD, USA.
- OPA 90 (Oil Pollution Act of 1990) 15CFR990.30. Available at www.ecfr.gov (accessed November 14, 2013)
- Oris JT, Roberts AP. Cytochrome P4501A (CYP1A) as a biomarker in oil spill assessments. In: Wiens JA, editor. Oil in the Environment. Legacies and Lessons of the Exxon Va l dez Oil Spill. Cambridge, UK: Cambridge University Press; 2013. [Google Scholar]
- Overland J, Rodionov S, Minobe S, et al. North Pacific regime shifts: Definitions, issues and recent transitions. Prog Oceanogr. 2008;77:92–102. [Google Scholar]
- Page DS, Boehm PD, Douglas GS, et al. Pyrogenic polycyclic aromatic hydrocarbons in sediments record past human activity: A case study in Prince William Sound, Alaska. Mar Pollut Bull. 1999;38:247–60. [Google Scholar]
- Page DS, Boehm PD, Brown JS, et al. Fate of oil on shorelines. In: Wiens JA, editor. Oil in the Environment. Legacies and Lessons of the Exxon Valdez Oil Spill. Cambridge, UK: Cambridge University Press; 2013. [Google Scholar]
- Parker KR, Wiens JA. Assessing recovery following environmental accidents: Environmental variation, ecological assumptions and strategies. Ecological Applications. 2005;15(6):2037–51. [Google Scholar]
- Paul AJ, Feder HM. Growth, recruitment, and distribution of the littleneck clam, Protothaca staminea, in Galena Bay, Prince William Sound, Alaska. Fish Bull. 1973;71:665–77. [Google Scholar]
- Peterson WT, Schwing FB. A new climate regime in northeast Pacific ecosystems. Geophys Res Lett. 2003;30(17):1896. doi: 10.1029/2003GL017528. [Google Scholar]
- Pitcher KW. Distribution and Abundance of Sea Otters, Steller Sea Lions, and Harbor Seals in Prince William Sound, Alaska. Anchorage, AK, USA: Alaska Department of Fish and Game; 1975. [Google Scholar]
- Shimek SJ, Monk A. Daily activity of sea otters off the Monterey Peninsula, California. J Wildlife Manage. 1977;41(2):277–83. [Google Scholar]
- Short JW, Maselko JM, Lindeberg MA, et al. Vertical distribution and probability of encountering intertidal Exxon Valdez oil on shorelines of three embayments within Prince William Sound, Alaska. Environ Sci Technol. 2006;40:3723–9. doi: 10.1021/es0601134. [DOI] [PubMed] [Google Scholar]
- Stabeno PJ, Bond NA, Hermann AJ, et al. Meteorology and oceanography of the Northern Gulf of Alaska. Cont Shelf Res. 2004;24:859–97. [Google Scholar]
- Stanley KW. Geological Survey Professional Paper 543-J. Washington, DC, USA: US Department of Interior; 1968. Effects of the Alaska Earthquake of March 27, 1964 on Shore Processes and Beach Morphology. [Google Scholar]
- Stephan CE, Mount DI, Hansen DJ, et al. Guidelines for Deriving Numerical National Water Quality Criteria for the Protection of Aquatic Organisms and Their Uses. EPA-PB85-2270-49. Washington, DC, USA: US Environmental Protection Agency; 1985. [Google Scholar]
- Suter GW II. Ecological Risk Assessment, 2nd edit. Boca Raton, FL, USA: CRC Press; 2007. [Google Scholar]
- Suter GW II, Norton SB, Cormier SM. A methodology for inferring the causes of observed impairment in aquatic ecosystems. Environ Toxicol Chem. 2002;21:1101–11. [PubMed] [Google Scholar]
- Taylor E, Reimer D. Oil persistence on beaches in Prince William Sound—A review of SCAT surveys conducted from 1989 to 2002. Mar Pollut Bull. 2008;56(3):458–74. doi: 10.1016/j.marpolbul.2007.11.008. [DOI] [PubMed] [Google Scholar]
- Trites AW, Miller AJ, Maschner HDG, et al. Bottom-up forcing and the decline of Steller sea lions (Eumetopias jabatus) in Alaska: Assessing the ocean climate hypothesis. Fish Oceanogr. 2007;16(1):46–67. [Google Scholar]
- Trustees (Exxon Valdez Oil Spill Trustees Council) Injured Resources and Services 2010 Update. 2010. Exxon Valdez Oil Spill Trustee Council, Anchorage, AK. Available at http://www.evostc.state.ak.us (accessed November 14, 2013)
- USEPA (US Environmental Protection Agency) Framework for Ecological Risk Assessment. EPA/630/R-92/001. Washington, DC, USA: USEPA Risk Assessment Forum; 1992. Available at www.epa.gov/risk (accessed November 14, 2013) [Google Scholar]
- USEPA. Guidelines for Deriving Site-Specific Sediment Quality Criteria for the Protection of Benthic Organisms. EPA-822-R-83-017. Washington, DC, USA: USEPA Office of Science and Technology; 1993. [Google Scholar]
- USEPA. Guidelines for Ecological Risk Assessment. EPA/630/R-95/002F. Washington, DC, USA: USEPA Risk Assessment Forum; 1998. Available at http://www.epa.gov/risk (accessed November 14, 2013) [Google Scholar]
- USEPA. Guidance for Developing Ecological Soil Screening Levels. OSWER Directive 9285.7-55. Washington, DC, USA: USEPA Office of Solid Waste and Emergency Response; 2005. [Google Scholar]
- USEPA. Interim Final. OSWER Directive 9285.7-78. Washington, DC, USA: USEPA Office of Solid Waste and Emergency Response; 2007. Ecological Soil Screening Levels for Polycyclic Aromatic Hydrocarbons. [Google Scholar]
- USEPA. Causal Analysis/Diagnosis Decision Information System (CADDIS) Washington, DC, USA: USEPA Office of Research and Development; 2010. Available at www.epa.gov/caddis (accessed November 14, 2013) [Google Scholar]
- USFWS (US Fish and Wildlife Service) Endangered and Threatened Wildlife and Plants; Determination of Threatened Status and Special Rule for the Southwest Alaska Distinct Population Segment of the Northern Sea Otter (Enhydra lutris kenyoni) Washington, DC, USA: Government Printing Office; 2005. Final Rule. 50 CFR Part 17. Federal Reg 70 FR 46366. [Google Scholar]
- USFWS. Endangered and Threatened Wildlife and Plants; Notice of Availability of Draft Recovery Plan for the Southwest Alaska Distinct Population Segment of the Northern Sea Otter. Washington, DC, USA: Government Printing Office; 2010. Federal Reg 75 FR 62562. [Google Scholar]
- Vos DJ, Quakenbush LT, Mahoney BA. Documentation of sea otters and birds as prey for killer whales. Mar Mamm Sci. 2006;22:201–5. [Google Scholar]
- Williams TM, Estes JA, Doak DF, et al. Killer appetites: Assessing the role of predators in ecological communities. Ecology. 2004;85(12):3373–84. [Google Scholar]
- Wolf RC, Gelwick FP, Weltz F, et al. Foraging behavior and prey of sea otters in a soft- and mixed-sediment benthos in Alaska. Mamm Biol. 2012;77:271–80. [Google Scholar]
- Wooley C. The myth of the “pristine environment”: Past human impacts in Prince William Sound and the Northern Gulf of Alaska. Spill Sci Tech Bull. 2002;7(1–2):89–104. [Google Scholar]