Abstract
Intramural measurements of Vm and are important in the studies of cardiac arrhythmias and defibrillation. We developed a new design of an “optrode” (bundle of optical fibers) for use in intramural cardiac mapping. The optrodes are made from seven optical fibers with the fiber ends polished at 45° angle and coated with mirror surfaces. The optrodes are enclosed in smooth epoxy resin cast, which protects mirror surfaces from damage and ensures constant optrode diameter along its length. The optrodes are strong enough to be easily inserted into heart muscle, can be reused multiple times, and they may reduce artifacts in the measurements of the effects of defibrillation shocks on Vm.
Index Terms: Membrane potential, optical fibers, optical mapping, transmural activation
I. Introduction
Intramural optical mapping of Vm and Cai2+ is important in the studies of mechanisms of cardiac arrhythmias and defibrillation. A traditional approach to intramural optical measurements employs isolated coronary-perfused preparations of ventricular wall (so-called “wedge” preparations), in which Vm and are mapped on the transmural cut tissue surface [1]–[3]. This approach has several important limitations. A major limitation is that wedge preparations do not support ventricular fibrillation, which can be induced only in whole hearts. Also, because of the cutting of blood vessels, tissue perfusion near the cut surface might be nonuniform leading to nonuniformities in electrophysiological tissue properties. These limitations motivated the development of another approach to intramural optical measurements, which employs bundles of optical fibers (optrodes) that can be used in whole hearts. Previously, two optrode designs were proposed. In the first design, bundles of optical fibers are enclosed in a glass tube [4], [5]. A disadvantage of this design is the use of fibers with small diameter to compensate for added thickness of the protective glass tube, which reduces light-collection efficacy and signal quality. In another design, fibers of a larger diameter were used without glass tube enclosure to provide a larger light output and sufficient mechanical strength for insertion into the heart muscle [6], [7]. The second design ensures better signals under equivalent conditions, but it has its own shortcomings. First, because fibers are exposed to environment, they can be damaged and the fiber bundle may lose its tight packing. Second, when electrical shocks are applied, the exposed fiber ends may represent a substrate for the formation of so-called “secondary sources” of polarization [8], [9]. Here, we propose a new optrode design that combines positive features of two previous designs. First, it employs optical fibers with relatively large diameter. Second, the fiber bundle is enclosed into a thin transparent cylindrical envelope made of epoxy resin without increasing the overall bundle diameter. To ensure light delivery into the tissue, fiber ends are polished at 45° angle and coated with reflective mirror surfaces.
II. Optrode Preparation
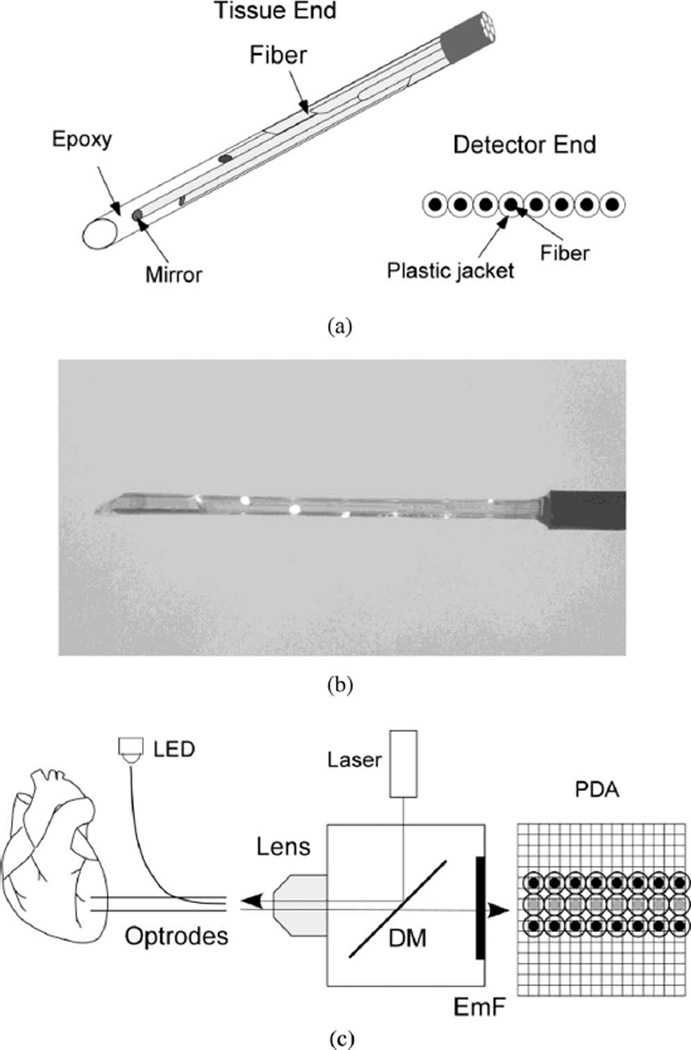
Optrodes were made from silicon fibers with an outer diameter of 325 µm, core diameter of 300 µm, and numerical aperture of 0.39 (FT-300-UMT, Thorlabs, Inc.). On one end, fibers were stripped of protective plastic jackets. A bundle of seven fibers arranged in a hexagonal pattern and held together with a heat-shrink tube was polished at approximately 45° to the fiber axis using lapping paper (LFG5P, LFG3P, and LFG1P, Thorlabs, Inc.). After polishing, fiber ends were coated with mirror surfaces by applying a silvering solution (HE-300, Peacock Laboratories, Inc.) diluted 1:30 in water for 60 s. Mirror coating was required to assure efficient light reflection at approximately 90° angle to the fiber axis. Individual fibers in the bundle were arranged with fiber ends separated by a distance of 2 mm. Fibers were individually rotated so that the mirrored surface of each fiber was facing toward the bundle center [see Fig. 1(a)] ensuring that light delivered by the fiber was reflected in the direction away from the bundle center.
Fig. 1.
New optrode design. (a) Schematic drawing of fiber arrangement at the optrode tissue end and the detector end. (b) Image of the optrode tissue end with light shined into the optrode detector end. The light is reflected frommirror surfaces at fiber ends. (c) Schematic diagram of the optical system. LED: light emitting diode; DM: dichroic mirror; EmF: emission filter; PDA: photodiode array. Black circles: recording optical fibers; gray circles: intermediate fibers.
To enclose the optrode with a smooth transparent envelope, the optrode was inserted into an ~2 cm piece of heat shrink tube with an inside diameter of 1 mm. A low-viscosity epoxy resin (#30-005, MAS Epoxies, Inc.) was mixed 2:1 with a hardener (#30-352, MAS Epoxies, Inc.) and injected into the distal end of the tube using a syringe with an 18-gauge needle. The epoxy-enclosed fiber bundle was cured first in an oven heated to 80°C for 1 h and then at room temperature for 48 h. Then the shrink tube was stripped from the optrode with a sharp razor blade leaving optrode enclosed in a cylindrical transparent epoxy envelope [see Fig. 1(b)]. The diameter of such optrode is approximately equal to the diameter of the fiber bundle in its widest portion (975 µm).
The distal end of the epoxy shaft was cut 2–3 mm beyond the longest optical fiber and sharpened with a razor blade to allow easy optrode insertion into cardiac muscle. In some optrodes, an additional optical fiber polished at 90° angle was added to the optrode and fixed 2 mm above the proximal fiber by a piece of heat-shrink tube. This fiber was used to record optical signals from the heart surface. It also provided a reference point for determining recording depths for other fibers.
At the other optrode end (detector end), the protective plastic jackets with an outer diameter of 650 µm were kept intact. The fibers were polished perpendicular to the fiber axis and arranged in a row [see Fig. 1(a)].
In addition to the new optrode design, optrodes were made according to the older (standard) design [6], [7] with eight fibers arranged in a row on the detector end. The detector ends of both the new and the standard optrodes were arranged in a 3 × 8 array [see Fig. 1(c)]. An intermediate row of fibers was also included. On the other end, these intermediate fibers were assembled in a tight bundle and temporarily attached to an LED for the alignment of the optrodes with a photodiode array (see below). Alternatively, the intermediate bundle was disassembled and individual fibers were immersed into a fluorescent dye solution to measure optical crosstalk (see below). The detector end of the 3 × 8 optrode array was projected onto a 16 × 16 photodiode array (Hamamatsu Corporation) using a 5× lens (Carl Zeiss). Fluorescence measurements were performed using previously described epifluorescent optical setup [7] with few modifications including a 532-nm laser (Verdi V-5, Coherent, Inc.) for fluorescence excitation. Signals were passed through antialiasing low-pass analog filters with 0.5-kHz corner frequency and digitized at 1-kHz sampling rate. To precisely align the optrode array and the photodiode array, they were mounted on XYZ micropositioners. Light pulses from an LED were sent through the intermediate row of fibers, and the positions of the optrode arrays, the lens, and the photodiode array were adjusted until the recorded signals were maximized. Because of the presence of protective plastic jackets, each optical fiber was separated from its neighbors by a 650-µm distance ensuring that photodiodes imaging individual fibers were separated by a nonimaging photodiode. Optical crosstalk between fibers was examined by several methods. In the first method, the most distal fiber of an optrode was immersed into a 6-µmol/L solution of fluorescent dye rhodamine. The crosstalk was measured as the ratio of signals recorded by photodiodes corresponding to the nonimmersed fibers and the signal recorded by the photodiode corresponding to the immersed fiber. The same test was performed by immersing individual fibers from the intermediate alignment fiber row into the rhodamine solution. In another method, a whole optrode was immersed in the rhodamine solution while signals were measured in photodiodes imaging the other optrode. All these measurements demonstrated a complete absence of optical crosstalk between recording channels.
III. Optrode Performance
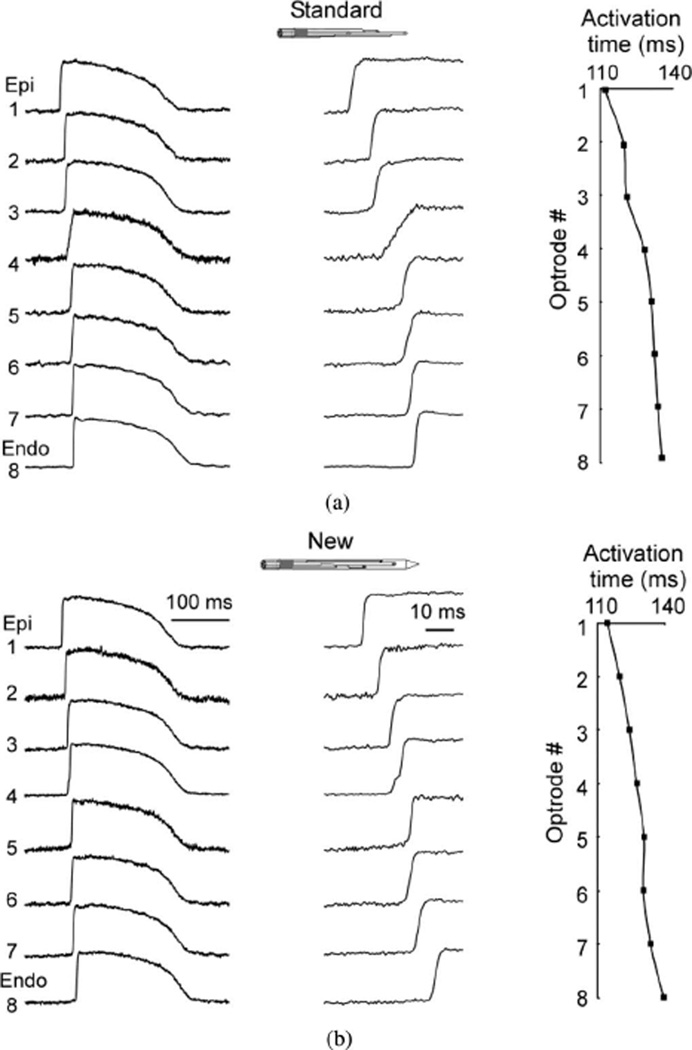
Optrode performance was examined in fluorescence measurements of membrane potential (Vm) in preparations of several types including coronary-perfused wedge preparations of porcine left ventricle (n = 3), canine right ventricle (n = 2), as well as isolated Langendorff-perfused porcine whole heart (n = 1). All preparations were perfused with Tyrodes’ solution, as previously described [1], [7]. Muscle contractions were halted using Blebbistatin (20 µmol/L, Tocris Bioscience). Preparations were stained with Vm-sensitive dye RH-237 (1.25 mg diluted in 0.5 mL of dimethyl sulfoxide) by a bolus injection into the bubble trap. Fig. 2 compares intramural action potentials recorded using the standard optrode [see Fig. 2(a)] and the new optrode [see Fig. 2(b)] during pacing at a cycle length of 500 ms in a porcine left ventricular wedge preparation. All traces shown in this and other figures are raw recordings without digital filtration or averaging. The tissue was paced on epicardium near the standard optrode insertion site via bipolar silver electrode. Both optrodes measured similar profiles of intramural activation, which started on epicardium and spread to endocardium. Traces of Vm upstrokes on a larger time scale demonstrated that some upstrokes [e.g., at site [4] in Fig. 2(a)] were slower than at other sites corresponding to slower conduction in that area. The quality of signals was quantified as the ratio between the amplitude of an action potential and the rms noise (SNrms). For the standard and the new optrodes, the mean SNrms of traces shown in Fig. 2 was 72 ± 29 and 94 ± 55, respectively. The average SNrms values obtained from six preparations were 94 ± 18 and 60 ± 19 for the standard and the new optrodes, respectively.
Fig. 2.
Intramural recordings of membrane potential (Vm) using (a) standard and (b) new optrodes. Both panels show traces of intramural Vm (left) action potential upstrokes at high time resolution (middle), and activation time profiles (right) during pacing with cycle length of 500 ms. Epi: epicardium; Endo: endocardium.
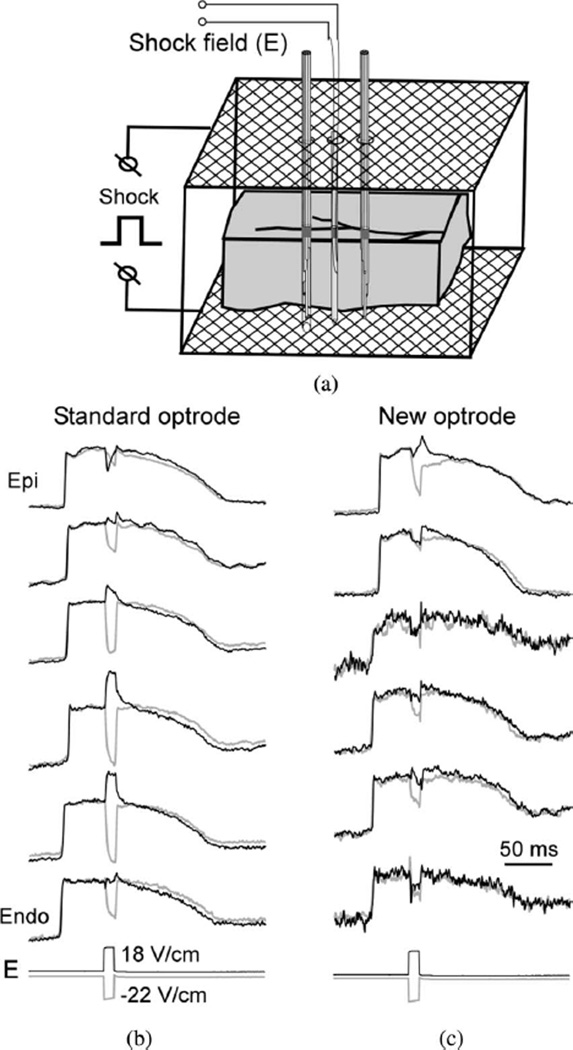
To examine the role of the optrode design in the measurements of shock-induced polarizations, electrical shocks were applied across ventricular wall via two mesh electrodes, which were parallel to the epicardial and endocardial surfaces [see Fig. 3(a)]. Such electrode orientation was used to generate shocks with field direction parallel to the optrode axis in order to eliminate “secondary sources” formed at the optrode shaft when the field is not parallel with the shaft [9]. Two optrodes were inserted into the muscle perpendicular to the epicardium through two small holes separated by ~8 mm on the epicardial mesh electrode. A plunge needle was inserted between two optrodes to measure intramural shock field strength. Fig. 3(b) and (c) shows shock-induced polarizations caused by ~20-V/cm shocks of opposite polarities applied during the action potential plateau. Both optrodes registered significant polarizations at the majority of intramural locations. However, the amplitude and even the polarity of polarizations recorded by the two optrodes at the same tissue depths were different. For the standard optrode [see Fig. 3(a)], the ΔVm magnitude was highly variable ranging between approximately −100% and 50% of action potential amplitude (APA) at different locations. In most cases, the sign of ΔVm was reversed with changing of the shock polarity. For the new optrode, the magnitudes of ΔVm were smaller than for the standard optrode ranging between approximately −67% and 6% APA. This difference in ΔVm magnitudes can be explained by the presence of exposed fiber ends in the old optrode that form a substrate for formation of shock-induced ΔVm (see below).
Fig. 3.
Intramural measurements of shock-induced Vm changes. (a) Schematic diagram showing a wedge preparation, optrodes, and shock electrodes. (b) Intramural Vm recorded by the standard optrode during the application of two shocks of opposite polarity. E: recordings of intramural shock field strength. (c) Intramural Vm recorded using the new optrode.
Small polarizations measured by the new optrode did not change their polarity when the shock polarity was reversed at the majority of intramural locations. This is consistent with previous optical measurements of shock-induced polarizations on the cut transmural surface in left ventricular wedge preparations [1] and measurements obtained noninvasively in isolated right ventricular preparations [10]. Such ΔVm could represent secondary sources of polarization formed by microscopic discontinuities in the tissue structure.
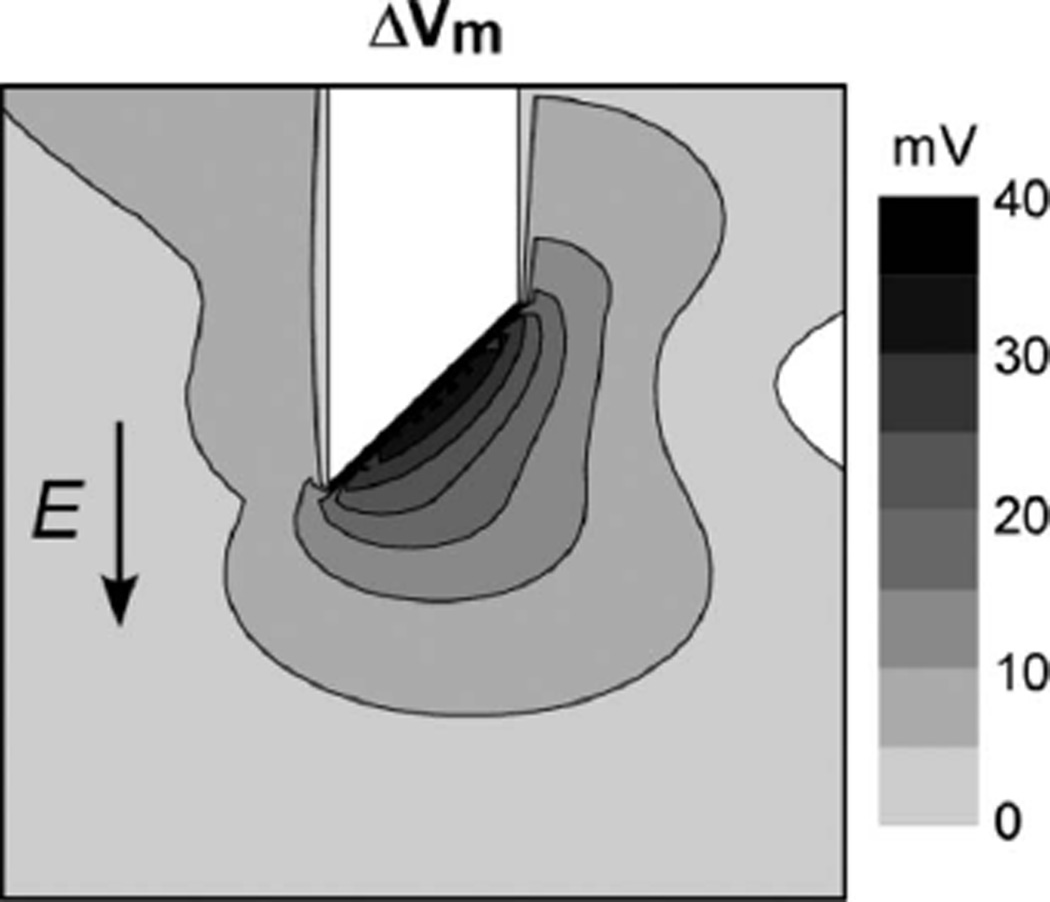
Assuming that the intramural shock field was similar for both optrodes, the differences in shock-induced polarizations could be due to the difference in the geometry between the new and the standard optrode, namely, due to the presence of exposed fiber ends in the standard optrode. To assess the role of exposed fiber ends in shock effects, shock-induced Vm changes were computed in a 3-D bidomain model of cardiac tissue. Fig. 4 shows an isopotential map of shock-induced ΔVm near the tip of one cylindrical fiber with a diameter of 320 µm, which was cut at its end at a 45° angle. Such fiber represents one of the optical fibers in the standard optrode. A shock with strength of 10 V/cm was applied in the direction parallel to the fiber axis. The fiber end was far from the tissue boundaries so that no polarizations were detected at this location without the fiber. The shock produced a maximal ΔVm at the fiber end of ~38 mV, which was ~17% of the maximal ΔVm measured at the tissue surface (not shown). Reversing the shock polarity reversed the sign of shock-induced ΔVm. Simulations of the new optrode demonstrated no shock-induced polarizations at the same location (data not shown). Therefore, the observed differences in measured shock responses between the two optrodes can be attributed to the presence of exposed fiber ends in the standard optrode.
Fig. 4.
Bidomain simulations of shock-induced Vm changes (ΔVm) produced by tip of an optical fiber. Fiber diameter = 320 µm; E = 10 V/cm.
The standard optrodes could be used in 5–8 experiments before they were discarded. The main reason for the limited optrode longevity was fiber separation due to tissue debris and dry salt accumulating between the fibers. Also, individual fibers could become damaged during insertion. These issues were not relevant for the new smooth optrodes of the second design. Most optrodes of this design are still in use after ~10 experiments.
IV. Discussion
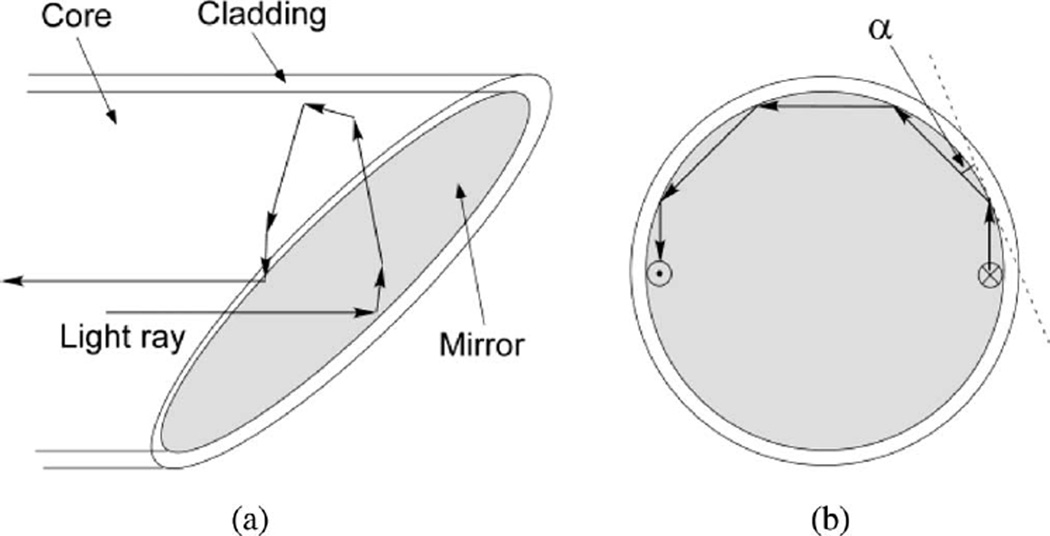
The optrode technology allows simultaneous multisite intramural measurements of Vm in whole hearts. Here, we present a new optrode design, which combines sufficiently high signal quality with increased longevity and reduced artifacts in measurements of shock-induced polarizations. In comparison to the previous optrode design [7], measurements with the new optrodes have approximately 30% smaller SNR, which should be acceptable for the majority of applications, especially taking into account the optrode longer life time. One reason for smaller signals in the new optrode design could be the smaller interrogation tissue volume of the new optrode (see below). Another possible reason is that some rays of excitation light can be reflected back into the fiber by the mirror surface. Fig. 5 exemplifies a path of one such light ray, which travels near the edge of the fiber parallel to the fiber axis. This ray is reflected by the mirror perpendicular to the fiber axis [Fig. 5(a)]. Because it is close to the fiber edge, it hits the cladding at an angle (α) smaller than the critical angle for total internal reflection [Fig. 5(b)]. Therefore, it travels inside the fiber along its circumference until it is reflected by the mirror again and travels back into the fiber. Although it is not clear how much light is reflected back in such fashion, this factor may partially explain smaller fluorescent signals measured by the mirrored fibers in comparison to the flat-cleaved fibers in which all light rays reaching the fiber end enter the tissue.
Fig. 5.
Schematic diagram showing the path of an excitation light ray reflected back into the fiber.
An important characteristic of optical recordings is the dimensions of the tissue volume from which fluorescent light is collected. These dimensions depend on multiple factors including fiber diameter and geometry, absorptive and scattering tissue properties, light wavelength, etc. Computer simulations of light propagation in cardiac tissue stained with RH-237 dye using a Monte Carlo model showed that when fluorescence was excited by a laser beam with a diameter of 200 µm, 80% of the fluorescence signal was collected from a tissue depth of about 600 µm [11]. It was also shown that the collection depth was only moderately increased (by about 16%) when the beam diameter was increased fivefold. In both cases, the diameter of the fluorescence collection volume was approximately equal to the laser beam diameter. Tissue illumination by a laser beam is similar to illumination via a standard optical fiber. Therefore, results of these simulations can be used to estimate dimensions of the fluorescence collection volume for the standard optrode used in the present work. For the optrode with 300-µm fibers, the estimated depth and diameter of the fluorescence collection volume in cardiac tissue stained with RH-237 are about 620 and 300 µm, respectively.
Regarding the new optrode design, results of another study [12] demonstrated that the tissue depth from which 80% of the fluorescent light was collected was approximately 15% smaller for the optical fiber cleaved at a 45° angle in comparison to the standard flat-cleaved fiber. Extrapolating these data to optrodes used in the present work, it is estimated that the depth and the diameter of fluorescence collection volume for the new optrode are about 530 and 300 µm, respectively. This lower fluorescence collection depth may partially explain the smaller SNR of the new optrode in comparison with the old one.
The main advantage of the new optrode design is in its potential use for measurements of intramural shock-induced Vm changes, which are important in the studies of defibrillation mechanism [1]. An essential requirement for these measurements is that the optrode itself does not produce ΔVm. However, computer simulations showed that exposed fiber ends in the old optrode design created substrates for ΔVm formation even when shock field was parallel to the optrode axis (see Fig. 4). Such substrates are absent in the new optrode design, which explains significantly smaller polarizations measured by the new optrode in comparison to the old optrode (see Fig. 3).
The intramural shock-induced ΔVm measured by the new optrode typically did not change their polarity when the shock polarity was changed. Similar phenomenon was observed in the measurements of shock-induced ΔVm in wedge preparations using optical mapping from the cut transmural surface [1]. It was hypothesized that such ΔVm are caused by discontinuities in the microscopic tissue structure combined with the negatively asymmetric response of Vm to shock field [1], [13]. Preliminary measurements obtained with the new optrode are consistent with this hypothesis. It should be noted, however, that secondary sources caused by the optrode itself cannot be completely excluded even in measurements with the new optrode because the optrode shaft can be a source of secondary sources [9]. Such secondary sources can be eliminated only when the shock field is parallel with the optrode axis. Therefore, reliable measurements of intramural shock-induced polarizations using optrodes should be combined with multisite measurements of intramural shock field, which is the subject of future studies.
Acknowledgment
The authors would like to thank Frank Vance for technical support.
This work was supported in part by the National Institutes of Health under Grant HL067748.
Biographies

Wei Kong received the B.E. degree in biomedical engineering and the B.A. degree in English from Tianjin University, Tianjin, China, in 1998, and the M.S. and Ph.D. degrees in biomedical engineering from the University of Alabama, Birmingham, in 2000 and 2005, respectively.
He is currently a Research Associate in the Department of Biomedical Engineering, University of Alabama. His research interests include optical mapping of membrane potential and intracellular calcium in cardiac arrhythmias.

Andrew E. Pollard received the B.S., M.S., and Ph.D. degrees in biomedical engineering from Duke University, Durham, NC, in 1983, 1985, and 1988, respectively.
He currently is a Professor of Biomedical Engineering at the University of Alabama, Birmingham. His research interests include the study of cardiac arrhythmias, with particular emphasis on numerical modeling and experimental mapping.

Vladimir G. Fast received the M.S. degree in physics and the Ph.D. degree in biophysics from the Moscow Institute for Physics and Technology, Moscow, Russia, in 1983 and 1986, respectively.
From 1986 to 1990, he was a Research Associate at the Institute of Biological Physics, Soviet Academy of Sciences, Moscow, and from 1990 to 1997, in the Department of Physiology, University of Berne, Berne, Switzerland. He is currently an Associate Professor in the Department of Biomedical Engineering, University of Alabama, Birmingham. His research interests include mechanisms of cardiac arrhythmias, defibrillation, optical mapping of membrane potential, and intracellular calcium.
Contributor Information
Wei Kong, Department of Biomedical Engineering, University of Alabama, Birmingham, AL 35294 USA.
Andrew E. Pollard, Department of Biomedical Engineering, University of Alabama, Birmingham, AL 35294 USA
Vladimir G. Fast, Department of Biomedical Engineering, University of Alabama, Birmingham, Birmingham, AL 35294 USA (vfast@uab.edu)
References
- 1.Fast VG, Sharifov OF, Cheek ER, Newton JC, Ideker RE. Intramural virtual electrodes during defibrillation shocks in left ventricular wall assessed by optical mapping of membrane potential. Circulation. 2002 Aug.vol. 106:1007–1014. doi: 10.1161/01.cir.0000027103.54792.9c. [DOI] [PubMed] [Google Scholar]
- 2.Laurita KR, Katra RP. Delayed after depolarization-mediated triggered activity associated with slow calcium sequestration near the endocardium. J. Cardiovasc. Electrophysiol. 2005 Apr.vol. 16:418–424. doi: 10.1046/j.1540-8167.2005.40429.x. [DOI] [PubMed] [Google Scholar]
- 3.Wilson LD, Jeyaraj D, Wan X, Hoeker GS, Said TH, Gittinger M, Laurita KR, Rosenbaum DS. Heart failure enhances susceptibility to arrhythmogenic cardiac alternans. Heart Rhythm. 2009 Feb.vol. 6:251–259. doi: 10.1016/j.hrthm.2008.11.008. [DOI] [PMC free article] [PubMed] [Google Scholar]
- 4.Hooks DA, LeGrice IJ, Harvey JD, Smaill BH. Intramural multisite recording of transmembrane potential in the heart. Biophys. J. 2001 Nov.vol. 81:2671–2680. doi: 10.1016/S0006-3495(01)75910-3. [DOI] [PMC free article] [PubMed] [Google Scholar]
- 5.Caldwell BJ, Legrice IJ, Hooks DA, Tai DC, Pullan AJ, Smaill BH. Intramural measurement of transmembrane potential in the isolated pig heart: Validation of a novel technique. J. Cardiovasc. Electrophysiol. 2005 Sep.vol. 16:1001–1010. doi: 10.1111/j.1540-8167.2005.40558.x. [DOI] [PubMed] [Google Scholar]
- 6.Byars JL, Smith WM, Ideker RE, Fast VG. Development of an optrode for intramural multisite optical recordings of Vm in the heart. J. Cardiovasc. Electrophysiol. 2003 Nov.vol. 14:1196–1202. doi: 10.1046/j.1540-8167.2003.03203.x. [DOI] [PubMed] [Google Scholar]
- 7.Kong W, Fakhari N, Sharifov OF, Ideker RE, Smith WM, Fast VG. Optical measurements of intramural action potentials in isolated porcine hearts using optrodes. Heart Rhythm. 2007 Nov.vol. 4:1430–1436. doi: 10.1016/j.hrthm.2007.07.002. [DOI] [PMC free article] [PubMed] [Google Scholar]
- 8.Plonsey R, Barr RC. Inclusion of junction elements in a linear cardiac model through secondary sources: application to defibrillation. Med. Biol. Eng. Comput. 1986 Mar.vol. 24:137–144. doi: 10.1007/BF02443926. [DOI] [PubMed] [Google Scholar]
- 9.Langrill DM, Roth BJ. The effect of plunge electrodes during electrical stimulation of cardiac tissue. IEEE Trans. Biomed. Eng. 2001 Oct.vol. 48(no. 10):1207–1211. doi: 10.1109/10.951525. [DOI] [PubMed] [Google Scholar]
- 10.Caldwell BJ, Wellner M, Mitrea BG, Pertsov AM, Zemlin CW. Probing field-induced tissue polarization using transillumination fluorescent imaging. Biophys. J. 2010 Oct.vol. 99:2058–2066. doi: 10.1016/j.bpj.2010.07.057. [DOI] [PMC free article] [PubMed] [Google Scholar]
- 11.Ding L, Splinter R, Knisley SB. Quantifying spatial localization of optical mapping usingMonte Carlo simulations. IEEE Trans. Biomed. Eng. 2001 Oct.vol. 48:1098–1107. doi: 10.1109/10.951512. [DOI] [PubMed] [Google Scholar]
- 12.Tai DC, Hooks DA, Harvey JD, Smaill BH, Soeller C. Illumination and fluorescence collection volumes for fiber optic probes in tissue. J. Biomed. Opt. 2007 May-Jun;vol. 12:034033-1–034033-12. doi: 10.1117/1.2750288. [DOI] [PubMed] [Google Scholar]
- 13.Cheek ER, Sharifov OF, Fast VG. Role of microscopic tissue structure in shock-induced activation assessed by optical mapping in myocyte cultures. J. Cardiovasc. Electrophysiol. 2005 Sep.vol. 16:991–1000. doi: 10.1111/j.1540-8167.2005.40342.x. [DOI] [PubMed] [Google Scholar]


