Abstract
Objectives:
The objective of the following study is to evaluate the effect of reducing tube voltage from 120 to 100 kVp using prospective gating 320 row multi-detector computed tomography angiography on image quality and reduction in radiation dose.
Materials and Methods:
A total of 78 sequential patients were scanned with prospective electrocardiogram gating. A total of 45 patients (Group 1) with mean body mass index (BMI) 29 ± 2 and heart rate (HR) 57 ± 7 beats per minute (BPM) were scanned at 120 kVp. 33 patients (Group 2) with mean BMI 23 ± 3 and HR 58 ± 6 bpm were scanned at 100 kVp. Effective dose was calculated using dose length product and factor (k = 0.014). Quantitative assessment of image quality was calculated by measuring signal to noise ratio (SNR) and contrast to noise ratio (CNR) in the left ventricle and left main coronary artery. Two experienced cardiac radiologists using a three-point ordinal scale assessed subjectively image quality.
Results:
In Group 1, the median radiation dose was 5.31 mSv (95% confidence interval [CI]: 4.86-6.09) and for Group 2 (P = 0.009) the mean radiation dose was 3.71 mSv (95% CI: 2.76-4.87), representing 30% decrease in radiation dose. In multivariate analyses, adjusting for age, gender, HR, BMI, tube current and scan length, an absolute median reduction of 2.21 mSv (1.13-3.29 mSv) was noted in patients scanned with 100 kVp (P < 0.0001). The quantitative image quality (SNR and CNR) was not statistically significant between the groups. Subjective image quality was rated as good or excellent in 99% of coronary segments for both groups (P value was considered as non-significant).
Conclusion:
Our study suggests that radiation dose may be lowered from 120 to 100 kVp with preservation of image quality in patient's whose BMI is ≤27.
Keywords: Dose reduction, image quality, multi-detector computed tomography angiography, tube voltage
INTRODUCTION

According to the American Heart Association (AHA), a coronary event occurs every 34 s and death from heart related events occur every minute in the US.[1] In their 2010 heart disease and stroke update, the AHA reported the managing and treating cost of coronary artery disease (CAD) to be 503.2 billion dollars of the total health care budget.[2,3] Multi-detector computed tomography angiography (MDCTA) offers accurate diagnostic method for CAD; however, radiation exposure and image quality limit its routine use.[4,5]
Advancements in CT technology have produced 320 row detector scanners that capture the heart in a single beat with shorter acquisition times, eliminate mis-registration artifacts and require lower radiation level.[6,7,8] Scanning protocols such as prospective versus retrospective gating, heart rate (HR) control with beta blockers, tube current modulation, selection of appropriate tube current (mA) based on body mass index (BMI), lower tube voltage (kVp) and restriction of volume scan length based on heart length are known to reduce radiation exposure and improve image quality in MDCTA.[9,10,11,12,13,14,15,16,17,18]
Tube voltage (kVp) is a scan parameter with exponential relationship to radiation exposure, which determines image quality.[12] Lowering tube voltage decreases photon energy causing greater absorption by iodinated contrast media, thus increasing contrast between the artery lumen and surrounding tissue.[12,19,20] Lowering kVp also increases image noise (IN).[20] Previous studies using electrocardiogram (ECG)-gated coronary CT angiography have demonstrated that lowering tube voltage reduces radiation[21] dosage without compromising image quality.[19,20,22,23] However, despite favorable diagnostic accuracy of the newer generation MDCTA scanners, the associated radiation exposure limits their use. The purpose of this study is to determine the effects of the lower tube voltage (100 vs. 120 kVp) on image quality and radiation dose using prospective gating 320 row MDCT scanner.
MATERIALS AND METHODS
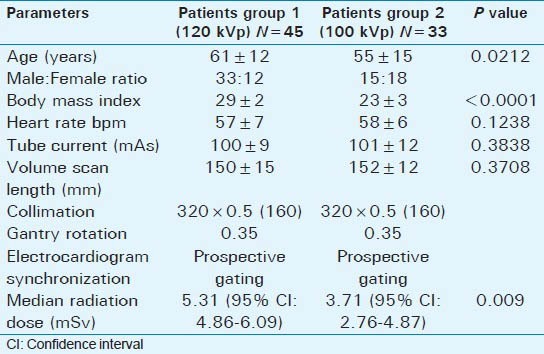
Informed consent was waived by the Institutional review board[24] for this approved retrospective study in which we reviewed medical charts of 78 sequential scanned patients referred for MDCTA for various clinical symptoms. Patients with BMI ≥27 were scanned at 120 kVp and those with <27 BMI were scanned using 100 kVp. Oral beta-blockers (metoprolol) were not routinely administered, but were selectively given to patients with irregular or elevated HR to achieve HR below 65 beats per minute (bpm) prior to scanning. 45 patients (75% male, mean age 61 ± 12 years, mean BMI 29 ± 2 and mean HR 57 ± 7 bpm) were scanned at 120 kVp (Group 1) and 33 patients (45% male, mean age 55 ± 15 years, mean BMI 23 ± 3 and mean HR 58 ± 6 bpm) were imaged at 100 kVp (Group 2) [Table 1]. All patients received 0.4 mg nitroglycerine sublingually prior to scanning to dilate coronary arteries unless contraindicated.
Table 1.
Patient characteristics and median radiation dose (mSv)
Scanning protocol
All MDCTA scans were performed with a 320-row scanner (Aquilion ONE, Toshiba, Tokyo, Japan). These examinations were supervised by a cardiovascular imaging fellowship trained radiologist. Calcium scanning was performed using prospective ECG-triggering over a single heart beat with a gantry rotation and X-ray exposure time of 0.35 s, 0.5 mm slice collimation, peak tube voltage of 120 kV, tube current setting of 100 mA and reconstructed in 3 mm slices for analysis. For the arterial study, the volume length scan was determined from the calcium score acquisition to be inclusive of the left main coronary artery (LMA) and the base of the heart, 120-160 mm. Tube current was determined based on the BMI and tube voltage. The region of interest was placed over the descending aorta and exposure triggered at 300 Hounsfield units (HU). Images were captured at 70-80% of the R wave to R wave interval during late diastole and analyzed on the Vitrea workstation (Vital images; version 5.2), Vital Images Inc., Minnesota, USA. Prospective gating, 0.5 mm collimation and gantry rotation of 350 ms with a pitch of one were used for both groups.
5 min after sublingual nitroglycerine (0.4 mg), a bolus of 70 mL iodinated contrast material (350 Optiray) was injected at 5 mL/s followed by 40 mL saline.
In our clinical and research practice, 100 kVp tube voltage for BMI 23 ± 2 and 120 kVp for BMI > 26 is preferred. Group 1: 45 patients (56%) were scanned at 120 kVp with mean mAs 100 ± 9 and Group 2: 33 patients (44%) were scanned at 100 kVp with mean mAs 101 ± 12.
Image quality evaluation
Coronary arteries were evaluated subjectively and quantitative analysis was made using interactive oblique multi-planar reformations (MPRs), curved MPRs and thin maximum intensity projections (MIP).
Quantitative image quality was determined by measuring signal intensity (HU), IN, signal to noise ratio (SNR) and contrast to noise ratio (CNR) using established criteria[17,19] at the left ventricle and LMA on the axial images using a Vitrea work station (Vital Images, version 5.2).[25] Then equal size regions of interest (ROI = 30 mm3) were taken in the contrast filled left ventricle and left ventricular wall. IN was calculated from the standard deviation of Hounsfield density values (HU) within the ROI in the left ventricle. SNR was defined as the ratio of mean signal intensity (HU) divided by IN. CNR was defined as the difference between the mean density (HU) of the left ventricle and left ventricular wall divided by IN.[22,23,24,25] An ROI was then placed in the LMA and perivascular tissue adjacent to the LMA to determine SNR and CNR of the LMA [Figure 1, 2a and 2b].
Figure 1.
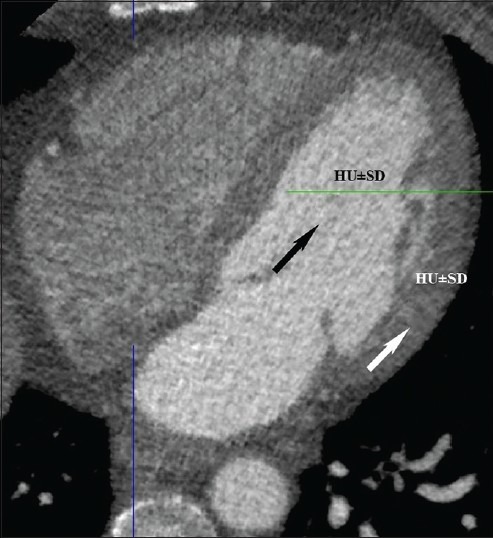
55-year-old-male with chest pain. Normal axial computed tomography shows region of interest in left ventricular chamber (black arrow) and left ventricular wall (white arrow) for image noise, signal to noise ratio and contrast to noise ratio.
Figure 2.
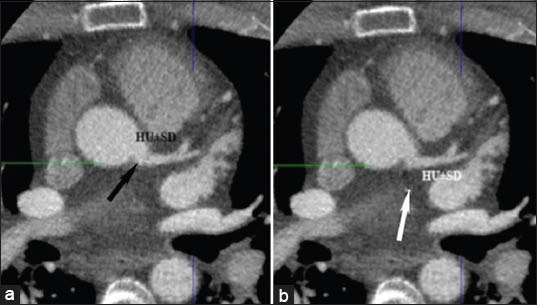
(a) 64-year-old-female with dyspnea. Normal axial computed tomography shows region of interest at the origin of left main artery (black arrow) to determine image noise, signal to noise ratio and contrast to noise ratio. (b) 52-year-old-male with chest pain. Normal axial computed tomography reveals region of interest at the perivascular area (white arrow) to determine image noise, signal to noise ratio and contrast to noise ratio.
Two experienced independent readers analyzed the same data set independent of each other and blind to patient characteristics for inter-reader variability. One reader repeated the analysis to determine intra-reader variability. Subjective image quality was assessed using the 16-segment model proposed by the AHA.[26] Images were analyzed in axial, curved MPR and MIP imaging using an established ordinal scale from 1 to 3 (1 = Excellent, 2 = Good and 3 = Non-diagnostic).[14,21,27] Segments were identified as non-diagnostic due to significant motion artifact, poor vessel opacification, structural discontinuity, and high image blurring. The difference between two readers was resolved by a consensus opinion.
Estimation of radiation dose
The scanner recorded CT volume dose index and dose length product (DLP) to estimate effective radiation dose (ED). The ED (mSv) was calculated by multiplying DLP from the scanner with the standard conversion coefficient (k = 0.014 mSv/mGy × cm) for chest found in the 2004 European Commission guidelines.[8,28,29,30,31]
Statistical analysis
All statistical analyses were performed with Stata\MP 10.0 (Stata, College Station, Texas, USA). Continuous variables were expressed as the mean ± standard deviation and categorical variables as frequency or percentage. Continuous variables within two patients groups were compared using Bartlett's test for equal variances. The differences in median radiation doses between 100 kVp versus 120 kVp were determined by Kruskal-Wallis equality-of-populations rank test. Then regression analysis was performed for median radiation dose for two groups adjusted for age, gender, BMI, HR, and tube current. A P < 0.05 was considered to be statistically significant.
Subjective image quality ranking was documented on an ordinal scale from 1 (excellent) to 3 (non-diagnostic) and were analyzed between both groups using Wilcoxon-signed rank test. Comparative analysis for quantitative image quality between both groups (signal, IN, SNR and CNR) was performed using Chi-square test. P <0.05 was again considered to be statistically significant.
RESULTS
A comparison of patient characteristics and median radiation dose [Table 1] revealed no differences in the use of beta-blockers, HR, scan length, and tube current using 100 or 120 kVp between Group 1 and Group 2.
Radiation dose
The median radiation dose was 5.31 mSv (95% confidence interval [CI]: 4.86-6.09) for Group 1 scanned at 120 kVp versus 3.71 mSv (95% CI: 2.76-4.87) for Group 2 scanned with 100 KVp (P = 0.009), representing a 30% reduction in radiation dose. In a multivariate analysis, taking into account age, gender, HR, BMI, tube current, and scan length, compared with those scanned at 120 kVp, an absolute median reduction of 2.21 mSv (1.13-3.29 mSv) was noted using 100 kVp (P < 0.0001). Similar differences were noted when the analysis was repeated across tertiles of HR and BMI.
Image quality
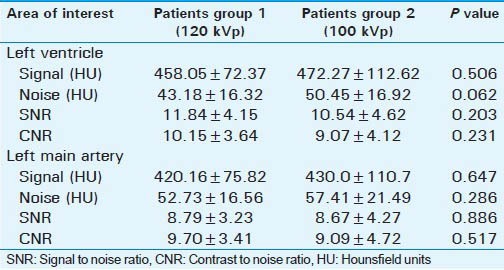
Although mean signal intensity (HU density) and IN (HU) were higher in Group 2 patients scanned using 100 kVp versus 120 kVp at both left ventricle and LMA, but this difference was statistically insignificant. Quantitative image quality (SNR and CNR) was not statistically different between groups at LV (SNR: 11.84 vs. 10.54, P = 0.203; CNR: 10.15 vs. 9.07, P = 0.231) and LM (SNR: 8.79 vs. 8.67, P = 0.886; CNR: 9.70 vs. 9.09, P = 0.517) [Table 2].
Table 2.
Qualitative assessment of image quality
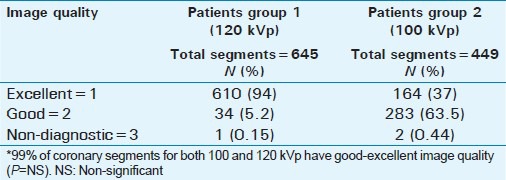
Subjective image quality at the segment level was slightly better among those scanned using 120 kVp (excellent 94%, good 5.2% and non-diagnostic 0.15%) versus those scanned at 100 kVp (excellent 37%, good 61.6% and non-diagnostic 0.46%) (P < 0.0001). Although there were more segments of excellent image quality in the 120 kVp group, both groups had similar diagnostic quality and none were adversely affected in the 100 kVp group (P = NS) [Table 3].
Table 3.
Subjective assessment of image quality
DISCUSSION
Exposure to a higher dose of radiation increases the risk of cancer and remains an important concern despite the robustness and accuracy of MDCTA. Although past surveys have reported radiation doses for cardiac MDCTA as high as 12-15 mSv (a dose, which is comparable to nuclear myocardial perfusion imaging), recent studies report radiation doses of 2-8 mSv.[4,15,32,33,34,35,36,37]
In this first study to evaluate the use of low tube voltage on 320-row MDCT, we found that 100 kVp tube voltage results in a 30% reduction in radiation dose while maintaining diagnostic image quality. Previous studies using 16 and 64 row scanners to evaluate kVp reduction protocols documented 20-40% reduction by using 100 kVp.[22,23,25] Park et al., in their study have reported a 24% reduction in radiation dose (7.8 ± 0.4 mSv for 100 kVp vs. 10.1 ± 1.0 mSv at 120 kVp using a 16-row detector scanner (P < 0.001).[20] Feuchtner et al., report a 47% radiation dose reduction using 100 kVp versus 120 kVp (7.1 mSv ± 2.4 vs. 13.4 mSv ± 5.2 with retrospective gating on 64-row scanner),[21] while Ripsweden et al., reported a 52% reduction in ED between 100 and 120 kVp cohorts (P < 0.0001), although this reduction was slightly overestimated, since the recorded scan length was shorter in 100 kVp group.[19] Comparing 100 kVp versus 120 kVp at dual source scanner, Blankstein et al., has shown >50% reduction in radiation dose (8.4 mSv vs. 15.7 mSv) with comparable image quality.[22] We found high diagnostic image quality (e.g. excellent or good) in both patients groups. Although, 120 kVp group yielded slightly better image quality collectively, that difference was not statistically significant. This is comparable with Yang et al., who also did not find any statistical difference when comparing image quality in two groups exposed to 100 kVp versus 120 kVp.[38]
Tube voltage (kVp) reduction results in a parallel increase in the background IN that can impair image quality. However, the lower kVp simultaneously results in higher attenuation of iodinated contrast material, thereby increasing signal intensity. Thus, the increase in signal intensity offsets the negative aspect of increased IN and diagnostic quality is maintained. Our study showed that a 30% reduction in radiation dose lead to 14% increase in IN [Table 2] with slightly better SNR and CNR in the 120 kVp group, but this difference was not statistically significant [Table 2]. All previous studies have shown comparable subjective and objective image quality using 100 and 120 kVp.[19,20,22,23] Feuchtner et al., reported even higher intraluminal CT-attenuation (HU) of coronary arteries in the 100 kVp group (P < 0.001) and supports the concept that low kVp protocols provide improved contrast resolution.[21]
Radiation dose optimization remains an important concern in cardiac MDCTA. Although low kVp may not be as useful in obese patients because of IN, our study supports the concept that kVp may be reduced from 120 to 100 and still maintain good to excellent image quality in patients with BMI < 27.[32]
LIMITATIONS
Main limitation was that different patients were scanned under both protocols (120 or 100 kVp) rather than scanning the same patient with both protocols. This was mainly to avoid an increase in radiation dose burden on patients. Sample size (78 patients) was small for our study and also, we did not corroborate our findings with coronary angiography. Although age and gender ratio were different in both groups, but these have no documented correlation with radiation dose exposure in adult coronary imaging. This is a retrospective review and future prospective studies are needed to assess the effect of radiation reduction on diagnostic image quality by evaluating all the factors that effect image quality.
CONCLUSION
Lower tube voltage (100 kVp) can be used to perform 320-row MDCT in patients with BMI < 27, as this results in a significant reduction of radiation exposure while maintaining good diagnostic imaging quality.
Footnotes
Available FREE in open access from: http://www.clinicalimagingscience.org/text.asp?2013/3/1/62/124092
Source of Support: Nil
Conflict of Interest: None declared.
REFERENCES
- 1.Go AS, Mozaffarian D, Roger VL, Benjamin EJ, Berry JD, Borden WB, et al. Executive summary: Heart disease and stroke statistics-2013 update: A report from the American Heart Association. Circulation. 2013;127:143–52. doi: 10.1161/CIR.0b013e318282ab8f. [DOI] [PubMed] [Google Scholar]
- 2.Lloyd-Jones D, Adams RJ, Brown TM, Carnethon M, Dai S, De Simone G, et al. Executive summary: Heart disease and stroke statistics - 2010 update: A report from the American Heart Association. Circulation. 2010;121:948–54. doi: 10.1161/CIRCULATIONAHA.109.192666. [DOI] [PubMed] [Google Scholar]
- 3.Heron M, Hoyert DL, Murphy SL, Xu J, Kochanek KD, Tejada-Vera B. Deaths: Final data for 2006. Natl Vital Stat Rep. 2009;57:1–134. [PubMed] [Google Scholar]
- 4.Dewey M, Zimmermann E, Deissenrieder F, Laule M, Dübel HP, Schlattmann P, et al. Noninvasive coronary angiography by 320-row computed tomography with lower radiation exposure and maintained diagnostic accuracy: Comparison of results with cardiac catheterization in a head-to-head pilot investigation. Circulation. 2009;120:867–75. doi: 10.1161/CIRCULATIONAHA.109.859280. [DOI] [PubMed] [Google Scholar]
- 5.Miller JM, Rochitte CE, Dewey M, Arbab-Zadeh A, Niinuma H, Gottlieb I, et al. Diagnostic performance of coronary angiography by 64-row CT. N Engl J Med. 2008;359:2324–36. doi: 10.1056/NEJMoa0806576. [DOI] [PubMed] [Google Scholar]
- 6.Hurlock GS, Higashino H, Mochizuki T. History of cardiac computed tomography: Single to 320-detector row multislice computed tomography. Int J Cardiovasc Imaging. 2009;25(Suppl 1):31–42. doi: 10.1007/s10554-008-9408-z. [DOI] [PubMed] [Google Scholar]
- 7.Rybicki FJ, Otero HJ, Steigner ML, Vorobiof G, Nallamshetty L, Mitsouras D, et al. Initial evaluation of coronary images from 320-detector row computed tomography. Int J Cardiovasc Imaging. 2008;24:535–46. doi: 10.1007/s10554-008-9308-2. [DOI] [PubMed] [Google Scholar]
- 8.Hsiao EM, Rybicki FJ, Steigner M. CT coronary angiography: 256-slice and 320-detector row scanners. Curr Cardiol Rep. 2010;12:68–75. doi: 10.1007/s11886-009-0075-z. [DOI] [PMC free article] [PubMed] [Google Scholar]
- 9.Hausleiter J, Meyer T, Hermann F, Hadamitzky M, Krebs M, Gerber TC, et al. Estimated radiation dose associated with cardiac CT angiography. JAMA. 2009;301:500–7. doi: 10.1001/jama.2009.54. [DOI] [PubMed] [Google Scholar]
- 10.Steigner ML, Otero HJ, Cai T, Mitsouras D, Nallamshetty L, Whitmore AG, et al. Narrowing the phase window width in prospectively ECG-gated single heart beat 320-detector row coronary CT angiography. Int J Cardiovasc Imaging. 2009;25:85–90. doi: 10.1007/s10554-008-9347-8. [DOI] [PubMed] [Google Scholar]
- 11.Efstathopoulos EP, Kelekis NL, Pantos I, Brountzos E, Argentos S, Grebác J, et al. Reduction of the estimated radiation dose and associated patient risk with prospective ECG-gated 256-slice CT coronary angiography. Phys Med Biol. 2009;54:5209–22. doi: 10.1088/0031-9155/54/17/009. [DOI] [PubMed] [Google Scholar]
- 12.Gerber TC, Kantor B, McCollough CH. Radiation dose and safety in cardiac computed tomography. Cardiol Clin. 2009;27:665–77. doi: 10.1016/j.ccl.2009.06.006. [DOI] [PMC free article] [PubMed] [Google Scholar]
- 13.Herzog BA, Husmann L, Burkhard N, Valenta I, Gaemperli O, Tatsugami F, et al. Low-dose CT coronary angiography using prospective ECG-triggering: Impact of mean heart rate and heart rate variability on image quality. Acad Radiol. 2009;16:15–21. doi: 10.1016/j.acra.2008.06.010. [DOI] [PubMed] [Google Scholar]
- 14.Weustink AC, Neefjes LA, Kyrzopoulos S, van Straten M, Neoh Eu R, Meijboom WB, et al. Impact of heart rate frequency and variability on radiation exposure, image quality, and diagnostic performance in dual-source spiral CT coronary angiography. Radiology. 2009;253:672–80. doi: 10.1148/radiol.2533090358. [DOI] [PubMed] [Google Scholar]
- 15.Einstein AJ, Elliston CD, Arai AE, Chen MY, Mather R, Pearson GD, et al. Radiation dose from single-heartbeat coronary CT angiography performed with a 320-detector row volume scanner. Radiology. 2010;254:698–706. doi: 10.1148/radiol.09090779. [DOI] [PMC free article] [PubMed] [Google Scholar]
- 16.Khan A, Nasir K, Khosa F, Saghir A, Sarwar S, Clouse ME. Prospective gating with 320-MDCT angiography: Effect of volume scan length on radiation dose. AJR Am J Roentgenol. 2011;196:407–11. doi: 10.2214/AJR.10.4903. [DOI] [PMC free article] [PubMed] [Google Scholar]
- 17.Nikolic B, Khosa F, Lin PJ, Khan AN, Sarwar S, Yam CS, et al. Absorbed radiation dose in radiosensitive organs during coronary CT angiography using 320-MDCT: Effect of maximum tube voltage and heart rate variations. AJR Am J Roentgenol. 2010;195:1347–54. doi: 10.2214/AJR.10.4333. [DOI] [PMC free article] [PubMed] [Google Scholar]
- 18.Khosa F, Khan A, Shuaib W, Clouse M, Budoff M, Blankstein R, Nasir K. Radiation exposure for coronary artery calcium score at prospective 320 row multi-detector computed tomography. Int J Cancer Ther Oncol. 2013;1(2):01023. [Google Scholar]
- 19.Ripsweden J, Brismar TB, Holm J, Melinder A, Mir-Akbari H, Nilsson T, et al. Impact on image quality and radiation exposure in coronary CT angiography: 100 kVp versus 120 kVp. Acta Radiol. 2010;51:903–9. doi: 10.3109/02841851.2010.504740. [DOI] [PubMed] [Google Scholar]
- 20.Park EA, Lee W, Kang JH, Yin YH, Chung JW, Park JH. The image quality and radiation dose of 100-kVp versus 120-kVp ECG-gated 16-slice CT coronary angiography. Korean J Radiol. 2009;10:235–43. doi: 10.3348/kjr.2009.10.3.235. [DOI] [PMC free article] [PubMed] [Google Scholar]
- 21.Feuchtner GM, Jodocy D, Klauser A, Haberfellner B, Aglan I, Spoeck A, et al. Radiation dose reduction by using 100-kV tube voltage in cardiac 64-slice computed tomography: A comparative study. Eur J Radiol. 2010;75:e51–6. doi: 10.1016/j.ejrad.2009.07.012. [DOI] [PubMed] [Google Scholar]
- 22.Blankstein R, Bolen MA, Pale R, Murphy MK, Shah AB, Bezerra HG, et al. Use of 100 kV versus 120 kV in cardiac dual source computed tomography: Effect on radiation dose and image quality. Int J Cardiovasc Imaging. 2011;27:579–86. doi: 10.1007/s10554-010-9683-3. [DOI] [PubMed] [Google Scholar]
- 23.Leschka S, Stolzmann P, Schmid FT, Scheffel H, Stinn B, Marincek B, et al. Low kilovoltage cardiac dual-source CT: Attenuation, noise, and radiation dose. Eur Radiol. 2008;18:1809–17. doi: 10.1007/s00330-008-0966-1. [DOI] [PubMed] [Google Scholar]
- 24.Shannon CN, Simon TD, Reed GT, Franklin FA, Kirby RS, Kilgore ML, et al. The economic impact of ventriculoperitoneal shunt failure. J Neurosurg Pediatr. 2011;8:593–9. doi: 10.3171/2011.9.PEDS11192. [DOI] [PMC free article] [PubMed] [Google Scholar]
- 25.Hausleiter J, Meyer T, Hadamitzky M, Huber E, Zankl M, Martinoff S, et al. Radiation dose estimates from cardiac multislice computed tomography in daily practice: Impact of different scanning protocols on effective dose estimates. Circulation. 2006;113:1305–10. doi: 10.1161/CIRCULATIONAHA.105.602490. [DOI] [PubMed] [Google Scholar]
- 26.Austen WG, Edwards JE, Frye RL, Gensini GG, Gott VL, Griffith LS, et al. A reporting system on patients evaluated for coronary artery disease. Report of the Ad Hoc Committee for Grading of Coronary Artery Disease, Council on Cardiovascular Surgery, American Heart Association. Circulation. 1975;51:5–40. doi: 10.1161/01.cir.51.4.5. [DOI] [PubMed] [Google Scholar]
- 27.Wang M, Qi HT, Wang XM, Wang T, Chen JH, Liu C. Dose performance and image quality: Dual source CT versus single source CT in cardiac CT angiography. Eur J Radiol. 2009;72:396–400. doi: 10.1016/j.ejrad.2008.08.010. [DOI] [PubMed] [Google Scholar]
- 28.Raff GL, Chinnaiyan KM, Share DA, Goraya TY, Kazerooni EA, Moscucci M, et al. Radiation dose from cardiac computed tomography before and after implementation of radiation dose-reduction techniques. JAMA. 2009;301:2340–8. doi: 10.1001/jama.2009.814. [DOI] [PubMed] [Google Scholar]
- 29.Huda W. Radiation doses and risks in chest computed tomography examinations. Proc Am Thorac Soc. 2007;4:316–20. doi: 10.1513/pats.200611-172HT. [DOI] [PubMed] [Google Scholar]
- 30.Jung B, Mahnken AH, Stargardt A, Simon J, Flohr TG, Schaller S, et al. Individually weight-adapted examination protocol in retrospectively ECG-gated MSCT of the heart. Eur Radiol. 2003;13:2560–6. doi: 10.1007/s00330-003-2111-5. [DOI] [PubMed] [Google Scholar]
- 31.Huda W, Ogden KM, Khorasani MR. Converting dose-length product to effective dose at CT. Radiology. 2008;248:995–1003. doi: 10.1148/radiol.2483071964. [DOI] [PMC free article] [PubMed] [Google Scholar]
- 32.Maruyama T, Takada M, Hasuike T, Yoshikawa A, Namimatsu E, Yoshizumi T. Radiation dose reduction and coronary assessability of prospective electrocardiogram-gated computed tomography coronary angiography: Comparison with retrospective electrocardiogram-gated helical scan. J Am Coll Cardiol. 2008;52:1450–5. doi: 10.1016/j.jacc.2008.07.048. [DOI] [PubMed] [Google Scholar]
- 33.Shuman WP, Branch KR, May JM, Mitsumori LM, Lockhart DW, Dubinsky TJ, et al. Prospective versus retrospective ECG gating for 64-detector CT of the coronary arteries: Comparison of image quality and patient radiation dose. Radiology. 2008;248:431–7. doi: 10.1148/radiol.2482072192. [DOI] [PubMed] [Google Scholar]
- 34.Achenbach S, Marwan M, Ropers D, Schepis T, Pflederer T, Anders K, et al. Coronary computed tomography angiography with a consistent dose below 1 mSv using prospectively electrocardiogram-triggered high-pitch spiral acquisition. Eur Heart J. 2010;31:340–6. doi: 10.1093/eurheartj/ehp470. [DOI] [PubMed] [Google Scholar]
- 35.Achenbach S, Goroll T, Seltmann M, Pflederer T, Anders K, Ropers D, et al. Detection of coronary artery stenoses by low-dose, prospectively ECG-triggered, high-pitch spiral coronary CT angiography. JACC Cardiovasc Imaging. 2011;4:328–37. doi: 10.1016/j.jcmg.2011.01.012. [DOI] [PubMed] [Google Scholar]
- 36.Husmann L, Valenta I, Gaemperli O, Adda O, Treyer V, Wyss CA, et al. Feasibility of low-dose coronary CT angiography: First experience with prospective ECG-gating. Eur Heart J. 2008;29:191–7. doi: 10.1093/eurheartj/ehm613. [DOI] [PubMed] [Google Scholar]
- 37.Dewey M, Vavere AL, Arbab-Zadeh A, Miller JM, Sara L, Cox C, et al. Patient characteristics as predictors of image quality and diagnostic accuracy of MDCT compared with conventional coronary angiography for detecting coronary artery stenoses: CORE-64 Multicenter International Trial. AJR Am J Roentgenol. 2010;194:93–102. doi: 10.2214/AJR.09.2833. [DOI] [PMC free article] [PubMed] [Google Scholar]
- 38.Yang L, Xu L, Yan Z, Yu W, Fan Z, Lv B, et al. Low dose 320-row CT for left atrium and pulmonary veins imaging–The feasibility study. Eur J Radiol. 2012;81:1549–54. doi: 10.1016/j.ejrad.2011.02.032. [DOI] [PubMed] [Google Scholar]


