Summary
Background
Even today, use of Glass Ionomer Cements (GIC) as restorative material is indicated for uncooperative patients.
Aim
The study aimed at estimating the surface roughness of different GICs using or not their proprietary surface coatings and at observing the interfaces between cement and coating through SEM.
Materials and methods
Forty specimens have been obtained and divided into 4 groups: Fuji IX (IX), Fuji IX/G-Coat Plus (IXC), Vitremer (V), Vitremer/Finishing Gloss (VFG). Samples were obtained using silicone moulds to simulate class I restorations. All specimens were processed for profilometric evaluation. The statistical differences of surface roughness between groups were assessed using One-Way Analysis of Variance (One-Way ANOVA) (p<0.05). The Two-Way Analysis of Variance (Two-Way ANOVA) was used to evaluate the influence of two factors: restoration material and presence of coating. Coated restoration specimens (IXC and VFG) were sectioned perpendicular to the restoration surface and processed for SEM evaluation.
Results
No statistical differences in roughness could be noticed between groups or factors. Following microscopic observation, interfaces between restoration material and coating were better for group IXC than for group VFG.
Conclusions
When specimens are obtained simulating normal clinical procedures, the presence of surface protection does not significantly improve the surface roughness of GICs.
Keywords: GIC, roughness, coating
Introduction
Glass ionomer cements (GIC) were introduced by Wilson and Kent in 1972 (1). These materials are used in restorative dentistry for a variety of qualities such as adhesion to enamel and dentin in humid conditions, less volumetric contraction (2), preservation of the pulp, coefficient of thermal expansion similar to dentin, low solubility in the oral environment and release of fluoride, that can aid the affected dentin remineralization process (3). Nevertheless, their sensitivity to moisture, low mechanical strength and low wear resistance make glass ionomer restorations usually less durable (4).
Because of the abovementioned qualities this cement finds a broader application in pediatric dentistry. In particular, it can become the material of excellence in all cases where it is not possible either to isolate properly the operative field from saliva (with a rubber dam) or to perform all the steps of adhesion and stratification required by the composites. In young patients with a low level of cooperation the possibility of using a high quality material that can be quickly applied in non-optimal conditions is extremely important.
In the past decade several studies were conducted to improve the characteristics of GICs.
Resin-modified glass ionomer cements (RMGIC) and highly-viscous glass ionomer cements (HVGIC) were developed to overcome the poor mechanical strength associated to conventional GICs, thus maintaining their clinical advantages (4).
RMGICs, introduced by Mitra in 1991, are made with the addition of light-cured resin hydrophilic (4). HV-GICs were designed as an alternative to amalgam for posterior preventive restoration (4), where access/isolation are compromised and aesthetics is of secondary importance, particularly for the Atraumatic Restorative Technique (ART) introduced by the World Health Organization for use in developing countries (2).
Hardening of RMGICs occurs both through the traditional acid-base reaction of GICs and through light-curing polymerization (4). However, acid-base reaction is still the dominant one, while photo polymerization can be considered as an auxiliary one (4). Photo-polymerization only acts on the resin component. The acid-base reaction used to harden and reinforce the matrix is relatively immature, just after using the lamp. This reaction is delayed in RMGICs because of the presence of water inside the mixture of powder and liquid (5), which is partially replaced with a water-soluble monomer (4). The structure of the resin reduces water spreading within the material (4). GICs come to complete polymerization after 1 week, even though the matrix reaches a sufficient level of acid-base reaction (4) after only five minutes.
In restoration procedures, a surface character, such as roughness, can determine the quality and the clinical behavior of the restoration material (6). Consequently, great relevance has been given to studies on the roughness of filling materials and of glass ionomer cements in particular.
Smooth surfaces can influence the wear of material (2), the aesthetic aspect of restorative materials, the onset of spots and can also increase the risk of secondary caries (7). On the other hand, rough surfaces can help retention, survival and proliferation of many caries-inducing microorganisms (Streptococcus mutans and Lactobacillus spp.) in the oral cavity and also favor periodontal diseases (Porphyromonas gingivalis and Actinobacillosis actinomicetemcomitans) (8); they also favor plaque retention causing gingival irritation. Although surface free energy can play a role in bacterial adhesion and retention, surface roughness overrules the influence of surface free energy (9).
In addition, smoother reconstructions are also easier to maintain (9) and therefore more durable (8).
There are many roughness parameters in use, but arithmetic mean roughness is by far the most common one. Each roughness parameter is calculated using a formula to describe the surface. Arithmetic mean roughness (Ra) is the arithmetic average of all frames of the profile filtered by measuring the length from the line of the reference profile.
The threshold value of Ra below which no plaque formation is observed (supra-and subgingival) is 0.2 μm (9). No further reduction in bacterial accumulation is expected below this threshold value. Any increase in surface roughness, above 0.2 μm, results in a simultaneous increase in plaque accumulation with subsequent increase of the risk of caries and periodontal inflammation (9).
GICs are usually hydrolytically unstable during the initial stages of setting (2); in particular, the resin-modified ones, appear susceptible to dehydration (10). RMGICs water absorption appeared to be dependent on hydrophilic resin HEMA (2-hydroxyethyl methacrylate) content (11). Drying of these materials leads to a large loss of water, and consequently to irreversible changes in shape, loss of the interface in few minutes and formation of trines and cracks, caused by the material being exposed to air (4). In the event of premature contact with water, the result will be a loss of calcium and aluminum ions, surface erosion and loss of the translucency (12).
Surface protection for GICs was assessed by some studies (13). Protecting RMGICs with resin coating helps HEMA (highly hydrophilic) not to absorb water, and consequently increases the quality of the cement, in particular reducing dimensional variations (11). A clinical study has shown that GIC protection can improve esthetics, counteracting the color change due to contamination during acid-base reaction (14).
Therefore, the aim of this study was to assess the interaction and the influence on topography as well as the changes in average roughness provided for by different GICs and surface coatings in dental restorations when finishing/polishing procedures cannot be implemented. Surface roughness will be assessed with profilometric measurements and the interface between materials will be examined with SEM analysis.
The tested null hypotheses showed that a statistically similar surface roughness is achieved using or not using coating on GICs surface and that similar interfaces are achieved using different GICs in combination with the proprietary coating.
Materials and methods
Forty specimens were obtained and divided into 4 groups (n=10):
Group A (IX): Fuji IX GP Fast Capsule (GC Corp., Tokyo, Japan);
Group B (IXC): Fuji IX GP Fast Capsule (GC Corp., Tokyo, Japan)/G-Coat Plus (GC corporation, Tokyo Japan);
Group C (V): Vitremer (3M ESPE, Seefeld, Germany);
Group D (VFG): Vitremer (3M ESPE, Seefeld, Germany)/Finishing Gloss (3M ESPE, Seefeld, Germany). Specimens were obtained following manufacturers’ instructions and at controlled temperature of 23±2°C.
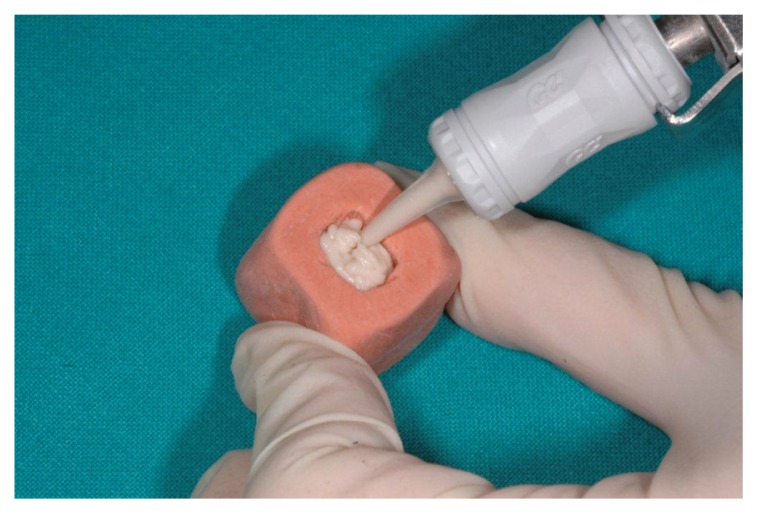
To create a standardized first-class cavity, silicone molds were prepared with putty impression material, to obtain 4 mm wide and 5 mm long samples with a height of about 2.5 mm (Fig. 1).
Figure 1.
First-class cavity replacement silicone molds.
In Groups A and B, after vibrating the capsule for 10s with TAC 400/M (4200 rpm; Linea TAC s.r.l. - Montegrosso d’Asti, AT, Italy), the material was dispensed through the capsule tip to bulk fill the mould.
In Groups C and D cement was manually mixed using a cement spatula and following the manufacturer’s instructions, in a ratio of two scoops of powder for two drops of liquid. Afterwards, the cement was placed into the silicone mould.
In all groups, restoration surface was modeled with a Heidemann spatula to obtain a surface as flat as possible, however, simulating clinical procedures.
In Groups C and D, GIC was light cured for 30s with a conventional quartz-tungsten-halogen light (Polylight 3 Steril; Castellini, Castel Maggiore, BO, Italy; power consumption 52 W, wavelength (range) 400–515 nm).
Group B surfaces were covered with coating G-Coat Plus using a disposable brush followed by light cure for 30 seconds.
Group D surfaces were varnished with Finishing Gloss, included in the manufacturer packaging, using a disposable brush and light cure for 30 seconds. All procedures were carried out by a single researcher.
Glass Ionomer Cements used in the study, their manufacturers, batch numbers and compositions are reported in Table 1. Coating and their relevant information are also reported in Table 1.
Table 1.
Composition, batch numbers and the application modes of the materials used in the study.
| Table 1 | The Glass Ionomer Cements Investigated | ||||
|---|---|---|---|---|---|
| Material | Classification | Manufacturer | Components | Batch | Average particle size (μm) |
| Fuji IX GP Fast | Highly viscous Glass Ionomer Cement | GC Corporation, Tokyo, Japan |
Powder: Alumino silicate glass, pigments Liquid: Polyacrylic acid, distilled water |
# 0603204 | 7 |
| Vitremer | Resin Modified Glass Ionomer Cement | 3M, St Paul, MN, USA |
Powder: Aluminum fluoride silicate glass Liquid: Polymethacrylic acid, hydroxyethylmethacrylate |
# N186025 Powder and # N190949 Liquid | 6.25 |
| GC Coat Plus | Surface coating | GC Corporation, Tokyo, Japan | #0708031 | ||
| Finishing Gloss | 3M, St Paul, MN, USA | Bis-GMA, Triethyleneglycoldimethacrylate | # N190764 | ||
Before final testing, all specimens were stored for 1 week at 37°C to complete the self-curing reaction.
Profilometric analysis
Profilometric analysis was carried out according to ISO 4287: 1997 (and 4288: 1996). As to the roughness analysis, a HIROX 3D digital microscope (distributed in Italy by Simitecno Srl for Hirox - USA Inc., River Edge (NJ) USA) was used.
For each specimen, images of the surface were acquired at 350 magnifications and were then reconstructed with 3D geometry. Scan area measured approximately 886×670 μm. For each specimen, acquisitions ranged from one to five.
An excel file containing the coordinates of points in space was obtained from the 3D geometry of the surface profile of the sample. RA values, profile analysis and its regression line were obtained for each acquisition. Ra field parameter and formula are shown in Table 2.
Table 2.
Ra surface roughness parameter informations.
| Parameter | Field Parameter | Formula | |
|---|---|---|---|
| Ra | Amplitude |
|
The excel file obtained from the acquisition that describes the cloud of points on the 3D surface is a matrix of 1200 rows by 1600 columns. Each column appeared to contain from 10 to 200 data due to spurious values.
The values described above were filtered removing those data showing three orders of magnitude higher than the average. The elimination of erroneous data makes surface roughness more evident.
Data always show a gradient, either due to imperfect flatness of the surface or to imperfect positioning of the sample under the microscope. This affects the determination of the reference line. To overcome this problem the regression line was calculated and roughness measurements were made with respect to this.
For each acquisition excel cannot filter more than 1200 values per column, (1200×1600 = 1920000 values); due to this amount of data, for each sample, data were collected from 9 different points of the surface. Of these, the surface profile has been viewed. For the samples with fewer irregularities the regression line and the values of roughness were assessed.
For each sample, in addition to numerical data, two 3D scans of the area type were carried out and were defined reticulated axonometric and continues axonometric.
A simulation picture, that is a two-dimensional reconstruction of the surface, was also made.
Statistical analysis
Data obtained following the above mentioned procedures were tabulated and statistically analyzed using SigmaPlot for Windows 11,0. Mean (standard deviation) and median values of rugosity were calculated for each group. For each variable, boxplots and whiskers were plotted for all groups.
Group’s roughness data distribution was evaluated with the Kolmogorov-Smirnov test. As their distribution was abnormal, the use of One-Way Analysis of Variance (One-Way ANOVA) for groups was precluded. Data were tested resorting to Kruskal-Wallis Analysis of Variance (ANOVA) that was applied to assess the statistical significance of between-group differences.
Roughness data were also assessed with Two-Way Analysis of Variance (Two-Way ANOVA). The two factors taken into account were restoration material (Fuji IX and Vitremer) and presence of surface coating.
For all the analyses the level of significance was set at α = 0,05.
SEM analysis
Group B and D specimens, after profilometer testing, were sectioned perpendicular to the restoration surface, with sections parallel to long axis of the surface, up to 0.5 mm from the interface between GIC and varnish. This procedure was performed using a low-speed diamond blade (Isomet 1000, Buehler, Lake Bluff, IL, USA) under water-cooling. The cut samples were frozen in liquid nitrogen and fractured with microtome (Reichert-Jung, Cambridge Instruments GmbH, Nussloch, Germany) resulting in 3 slices for every specimen. Slices were partially incorporated into composite resin, leaving the interface area free.
For both group B and group D, 30 specimens were obtained that can be analyzed microscopically.
Specimens were first fixed in 2.5% glutaraldehyde phosphate buffer (pH 7.4) for 24 h and then washed under running water for 30 min.
Later they were post-fixed in osmium tetroxide (OsO4) for 2 h, at air temperature.
Afterwards, they were washed in a phosphate buffer for 30 min with 3 changes. The samples were dehydrated with ethyl alcohol at increasing concentrations for a total of 2 h at air temperature.
For maximum drying, specimens were subjected to “critical point drying” through carbon dioxide (CO2) fluid. The samples were mounted on stubs with silver adhesive conductor (“Silver dag”) and metallized with gold by sputter coat S150 (Edwards, London, UK).
The samples were examined and observed under field emission SEM Hitachi S 4000 (Hitachi Ltd. Tokyo, Japan) operating at magnifications ranging from ×40 to 2000 and at an accelerating voltage of 8–10 kV.
Results
Profilometric analysis
No significant differences were detected between groups for profilometric value (p>0.05). Results and statistics regarding Ra values for each tested group are shown in Table 3.
Table 3.
Results of Roughness test and statistical significance between Groups.
| Ra values | |||||
|---|---|---|---|---|---|
| Group | N | Mean | sd | Median | 25%–75% |
| Fuji IX | 16 | 4,69 | (6,81) | 2.57 | 0.22–6.28 |
| Fuji IX / G-Coat Plus | 13 | 2,00 | (2,94) | 0.95 | 0.62–1.61 |
| Vitremer | 15 | 1,71 | (1,23) | 1.38 | 0.68–2.54 |
| Vitremer / Finishing Gloss | 10 | 0,87 | (0,66) | 0.64 | 0.39–1.29 |
Neither material nor surface coating turned out to be a significant factor for profilometric analysis to GICs (p>0.05). In addition there was not a statistically significant interaction between material and type (p>0.05). Table 4 and 5 show the results and statistics regarding the comparison between coated and not-coated GICs.
Table 4.
Results of Roughness test and statistical significance between coated and not-coated restorations.
| Ra values | |||||
|---|---|---|---|---|---|
| Coated/Not-Coated | N | Mean | sd | Median | 25%–75% |
| Coated | 23 | 1,57 | (2,38) | 0.84 | 0.49–1.56 |
| Not-Coated | 31 | 3,16 | (4,98) | 1.52 | 0.53–3.30 |
Table 5.
Results of Roughness test and statistical significance between materials.
| Ra values | |||||
|---|---|---|---|---|---|
| Material | N | Mean | Std Dev | Median | 25%–75% |
| Fuji IX | 29 | 3,488 | 5,516 | 1,18 | 0,386–3,41 |
| Vitremer | 25 | 1,439 | 1,141 | 0,962 | 0,554–2,149 |
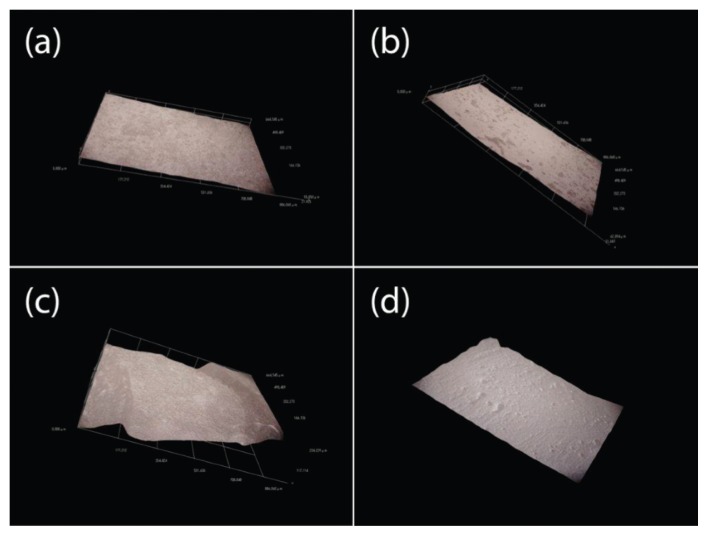
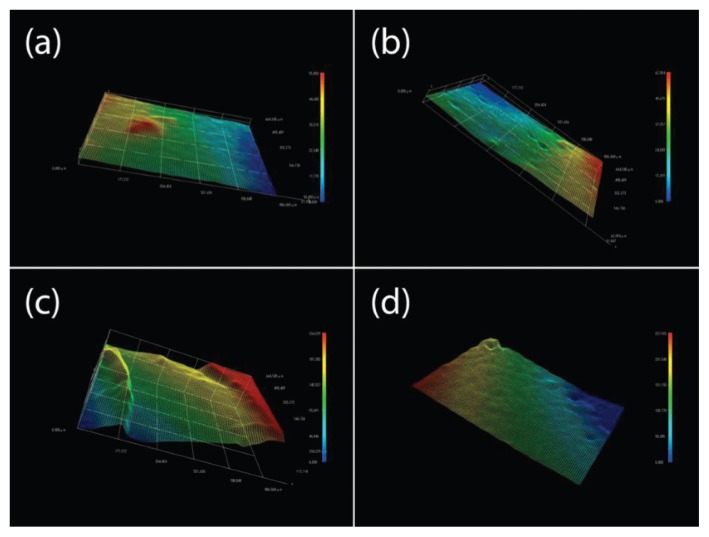
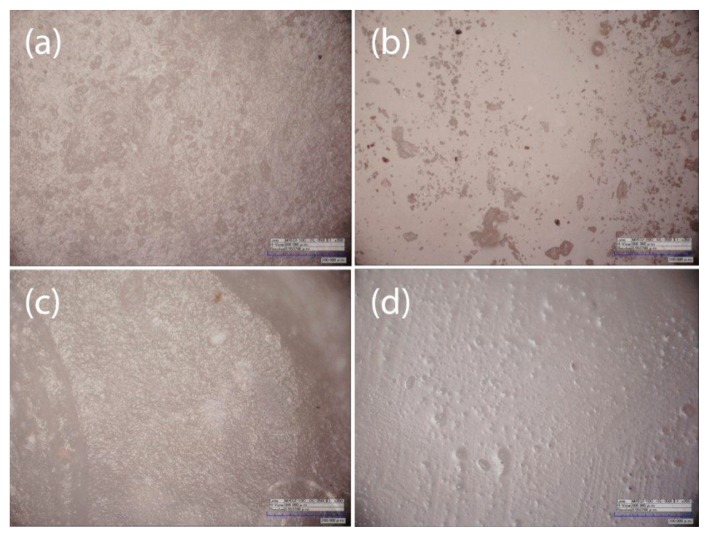
The digital microscope also reported three types of digital images: continues axonometric (Fig. 2); reticulated axonometrics (Fig. 3); 2D reconstructions also called simulation picture (Fig. 4).
Figure 2.
Continues axonometric: (A) IX; (B) IXC; (C) V; and (D) VFG.
Figure 3.
Reticulated axonometric: (A) IX; (B) IXC; (C) V; and (D) VFG.
Figure 4.
2D reconstructions: (A) IX; (B) IXC; (C) V; and (D) VFG.
SEM analysis
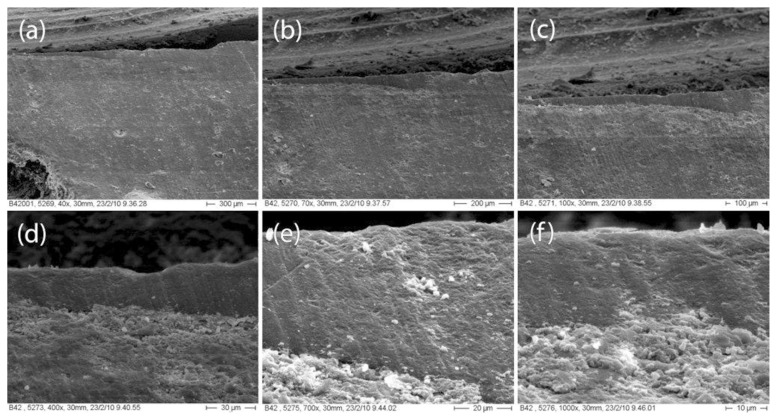
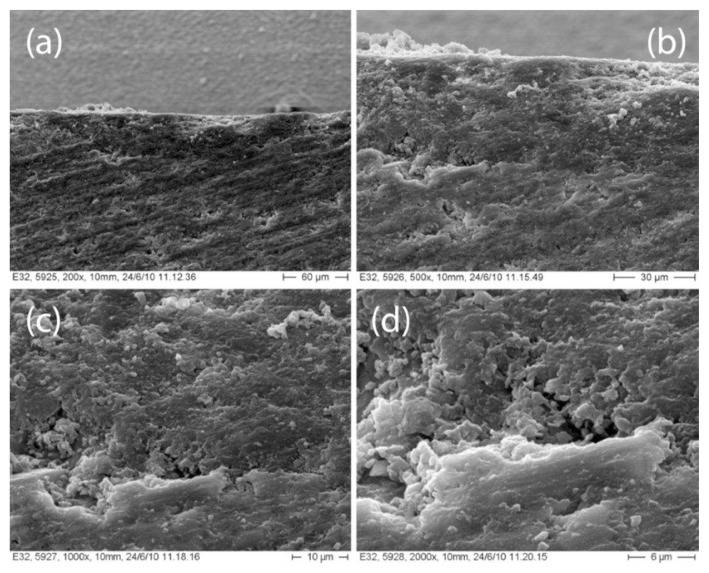
Microscopic observation has shown differences regarding the interfaces between the material and the coating in the various groups. G-Coat Plus shows a continuous interface with Fuji IX for its entire surface (Fig. 5). No air bubbles were found between the two materials even at a 1000× magnification. Vitremer and Finishing Gloss show a good interdigitation but some bubbles are present along the interface. Bubbles begin to appear at magnifications of 400× (Fig. 6). No debris were found between GIC and varnish, enabling a more intimate linking.
Figure 5.
Fuji IX - GC Coat Plus interface photomicrographs at different magnification: (A) 40x; (B) 70x; (C) 100x; (D) 400x; (E) 700x; and (F) 1000x.
Figure 6.
Vitremer - Finishing Gloss interface photomicrographs at different magnification: (A) 200x; (B) 500x; (C) 1000x; and (D) 2000x.
Discussion
The formulated null hypothesis has to be accepted, since profilometric analysis has shown that coated GICs are not significantly different compared to not-coated GICs in. As to SEM analysis, the articulated null hypothesis has to be rejected, since HVGIC proved to be different from RMGIC.
The two restorative materials commonly used for the restoration of primary teeth did not differ in terms of surface roughness. In literature, surface roughness of GICs was assessed after completion of the polishing steps (15, 16) and after the application of the material against a matrix (9). In this study, we tried to measure GICs surface roughness after teeth restoration clinical procedures in uncooperative patients.
Surface roughness was always higher than 0.2 μm, that is the threshold value of Ra below which there is no plaque formation (supra- and sub gingival) (9).
Most of the papers in literature did not show Ra values lower than 0.2 μm apart from the areas resulting from compressing GIC against a matrix, which represent the surfaces as smooth as possible (9). Other clinically irrelevant studies have obtained a surface smoother than 0.2 μm but the GIC samples were produced placing a glass plate on the surface (2, 9).
After application of GICs in the cavity, it is often clinically necessary to remove excess material or recontouring the restoration (16), although this was achieved with a matrix. After using a matrix and finishing the surface with an abrasive strip, a rougher surface (6) can be often obtained. Ending the restoration with the matrix obtained, the result is a polymer-rich and relatively unstable GIC (4). For some materials Van Meerbeek B et al. (17) have found a surface roughness lower than 0.2 μm but only after polishing with 4000 grit silicone carbide paper. However, often times in uncooperative patients polishing and finishing cannot be performed during teeth restoration; this is particularly true in patients with “special needs” where the pediatric dentist has a short period to perform the necessary procedures.
In this study, he resulting values were also higher than 0.5 microns (18) that represent the tongue limit of roughness distinction. Only RM-GIC used in combination with its proper coating reached roughness values close to this discomfort threshold.
Ra values of 1–1.5 μm were shown in surfaces obtained with various steps of finishing, performed immediately after light curing (9, 15, 16). Finishing and polishing steps are complicated by the heterogeneity of these materials (15, 16). During these steps, it is easier to abrade the soft matrix, leaving the hard glass particles protruding from the surface (16). Compared to conventional ones, because of their higher hardness, RMGICs show a lower reduction of surface roughness after polishing.
Reduced values of roughness were obtained when finishing and polishing were made after a week, since these steps were performed after the complete hardening of the matrix (19). The value of roughness obtained, however, did not reach the limit of 0.2 microns. Performing finishing and polishing after 7 days also decreased bacterial microleakage (20). This phenomenon was attributed to moisture contamination and dehydration caused by the procedures of finishing and polishing during the initial acid-base reaction (21).
Another cause of material roughness is partly the incorporation of air bubbles during manual mixing of powder and liquid. With encapsulated materials, too mechanical vibrations may include air during mixing (9, 18). Moreover viscosity can add a higher level of porosity to GICs thus increasing roughness of HVGIC in this study. The particle size difference of GICs influence physical properties such as fracture toughness, compressive strength, abrasion resistance and surface microhardness (22). Also the surface roughness of GICs is dependent partly on their particle size range (16). In this study, materials with bigger average particle size (Fuji IX GP Fast) have shown a higher surface roughness median value. The mean particle size of Vitremer is 6.25 μm, while that of Fuji IX GP Fast is approximately 7 μm. The mean particle size of regular Fuji IX GP is much larger (13.5 μm). Vitremer show a more homogeneous distribution between small and large particles (17).
According to Gladys and van Meerbeek (17), conventional GICs presented larger mean particle sizes. Moreover, these cements are more sensitive to water (7) and have longer setting time (17).
Although high surface roughness values were obtained by GICs, microbiological tests did not show any changes in comparison to healthy teeth. This is due to the antibacterial activity of the fluoride content in these materials (7). The release of fluoride has a specific bactericidal effect on Streptococcus Mutans, but only for a relatively short period of time (23).
The system used to simulate filling procedures could produce a large spread of values, also among the different areas of the same restoration. Using filling instruments only - without any finishing procedure - it is impossible to get a homogeneous surface. This lack of homogeneity is also due to the nature of the material that changes and hardens during the placement for the self-curing reaction. Surface heterogeneity has been highlighted by a statistical analysis that did not show statistical difference. Statistical analysis also indicates that some areas present outlying values. Even if some areas have shown a low degree of roughness, it is almost impossible not to find a part of the restoration with a high value of roughness. This spread of data is the main cause of the absence of statistical significance in this study, even if groups present different mean values of roughness. Other studies show more homogeneous and smoother surfaces obtained on specimens following polishing procedures that cannot always be applicable.
In this study, no statistically significant differences were observed among the surfaces regardless of the presence of the coating.
Data obtained with this study disagree with those obtained by Salama et al. (24) that show a statistically significant difference in the use of coating. However, in this study GIC specimens were prepared pressing the material against glass slabs.
Surface protection was further discussed by many studies. Early found that an improvement of the hydration-dehydration problem was obtained after the application of varnish (25). More recent and deeper studies have strongly recommended protecting the surface of GICs to preserve water balance in the system (26).
Results of study show that the use of coating reduces surface roughness of GICs either for HVGICs than for RMGICs, even though this reduction is not statistically significant.
SEM analysis shows that there are differences in the relationships between GIC and his specific coating. Fuji IX and GC-Coat show a close interdigitation for the entire interface whereas Vitremer and Finishing Gloss present areas of weaknesses where there isn’t a close connection between the two materials.
Lower viscosity means a low contact angle between the resin and the surface of the restoration, which provides for the best protection (26), and favors the presence of gaps in the interface between the two materials.
There is a theoretical relation between contact angle and roughness expressed in the Wenzel equation. But to ensure this relationship an ideal solid and homogeneous surface is necessary (27). GIC surfaces are heterogeneous and thus the Wenzel equation cannot explain any influence of roughness on contact angle. Influence of roughness on the contact angle of this non-ideal surface cannot be assumed (27).
These gaps are not directly correlated with surface roughness, but they could represent areas of lower resistance. A problem of the coatings is their resistance under masticatory loads. Where there isn’t a close relation between GIC and coating, it is easier to find a break between the two materials.
A bonding failure between GIC and the coating could create a high-roughness area and a gap. Moreover, all those benefits given by coating like fluoride release (28) and microleakage resistance (29) would be lost.
Additionally, the bond strength of glass ionomer cements has not been negatively influenced by early access to water (30), therefore contrary to the instructions issued by most manufacturers, there is no need for a resin coating.
The problem of coatings with uncooperative patients is that two additional steps are required for positioning: coating brushing on surface and light curing. These procedures are not always possible with this type of patients, for which glass ionomer cements are more indicated.
For future developments, our research shall be focused on samples with a wider bearing surface and parallel to the planar surface that will be evaluated.
Further studies are necessary in order to clarify the influence of the type of mixing on surface roughness, resistance of coating under continuous masticatory loads and clinical outcomes of GICs protection.
Conclusions
Within the limitation of this in vitro study, coated surface of glass ionomer cements showed a surface roughness similar to uncoated ones.
Vice versa, better performances were detected for marginal sealing ability. However, a better interaction with proper coating was detected with highly viscous glass ionomer cements compared to resin modified glass ionomer cements.
References
- 1.Wilson AD, Kent BE. A new translucent cement for dentistry. The glass ionomer cement. Br Dent J. 1972;132:133–135. doi: 10.1038/sj.bdj.4802810. [DOI] [PubMed] [Google Scholar]
- 2.da Silva RC, Zuanon ACC. Surface Roughness of Glass Ionomer Cements Indicated for Atraumatic Restorative Treatment (ART) Braz Dent J. 2006;17:106–109. doi: 10.1590/s0103-64402006000200004. [DOI] [PubMed] [Google Scholar]
- 3.Brito CR, Velasco LG, Bonini GA, Imparato JC, Raggio DP. Glass ionomer cement hardness after different materials for surface protection. J Biomed Mater Res A. 2010;93:243–246. doi: 10.1002/jbm.a.32524. [DOI] [PubMed] [Google Scholar]
- 4.Sidhu SK. Glass-ionomer cement restorative materials: a sticky subject? Aust Dent J. 2011 Jun;56(Suppl 1):23–30. doi: 10.1111/j.1834-7819.2010.01293.x. [DOI] [PubMed] [Google Scholar]
- 5.Wan AC, Yap AUJ, Hastings GW. Acid-base complex reactions in resin-modified and conventional glass ionomer cements. J Biomed Mater Res. 1999;48:700–704. doi: 10.1002/(sici)1097-4636(1999)48:5<700::aid-jbm15>3.0.co;2-1. [DOI] [PubMed] [Google Scholar]
- 6.Bagheri R, Burrow MF, Tyas MJ. Surface characteristics of aesthetic restorative materials - an SEM study. J Oral Rehabil. 2007;34:68–76. doi: 10.1111/j.1365-2842.2006.01608.x. [DOI] [PubMed] [Google Scholar]
- 7.Rios D, Honório HM, Araújo PA, Machado MA. Wear and superficial roughness of glass ionomer cements used as sealants, after simulated tooth brushing. Pesqui Odontol Bras. 2002;16:343–348. doi: 10.1590/s1517-74912002000400011. [DOI] [PubMed] [Google Scholar]
- 8.Quirynen M, Bollen CM. The influence of surface roughness and surface-free energy on supra- and subgingival plaque formation in man. A review of the literature. J Clin Periodontol. 1995;22:1–14. doi: 10.1111/j.1600-051x.1995.tb01765.x. [DOI] [PubMed] [Google Scholar]
- 9.Bollen CM, Lambrechts P, Quirynen M. Comparison of surface roughness of oral hard materials to the threshold surface roughness for bacterial plaque retention: a review of the literature. Dent Mater. 1997;13:258–269. doi: 10.1016/s0109-5641(97)80038-3. [DOI] [PubMed] [Google Scholar]
- 10.Sidhu SK, Sheriff M, Watson TF. In vivo changes in roughness of resin-modified glass ionomer materials. Dent Mater. 1997;13:208–213. doi: 10.1016/S0109-5641(97)80028-0. [DOI] [PubMed] [Google Scholar]
- 11.Cattani-Lorente MA, Dupuis V, Payan J, Moya F, Meyer JM. Effect of water on the physical properties of resin-modified glass ionomer cements. Dent Mater. 1999;15:71–78. doi: 10.1016/s0109-5641(99)00016-0. [DOI] [PubMed] [Google Scholar]
- 12.Sidhu SK, Sherriff M, Watson TF. The effects of maturity and dehydration shrinkage on Resin-modified glass-ionomer restoration. J Dent Res. 1997;76:1495–1501. doi: 10.1177/00220345970760081201. [DOI] [PubMed] [Google Scholar]
- 13.Shintome LK, Nagayassu MP, Di Nicoló R, Myaki SI. Microhardness of glass ionomer cements indicated for the ART technique according to surface protection treatment and storage time. Braz Oral Res. 2009;23:439–445. doi: 10.1590/s1806-83242009000400014. [DOI] [PubMed] [Google Scholar]
- 14.van Dijken JW. 3-year clinical evaluation of a compomer, a resin-modified glass ionomer and a resin composite in Class III restorations. Am J Dent. 1996;9:195–198. [PubMed] [Google Scholar]
- 15.Yap AU, Ng JJ, Yap SH, Teo CK. Surface finish of resin-modified and highly viscous glass ionomer cements produced by new one-step systems. Oper Dent. 2004;29:87–91. [PubMed] [Google Scholar]
- 16.Yap AU, Tan WS, Yeo JC, Yap WY, Ong SB. Surface texture of resin-modified glass ionomer cements: effects of finishing/polishing systems. Oper Dent. 2002;27:381–386. [PubMed] [Google Scholar]
- 17.Gladys S, Van Meerbeek B, Braem M, Lambrechts P, Vanherle G. Comparative physico-mechanical characterization of new hybrid restorative materials with conventional glass-ionomer and resin composite restorative materials. J Dent Res. 1997;76:883–894. doi: 10.1177/00220345970760041001. [DOI] [PubMed] [Google Scholar]
- 18.Jones CS, Billington RW, Pearson GJ. The in vivo perception of roughness of restorations. Br Dent J. 2004;196:42–45. doi: 10.1038/sj.bdj.4810881. [DOI] [PubMed] [Google Scholar]
- 19.Yap AU, Ong SB, Yap WY, Tan WS, Yeo JC. Surface texture of resin-modified glass ionomer cements: effects of finishing/polishing time. Oper Dent. 2002;27:462–467. [PubMed] [Google Scholar]
- 20.Lim CC, Neo J, Yap A. The influence of finishing time on the marginal seal of a resin-modified glass-ionomer and polyacid-modified resin composite. J Oral Rehabil. 1999;26:48–52. doi: 10.1046/j.1365-2842.1999.00323.x. [DOI] [PubMed] [Google Scholar]
- 21.Mount GJ, Makinson OF. Glass-ionomer restorative cements: clinical implications of the setting reaction. Oper Dent. 1982;7:134–141. [PubMed] [Google Scholar]
- 22.Yli-Urpo H, Lassila LV, Närhi T, Vallittu PK. Compressive strength and surface characterization of glass ionomer cements modified by particles of bioactive glass. Dent Mater. 2005;21:201–209. doi: 10.1016/j.dental.2004.03.006. [DOI] [PubMed] [Google Scholar]
- 23.Forss H, Jokinen J, Spets-Happonen S, Seppä L, Luoma H. Fluoride and mutans streptococci in plaque grown on glass ionomer and composite. Caries Res. 1991;25:454–458. doi: 10.1159/000261410. [DOI] [PubMed] [Google Scholar]
- 24.Salama FS, Schulte KM, Iseman MF, Reinhardt JW. Effects of repeated fluoride varnish application on different restorative surfaces. J Contemp Dent Pract. 2006;7:54–61. [PubMed] [Google Scholar]
- 25.Mount GJ. Clinical placement of modern glass-ionomer cements. Quintessence Int. 1993;24:99–107. [PubMed] [Google Scholar]
- 26.Karaoğlanoğlu S, Akgül N, Ozdabak HN, Akgül HM. Effectiveness of surface protection for glass-ionomer, resin-modified glass-ionomer and polyacid-modified composite resins. Dent Mater J. 2009;28:96–101. [PubMed] [Google Scholar]
- 27.Aguilar-Mendoza JA, Rosales-Leal JI, Rodríguez-Valverde MA, González-López S, Cabrerizo-Vílchez MA. Wettability and bonding of self-etching dental adhesives. Influence of the smear layer. Dent Mater. 2008;24:994–1000. doi: 10.1016/j.dental.2007.11.013. [DOI] [PubMed] [Google Scholar]
- 28.Kotsanos N, Dionysopoulos P. Lack of effect of fluoride releasing resin modified glass ionomer restorations on the contacting surface of adjacent primary molars. a clinical prospective study. Eur J Paediatr Dent. 2004;5:136–142. [PubMed] [Google Scholar]
- 29.Magni E, Zhang L, Hickel R, Bossù M, Polimeni A, Ferrari M. SEM and microleakage evaluation of the marginal integrity of two types of class V restorations with or without the use of a light-curable coating material and of polishing. J Dent. 2008;36:885–891. doi: 10.1016/j.jdent.2008.07.003. [DOI] [PubMed] [Google Scholar]
- 30.Wang XY, Yap AU, Ngo HC. Effect of early water exposure on the strength of glass ionomer restoratives. Oper Dent. 2006;31:584–589. doi: 10.2341/05-106. [DOI] [PubMed] [Google Scholar]


