

Abstract
Purpose:
To quantify spatial and temporal inflammation-induced changes in vascular permeability and macrophage infiltration in guinea-pig (GP) cochlea using MRI.
Materials and Methods:
GPs were injected with lipopolysaccharide (LPS) to induce cochlear inflammation. One group was injected with a gadolinium based contrast agent (GBCA) and dynamic contrast enhanced (DCE)-MRI was performed at 4, 7, and 10 days after LPS treatment. A two-compartment pharmacokinetic model was used to determine the apparent rate constant of GBCA extravasation (Ktrans). A second group was injected with ultrasmall superparamagnetic iron oxide particles (USPIOs) and studied at 2, 3, and 7 days after LPS treatment to detect tissue USPIO uptake and correlate with histology. For both groups, control GPs were scanned similarly.
Results:
The signal enhancement increased substantially and more rapidly at day 4 in LPS-treated than in control cochlea shortly following GBCA injection. Ktrans of LPS-treated cochlea was maximum on day 4 at 0.0218±0.0032 min−1 and then decreased to control level at 0.0036±0.0004 min−1 by day 10. In the second group, the relative signal intensity and T2 in cochlear perilymphatic spaces on day 2 decreased, on average, by 54% and 45%, respectively, compared with baseline and then remained under control levels by day 7. This suggests the infiltration of inflammatory cells, although unconfirmed by histology.
Conclusion:
This provides the first measurement of cochlear vascular permeability using MRI and a quantitative evaluation of the development of cochlear inflammation. MRI holds considerable potential for the assessment of disease processes such as clinical diagnosis of conditions such as labyrinthitis.
Keywords: cochlear inflammation, lipopolysaccharide, MRI, vascular permeability, ultrasmall superparamagnetic iron oxide, blood-labyrinth barrier
HEARING LOSS FROM injury and disease of the auditory sensory organ, the cochlea, affects a large and increasing proportion of the population (1,2). There is a need to understand the mechanisms of cochlear injury to develop targeted treatments for hearing loss. Cochlear degeneration and the associated hearing loss occur from a great variety of causes including genetic abnormalities, aging, noise exposure, drug ototoxicity (e.g., aminoglycoside antibiotics and anti-cancer drugs), trauma, and infection. Inflammation of the inner ear is thought to be a major contributor to the development of cochlear injury and the concomitant sensorineural hearing loss from many different causes, as well as a consequence of inner ear surgery, for example, cochlear implantation (3). Cochlear inflammation caused by middle or inner ear infections, trauma and noise exposure, has been characterized in animal models (4,5). Treatment with steroids, such as dexamethasone, can mitigate the injury and hearing loss in animals (6). Inflammation is also assumed, rather than diagnosed, in many clinical conditions affecting the inner ear, and steroids are the treatment of choice (6). However, there is scarce direct evidence of inflammation occurring in these clinical conditions and very little evidence of the dynamics of the inflammatory responses in the human inner ear (7,8). Understanding the inflammatory processes, and being able to determine its time course and stages in an individual patient, would aid the diagnosis of the type and location of cochlear injury, and lead to the development of targeted treatments to reduce the deleterious effects of inflammation on the delicate structures of the inner ear.
The location of inner ear tissues deep within the temporal bone of the skull is a significant impediment to identifying any disease process in the inner ear. This is particularly an issue when investigating or identifying detrimental processes such as inflammatory disease in the human inner ear. The current knowledge of inner ear inflammation mostly stems from animal studies involving tissue collection and histological or molecular analysis of inflammatory markers, whereas little is known about the progression of inflammatory disease in the living inner ear.
Recent developments in MRI offer exciting opportunities for studying structure, function and metabolism of the intact, living cochlea. Visualization of cochlear structures in animals and humans can be achieved with high field strength magnets (9-11) as well as some quantification in animals, but these have been limited to the differentiation and quantification of cochlear fluid compartments, and quantification in terms of relative signal intensity of the uptake of gadolinium based contrast agent (GBCA) in some cochlear fluid spaces (12,13). However, all the studies (10,11,14) to date essentially have been qualitative and, very few have looked at the dynamic changes during cochlear inflammation (7,8). MRI has been used clinically in an attempt to assess cochlear disorders (9-11,14,15), particularly the changes in the dimensions of the fluid compartments associated with Menière's disease and any changes that may underlie sudden sensorineural hearing loss. For the purpose of this study, the dynamic contrast enhanced-MRI technique and macrophage imaging approach using iron oxide particles are of particular interest.
Dynamic contrast enhanced-MRI (DCE-MRI) involves the acquisition of a series of T1-weighted images before and after the injection of a paramagnetic contrast agent. The application of a pharmacokinetic (PK) model to these acquired data permits the calculation of meaningful physiological parameters; namely, the volume transfer rate constant of contrast agent extravasation (Ktrans) and the volume fraction of the extravascular, extracellular space (EES, νe) of the tissue of interest. The original DCE-MRI PK model was described more than 10 years ago (16), and numerous alternate models have been described since (17-24). To date however, quantitative DCE-MRI has not been applied to calculate changes in vascular permeability in the normal or diseased inner ear. Macrophage infiltration may be visualized noninvasively by use of superparamagnetic iron oxide nanoparticles which are taken up by the monocyte-macrophage system (25,26) and predominantly affect the transverse relaxation time. These nanoparticles have found many potential medical applications for the detection of diseases involving an inflammatory response (27) and are seen as having a great potential for the assessment of the therapeutic efficacy of inflammatory diseases developing in the central nervous system (28). To date, one specific type of superparamagnetic iron oxide nanoparticle was reported to facilitate the differentiation between the two cochlear fluids when injected directly into the rat cochlea (29). However, there has been no report of their use for the study of cochlear inflammation.
Our approach has been to develop MRI techniques to probe inner ear function and to use specific bio-markers of disease processes to qualitatively and quantitatively define the dynamics (admittedly on the relatively long time scale enabled by MRI) and chronic progression of disease processes in an individual. Here we report the use of DCE-MRI and ultrasmall superparamagnetic iron oxide particles (USPIOs) to quantify changes in vascular permeability and to characterize the recruitment of phagocytic cells into the cochlear tissues in a guinea-pig model of inner ear inflammation. This research also provides a translational pathway for cochlear imaging and development of MR as diagnostic tools for human inner ear diseases.
MATERIALS AND METHODS
Animal Model of Inflammation
The experiments were undertaken on 3- to 5-week-old guinea-pigs of either sex supplied by the animal facility at the University of Auckland. All experimental procedures described in this study were approved by the University of Auckland Animal Ethics Committee.
For all experiments, cochlear inflammation was induced by the transtympanic injection of bacterial lipopolysaccharide (LPS), as described previously (30). Guinea-pigs were sensitized intraperitoneally (i.p.) with LPS (0.01% w/v, 0.8 mg/kg, Escherichia coli serotype 055:B5 [Sigma-Aldrich, St Louis, MO]) followed by bilateral intra-tympanic injection of LPS (1% w/v, 30 μL/tympanum) 24 h later under isoflurane anesthesia (5% induction and 2–2.5% maintenance in oxygen). Control guinea-pigs were either untreated or were injected with saline (2 mL, i.p.) followed by bilateral intra-tympanic injection of saline (30 μL/tympanum) 24 h later.
Experimental Groups
To study the changes in vascular permeability LPS-treated guinea-pigs (n=8) were scanned at 4 days (n=7), 7 days (n=4) and 10 days (n=3) after LPS treatment. Control, untreated guinea-pigs (n=5): (3 of 5) were scanned once (at day 0) while the saline-treated guinea-pigs (2 of 5) were each scanned at 4, 7, and 14 days after saline treatment. All time points in this study are defined relative to intraperitoneal injection of LPS or saline (day 0). Because of the repeated scanning of these animals, the intravenous injection of GBCA (described later) was undertaken before the animal was introduced into the scanner thus minimizing the amount of surgical trauma to expose the vessels. However, this led to a time lag between the GBCA injection and the initial post-GBCA injection scan of approximately 10 min. To estimate early changes in vascular permeability and in the concentration of the contrast agent in plasma an indwelling catheter was inserted into the jugular vein of two LPS-treated and one saline-treated guinea-pig to deliver GBCA when the animal was inside the scanner. These animals were scanned once at 4 days after treatment in a set of terminal experiments. Six guinea-pigs could not be included in this study because they died following the bilateral intra-tympanic LPS injection as a result of the anesthesia or died during the first MR scan due to repetitive anesthesia. Three postmortems were carried out and revealed a pre-existing lung conditions on one of these guinea-pigs.
In the second study undertaken to investigate the recruitment of macrophages into the cochlear tissues, LPS-treated guinea-pigs (n=8) were scanned before LPS treatment (baseline, n=8) and at 2 days (n=6), 3 days (n=3), 4 days (n=2), and 7 days (n=2) after LPS treatment. Saline-treated control guinea-pigs (n=2) were scanned before (baseline) and 2 days after saline treatment. These guinea-pigs received a single injection of ultrasmall superparamagnetic iron oxide particles (USPIOs; 50 mg/kg; P904, Guerbet Research, France) in the femoral vein immediately after the transtympanic injection of LPS or saline. The USPIO dose and the timing of the injection were determined in a pilot study, where concentrations (12–50 mg/kg) were evaluated at 2 and 4 days after LPS treatment in guinea-pigs (n=3). As described in the results section, a change in cochlear signal was only observed with 50 mg/kg administered at day 2 after LPS treatment and so this combination was used for the remainder of the study.
Surgery for Contrast Agent Delivery
For the terminal set of experiments, guinea-pigs were anaesthetized using urethane (1.6 g/kg, i.p., Sigma) and a small incision was made on the right side of the neck to insert a cannula (26 G, Shoof international Ltd, New Zealand) in the jugular vein for the injection of the contrast agent. For all other animals, the contrast agent was injected into the femoral vein. The upper medial aspect of the hind leg was shaved, disinfected with Povidone Iodine (10% w/v) and a small incision of approximately 1 cm was made parallel to the femoral vein. A needle (30 G 1/2 inch) was inserted in the femoral vein and the contrast agent was then injected at a maximum rate of 1 mL/min. After injection, the incision was sutured with silk thread and antimicrobial compound applied.
Acquisition of MR Images
All MR scans were performed on a UnityInova 4.7 Tesla (T) MRI system (Agilent Technologies, Santa Clara, CA) using gradients with a maximum gradient strength of 20G.cm−1 and a rise time of 375 μs. Images were acquired using a 72 mm inner diameter radiofrequency coil (m2m Imaging Corp., Cleveland, OH). Guinea-pigs were anaesthetized with isoflurane (5% induction and 2–2.5% maintenance) and body temperature was maintained at 37° C by circulating warm air through the magnet bore. The guinea-pigs’ heart and respiration rate, and body temperature were monitored throughout the scan (Model 1025, SA Instruments Inc., New York). The guinea-pigs were positioned in the magnet and scout images were acquired for each animal to aid in positioning the inner ear tissues in the magnet.
In the first study, the longitudinal relaxation time constants (T1) of cochlear water protons were measured using a variable flip angle technique (31). Briefly, most of the guinea-pigs (n=7) were scanned using a two-dimensional (2D) spoiled gradient echo sequence keeping the repetition time constant (TR=300 ms) and varying the flip angle (FA; acquisition matrix=256 × 256; field of view [FOV]=60 mm × 60 mm; slice thickness [Thk]=2 mm; FA=[10°, 20°, 25°, 30°, 40°, 60°, and 80°]).
Dynamic Contrast-Enhanced MRI
Immediately after T1 measurement, a dynamic contrast enhanced MRI (DCE-MRI) approach was used and all subsequent scans were based on a slab-selective 3D gradient recalled echo sequence: TR=20 ms; TE=4.5 ms; FA=10° or 50° with a spoiling gradient strength of duration 1000 μs and amplitude 2 G.cm−1 to track changes in signal intensity over time (18,32). A single coronal T1-weighted volume set of MR images (T1-w coronal, acquisition matrix=512 × 256 × 16 and FOV=80 mm × 50 mm × 12 mm, TR=20 ms, TE=4.5 ms, FA=50°, single average, total acquisition time=81 s) was acquired as a reference for post-image analysis. A single coronal proton density-weighted volume set of MR images (PD-w coronal) with identical parameters except for the FA (10°) and the number of signal averages (n=4) was acquired to facilitate the localization of inner ear tissues on corresponding T1-w coronal. Following these scans, the guinea-pig was removed from the scanner, injected with a single bolus (ranged from 40 to 60 s) of gadolinium-diethylenetriaminepentaacetate-bismethylamide (GBCA, 500 mmol/L, Gadodiamide, Omniscan, GE Healthcare, New Jersey) at a dose of 1.5 mmol/kg as described above, and then the guinea-pig was rapidly re-positioned in the scanner at the same location. This method was preferable for repeated experiments on the same guinea-pig as this surgical technique is less invasive than the insertion of an indwelling catheter. The same DCE-MRI coronal series was then run approximately every 3 min for up to 65 min to detect and track the effect of GBCA on T1-w signal intensity of water protons in the inner ear tissues. The final acquisition was a PD-w coronal to check again the location of tissues of interest.
In the terminal set of experiments, the cannulated guinea-pigs were scanned before and immediately after the end of the injection of the single bolus of GBCA (1.5 mmol/kg, delivered through an infusion line as a bolus, 1.2 mL/min on average) alternating the acquisition of T1-w sequences (T1-w axial (TR=20 ms, TE=3 ms, acquisition matrix=256 × 256 × 16 and FOV=50 mm × 50 mm × 10 mm, FA=50°) and T1-W along the modiolus of the cochlea (TR=20 ms, TE=4.5 ms, acquisition matrix=512 × 256 × 16 and FOV=60 mm × 60 mm × 12 mm, FA=50°)).
To allow for signal intensity comparison between MR acquisitions, a 0.2-mL Eppendorf tube containing 5 mM GBCA was placed adjacent to the guinea-pig head so that the tube was clearly visible in T1 weighted coronal acquisitions.
MRI with USPIO
In the second study, the recruitment and distribution of macrophages into the cochlea was assessed on T2-weighted (T2-w) MR images by the decreases in relative signal intensity and in transverse relaxation time constant T2 generated by the presence of USPIOs assumed to be taken up by circulating macrophages (25-27). The guinea-pigs were anaesthetized with isoflurane as described previously and initially scanned using a scout followed by a fast spin echo sequence to rapidly localize the cochleae and appropriately orient a slice maximizing cochlear tissue coverage on both sides (i.e., a slice depicting the three cochlear turns), using VnmrJ software tools (Agilent Technologies). They were then scanned using a turbo spin echo sequence (TSE) with appropriate spatial resolution (high spatial resolution TSE; acquisition matrix=512 × 512, FOV=60 mm × 60 mm, Thk=0.7 mm, TR=2 s, echo-spacing=15 ms, echo train length=8, effective TE=75 ms, 16 signal averages, total acquisition time=34 min). For T2 calculations, some of the LPS-treated guinea-pigs (n=3) and the saline-treated guinea-pigs were then scanned using a multi-slice spin echo (SE), generating a series of five T2-w images (low spatial resolution SE; acquisition matrix=256 × 128, TR=2 s, TE=[14,20,40,60,100]ms). A 15-mL Falcon tube containing 10 mM copper (II) sulfate (CuSO4, Scharlab S.L., Sentmenat, Barcelona, Spain) solution was placed on the guinea-pig back to allow for comparison between MR acquisitions and this was clearly visible in T2 weighted TSE images.
Image Analysis
In the first group of animals, regions of interest (ROIs) covering inner ear tissues on both sides, gray matter, masseter muscle, and the reference tube were manually selected on PD-w coronal and the superior sagittal sinus was manually selected on T1-w axial using ImageJ (version 1.44, National Institutes of Health, Bethesda, MD). The signal intensities were estimated on individual T1-w slices using the “multi measure” plugin in ImageJ and normalized against the reference tube signal intensity (GBCA solution) to ensure consistency among all recorded data sets. In some instances, ROIs were adjusted on individual T1-w slices to correct for occasional animal head movements during the scan. The signal enhancement was then defined as the ratio of the relative signal intensities before and after injection of GBCA.
In the second group, ROIs in the brain tissues, perilymphatic spaces of the basal, middle and apical cochlear turns, modiolus and, the reference tube were manually selected on the high and low spatial resolution MR images. In the latter set of images, ROIs were manually selected using the TE=20 ms image with an additional circular ROI to estimate the background noise. T2 values for all data sets were calculated using a linear regression on the Neperian logarithm of the average of the pixel values in ROIs corrected by the background noise. T2 maps were generated using the “MRI Analysis Calculator” plugin in ImageJ. The signal intensity was estimated and normalized against the reference tube signal intensity (CuSO4 solution) for consistency.
A Two-Compartment Pharmacokinetic Model
Based on the two-compartment pharmacokinetic (PK) model reported by Tofts et al (16), an estimate was made of the apparent rate constant for GBCA leakage (Ktrans) from the vascular space into the extravascular, extracellular space (EES) of the cochlear tissues. Assuming a similar tissue volume partitioning in humans and in guinea-pigs, the volume of cochlear tissue was calculated by using the cylindrical volume formula (measuring the diameter and the height, respectively, 6 mm and 4 mm on Fig. 1a in Swan et al) (33). The EES was approximated by the volume of perilymph (70 μL as reported in Swan et al) (33) per unit of cochlear tissue volume (νe=0.62). Assuming a linear relationship between water=proton relaxation rate constants and GBCA concentration, i.e., making the assumption that water exchange between the EES and the extravascular-intracellular space is in the fast exchange limit, the concentration curve for cochlear tissues Ct (t) can be then expressed as:
| (1) |
where rGd is the longitudinal relaxivity of GBCA at 4.7T (3.6 s−1mM−1 as reported in (35), is the inverse longitudinal relaxation time constant pre-Gd (found to be 0.424 s−1 for cochlear tissues in this study and 0.61 −1 for blood as reported Rooney et al) (34), S0 and SGd (t) are the ROI relative signal intensity levels before and after GBCA injection measured from the T1-w coronal images. S0 represents a numerical average for the ROI at times before GBCA administration and SGd (t) is the time dependent relative signal intensity due to varying tissue levels of GBCA post-administration. Equation (1) also assumes a linear association between SGd (t)/S0 and R1Gd (t)/R10. To calculate Ct(t) in cochlear tissues all the signal enhancement curves SGd (t)/S0 were extrapolated between t=0 and the first data point acquired for each data set except the ones from the terminal set of experiments. According to the standard Tofts model (16) the time dependence of tissue GBCA concentration (Ct) depends on plasma GBCA concentration (Cp) as:
| (2) |
Figure 1.

Location of the cochlea in the guinea-pig skull. a: In vivo proton density MRI (156 μm × 234 μm × 750 μm) obtained 75 min after GBCA injection using a slab-selective 3D Gradient Recalled echo sequence (acquisition matrix=512 × 256 × 16 and FOV=80 mm × 60 mm × 12 mm, TR=20 ms, TE=4.5 ms, FA=10°, 4 signal averages, total acquisition=time 5 min 28 s). b,c: Magnified right white rectangle in a shows cochlear structures (b) identified in a mid-modiolar cochlear histological section (c). c: This panel demonstrates the three fluid-filled cochlear compartments: scala tympani (ST), scala media (SM), and scala vestibuli (SV); the auditory sensory organ, the organ of Corti (OC), modiolus (Mod), spiral ganglion (SG), stria vascularis (Sv), and spiral ligament (SLg). The scala media is filled with endolymph, whereas scala tympani and vestibuli are filled with perilymph. Lateral wall tissues of the cochlea (Sv and SLg) are highly vascularized and characterized by the existence of the blood labyrinthine barrier which allows selective transport of ions, metabolites and nutrients to cochlear tissues.
The GBCA concentration in blood was estimated using the signal intensities of the superior sagittal sinus from T1-w axial images after contrast injection using Eq. (1) and used as an approximation of the arterial input function of the cochleae. The plasma GBCA concentration (Cp) was determined by dividing the blood GBCA concentration by (1-hematocrit; here the hematocrit was assumed to be 0.4). kep was then estimated using Eq. (2) between t=0 and t=65 min for each data set. By definition, the relationship between Ktrans and EES (ve) and the rate constant (kep) is:
| (3) |
Ktrans was calculated for each data set using Eq. (3).
Prussian Blue Staining
The presence of iron in cochlear tissues was assessed by the Prussian Blue reaction as described previously (36). Guinea-pigs were euthanized with sodium pento-barbital (90 mg/kg i.p.) and perfused transcardially with flush solution followed by 4% paraformaldehyde (PFA) in a 0.1 M phosphate buffer (PB). After overnight fixation in 4% PFA, LPS-treated and control guinea-pig cochleae were decalcified in 5% EDTA for 10 days and then cryoprotected in 30% sucrose overnight at 4° C. The cochleae were then rinsed in 0.1 M phosphate-buffered saline (PBS, pH 7.4), snap-frozen in n-pentane and stored in a freezer (−80° C). Subsequently, the cochleae were cryosectioned (30 μm, Cryostat LEICA CM3050 S, Bio-Strategy, New Zealand) for iron staining. Cryosections of fixed cochlear tissues were washed with distilled water, incubated in potassium ferrocyanide solution (Perls Stain Kit, Biostain Ready Reagents, UK) for 20 min and then immersed in Perls solution (1:1, 2% Hydrochloric acid and 2% potassium ferrocyanide) at room temperature for 30 min. Control sections were incubated with potassium ferrocyanide solution with distilled water instead of hydrochloric acid. The sections were mounted on glass slides in glycerol/PBS (1:1) and coverslipped.
Light Microscopy
Iron staining was observed using a Nikon Eclipse 80i light microscope equipped with a digital camera (DS-5Mc, Nikon Instruments Inc., Melville, NY). Images were stored in a TIFF format using Nikon software (NIS-Elements Basic Research, v. 2.30) and identical acquisition parameters, and later, visualized on a personal computer using a viewer (IrfanView, v. 4.28, Bosnia). For each cochlea, up to five sections were observed.
Statistical Analysis
In the first study, the calculated signal enhancement of GBCA at each time point was tested over the period studied using one-way analysis of variance (ANOVA) followed by a Tukey’s multiple comparison test where n was the number of observations at each time point. Data acquired within a time periods of 5 min were averaged together to yield a signal enhancement value and associated standard error of the mean at each time point. The calculated concentrations of GBCA and Ktrans were also tested over the period studied using one-way ANOVA followed by a Tukey’s multiple comparison test where n was the total number of cochleae studied. In the second study, relative signal intensities and T2 were also analyzed using repeated one-way ANOVA followed by a Tukey’s multiple comparison test (Prism5; GraphPad Sofware Inc., CA). Relative signal intensity and T2 were reported as mean±standard error of the mean (SEM) where n was the total number of cochleae studied. For the LPS-treated guinea-pigs, the relative signal intensity was calculated using 12 cochleae at baseline, 10 cochleae at 2 days, 6 cochleae at 3 days, and 4 cochleae at 7 days after LPS treatment. For the saline-treated guinea-pigs, the relative signal intensity was calculated using two cochleae at baseline and four cochleae at 2 days. An alpha error level of 5% was used for the tests. Because the inflammation is induced in each ear separately by transtympanic LPS injections, the effect of treatment is regarded as localized where each ear responds independently.
RESULTS
MR images of the guinea-pig cochleae were obtained in all experiments: 2D T1-weighted MR images were obtained in the vascular permeability study using the 3D slab selective GRE sequence, and 2D T2-weighted low and high resolution MR images were obtained in the macrophage detection study. A representative proton density-weighted MR image shown in Figure 1 demonstrates the position and structure of the cochlea. An MR image of the cochlea is compared with a histological section in a similar anatomical plane in Figure 1 to show three fluid-filled chambers with intervening sensory and neural tissues, and the central modiolus all surrounded by the otic capsule.
Vascular Permeability
Within 15 min of the GBCA injection in control saline-treated animals there was only a slight increase in T1-weighted signal intensity in cochlear tissues and fluids, which gradually increased over the course of 60 min (Fig. 2a). In contrast, the LPS-treated animals scanned at 4 days showed a much stronger MR T1-weighted signal increase over the 1-h scan period, which is indicative of an increased GBCA extravasation (Figs. 2b and 3a). This was observed only in the perilymphatic fluid spaces, whereas the signal intensity from the endolymphatic compartment remained low throughout the scan. On days 7 and 10, the cochlear signal enhancement in these same animals was similar to the control group (Fig. 3b), indicating normalization of GBCA extravasation. In contrast, repeated scans of control guinea-pigs did not show any changes in signal enhancement in the cochlea or any other tissues (Fig. 3b). There was no change in signal enhancement following GBCA injection in the grey matter of LPS-treated or control animals (Fig. 3b).
Figure 2.

In vivo Dynamic Contrast Enhanced (DCE)-MRI (156 μm × 195 μm × 750 μm) in coronal orientation acquired after the intravenous injection of GBCA at 1.5 mmol/kg. a: T1-weighted coronal images of cochlear tissues in a control guinea-pig 4 days after saline treatment. b: T1-weighted coronal MR images of cochlear tissues in a LPS-treated guinea-pig 4 days after LPS treatment. Time points indicate the interval after GBCA administration. Reference tube was filled with 5 mM GBCA solution. Inset (magnified white rectangle) shows the marked increase in T1-w signal intensity in the cochleae of LPS-treated animals.
Figure 3.

In vivo DCE-MRI and quantification of signal enhancement at different time points following LPS treatment, the average T1-w signal enhancement at each PK time point at different days after LPS injection and the estimated concentration of contrast agent in the average cochlear tissue. a: DCE-MRI (156 μm × 195 μm × 750 μm) of a guinea-pig cochlea at 55 min following the intravenous administration of 1.5 mmol/kg GBCA and scanned sequentially at 4, 7, and 10 days. The highest signal intensity occurred in the cochlea on day 4, and there was a reduction in signal intensity at day 7 and 10. Insets (magnified cochlear ROI) show the change in signal and distribution of GBCA in the cochlea. b: The change in signal enhancement (SGd/S0 mean±SEM) after GBCA administration in cochlear tissues and grey matter (GM) in control (saline and untreated) and LPS-treated guinea-pigs at days 4, 7, and 10 and, in cochlear tissues in LPS-treated guinea-pigs on day 4 shortly after GBCA injection. Note that the signal enhancement is the greatest in the LPS-treated cochlea on day 4 (***P < 0.0001), but this returns to control levels on days 7 and 10. Signal enhancement is apparent as early as 2 min post-GBCA administration at day 4 (terminal) post-LPS injection. The fittings of each time course curve, except for GM, using the PK model are plotted and the plasma GBCA concentration variation used in the modeling is shown in the inset. The table shows the number of observations at each time point used to run the statistical tests. c: Development of inflammation in the guinea-pig cochleae as the function of GBCA concentration (Ct) in cochlear tissues (mean±SEM) calculated using Eq. (1) 60 min after GBCA injection in control untreated guinea-pigs, saline-treated, and LPS-treated guinea-pigs at days 4, 7, and 10. The (Ct) after GBCA injection increased significantly 4 days after LPS treatment (***P < 0.0001), but dropped to baseline levels on days 7 and 10 (***P < 0.0001).
As shown in Figure 3b, the signal enhancement in each cochlea increased, reaching a maximum between 55 and 65 min after contrast injection (P<0.0001). In addition, the signal enhancement in masseter muscle reached a plateau within the first 15 min and then very slowly decreased (data not shown) yielding a Ktrans of 0.015±0.004 min−1 (calculated using ROIs of masseter muscle from 4 animals and our PK model as described in the methods assuming R1=0.50s−1 and ve=0.09 as reported (18). The intracochlear concentration of GBCA reached a maximum (0.52±0.05 mM) at 4 days (Fig. 3c). This was significantly (P<0.0001) greater than untreated and saline-treated control animals (0.15±0.01 mM).
The averaged apparent vascular permeability Ktrans of the cochlea in animals 4 days after LPS treatment was 6-fold greater than Ktrans in control animals, 4- to 5-fold greater than in LPS-treated animals at 7 and 10 days (P<0.0001; Table 1). There was no significant difference between Ktrans in the control and at 7 and 10 days after LPS-treatment indicating subsequent recovery of the increased vascular permeability with inflammation.
Table 1.
Vascular Permeability Ktrans (min−1)
| Control | Day4 | Day7 | Day10 |
|---|---|---|---|
| 0.0036 ± 0.0004 |
0.0218 ± 0.0032a |
0.0054 ± 0.0009 |
0.0048 ± 0.0010 |
P < 0.0001 between day 4 and the control day 7 and day 10. Data represent mean ± SEM.
MRI USPIOs
The pilot study showed that the injection of USPIOs 24 h before scanning (12 or 50 mg/kg) had no apparent effect on the cochlear signal intensity in LPS-treated guinea-pigs at 4 days (Fig. 4) or at low concentrations at 2 days (Fig. 4). In addition, injection of USPIOs 24 h before scanning in saline-treated animals at 4 days had no effect on the signal intensity in the cochlea (Fig. 5). In contrast, the animals treated with LPS and injected with USPIOs (50 mg/kg) 24 h before scanning, showed a substantial reduction in cochlear signal intensity, predominantly in the modiolus and perilymphatic spaces of the basal, middle, and apical cochlear turns (Fig. 5). The relative signal intensity in cochlear turns seemed to progressively recover its baseline level on day 7 (Fig. 6a). It is noteworthy that the endolymphatic space was well distinguished from the perilymphatic fluid spaces, and there was no apparent change in the signal intensity (Fig. 6a). Of interest, the pilot study revealed that the injection of USPIOs 24 h before scanning on day 4 (when vascular permeability was greater than control level) did not result in a greater relative signal intensity loss suggesting that the USPIO in the cochlea is not the consequence of increased vascular permeability. Quantitative analysis revealed, on average, a significant (P<0.05) 54% and 62% reduction in the relative signal intensity in perilymphatic spaces of cochlear turns and modiolus, respectively, on day 2 compared with baseline (Fig. 6b). No changes in relative signal intensity in LPS-treated or in controls were observed in brain tissues (Fig. 6b).
Figure 4.

High resolution T2-weighted MR images (117 μm × 117 μm × 700 μm) of the cochleae in LPS-treated guinea-pigs before LPS treatment (baseline) and LPS-treated guinea-pigs injected with ultrasmall superparamagnetic iron oxide particles (USPIOs) at different concentration 24 h before being scanned at 2 (day 2) and 4 days (day 4) after LPS treatment. a,b: LPS-treated guinea-pigs injected with USPIOs at 12 mg/kg (a) or at 50 mg/kg (b) show no reduction in signal intensity in cochlear tissues indicating that no USPIOs can be detected at a time (day 4) when Ktrans is greater than control level. c: LPS-treated guinea-pig injected with USPIOs at 30 mg/kg shows no noticeable reduction in signal intensity in cochlear tissues (day 2).
Figure 5.
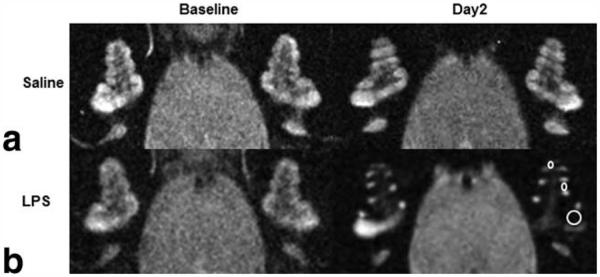
High resolution T2-weighted MR images (117 μm × 117 μm × 700 μm) of the cochleae in control and LPS-treated guinea-pigs 24 h before (baseline) and after (day2) ultrasmall superparamagnetic iron oxide particles (USPIOs) injection. a,b: A control guinea-pig shows a similar signal intensity (a), whereas a LPS-treated guinea-pig shows reduced signal intensity in cochlear perilymphatic compartments in all turns of the cochlea (b, ROIs shown in the left cochlea), indicating the presence of USPIOs 48 h after LPS treatment.
Figure 6.

The spatiotemporal profile of USPIO distribution in the guinea-pig cochlea and brain over 7 days after LPS treatment (117 μm × 117 μm × 700 μm). a: Note the hypointense signals in the perilymphatic spaces of all cochlear turns (ROIs shown in the left cochlea) 48 and 72 h after LPS treatment and the signal intensity recovery to baseline levels on day 7. b: The graph shows the mean±SEM of the relative signal intensities calculated in the brain tissues (ROI large white circle), the modiolus and for both cochleae in the basal turn (BT), middle turn (MT), and apical turn (AT). Cochlear turns and the modiolus (ROIs) are depicted in the left cochlea on day 2. The relative signal intensities calculated at baseline and on day 2 were averaged in the control group. Note that there were significant decreases in relative signal intensity between baseline and day 2 after LPS treatment in all cochlear turns (pBT=0.0005, pMT=0.0344, pAT=0.0017), and modiolus (pMod < 0.0001). In contrast, no changes in relative signal intensity were found in brain tissues within 7 days after LPS treatment (p=0.4775).
Over the course of this part of the study, the T2 maps demonstrated a similar trend to that of the relative signal intensity. On days 2 and 3, the signal intensities of cochlear tissues were very low in the MR images with TE values above 40 ms except for a few pixels located in the endolymphatic fluid space which yielded slightly greater T2 values (Fig. 7a). The change in T2 in the perilymphatic spaces of the basal, middle, and apical cochlear turns (Fig. 7b) showed a significant (P<0.05) reduction on day 2 (0.0429±0.0056 s) compared with baseline (0.0723±0.0053 s) and remained below the control levels until day 7 (0.0697±0.0044 s).
Figure 7.

Low resolution T2-weighted MR images (234 μm × 469 μm × 700 μm, TE=20 ms) and corresponding T2 maps of the saline-treated guinea-pig cochlea, and T2 maps of LPS-treated guinea-pig cochlea and brain tissues over 7 days after LPS treatment and the comparison of T2 values from ROIs covering the areas as shown in Figure 6. a: There are no noticeable differences in T2 mapping of the saline-treated guinea-pig at baseline and on day 2. b: Note that in T2 maps on days 2 and 3 the cochlear tissues were almost invisible except for few pixels located in the endolymphatic fluid space. These maps were generated using the following set of parameters for the MRI plugin: R2 > 0.90, clip value < 1 s, over/under thresholds=0.02 s/0.5 s and bilinear interpolation. c: The graph shows the mean±SEM of the T2 values calculated in the brain tissues, modiolus, and for both cochleae in the basal turn (BT), middle turn (MT), and apical turn (AT). The histological cross-section (inset) shows the location of cochlear turns. The T2 values calculated for control guinea-pigs at baseline and day 2 were averaged. Note that there were significant decreases in T2 for all cochlear turns and the modiolus between baseline and day 2 (pBT=0.0096, pMT=0.0002, pAT=0.0015, pMod=0.0112). In contrast, T2 was not significantly different in brain tissues (p=0.0844).
Histology
Histological analysis of the cochlea of animals injected with USPIOs revealed Prussian Blue staining indicative of iron particles in regions of the modiolus and lateral wall of the cochlea in LPS treated animals (Fig. 8a), which correlated well with MR findings (Fig. 8b). Few small iron clusters were also observed in the modiolus and spiral ganglion in one of the control animals (data not shown).
Figure 8.

Iron staining in the cochlea after LPS-induced inflammation and corresponding high resolution T2-w MR image and low resolution T2 map. a: Histological cross sections of the basal and middle turns showed iron staining as clusters of iron particles (rectangles) and few iron particles (arrow) (Magnification: 40 ×). b: Magnified black rectangles showing the clusters of iron particles within identified cochlear tissues. c: Left: Corresponding high resolution T2-w MR image of the guinea-pig cochlea 2 days after LPS injection showing a significant reduction in signal intensity in the perilymphatic spaces. Right: Corresponding low resolution T2 map generated using the following set of parameters for the MRI plug-in: R2 > 0.97, clip value < 1 s, over/under thresholds=0.02/0.1 s. Scale bars=100 μm in a; 25 μm in b.
DISCUSSION
In this study, we demonstrate the use of high field MRI to quantitatively and qualitatively define several key elements of the inflammatory response in the cochlea of the guinea-pig. These were a transient increase in vascular permeability between the normal and inflamed guinea-pig cochlea, which can be quantified in terms of Ktrans, and, second, a reduction in relative signal intensity associated with a decrease in the transverse relaxation time in the inflamed cochlea due to the presence of USPIOs, which is possibly due to the infiltration of phagocytic cells into the cochlea. With sequential imaging we were able to demonstrate, in the same animal, both the development and the resolution of these inflammatory changes. The study also provides, for the first time, quantitative measures of the vascular permeability (Ktrans), and hence an index of the permeability of the blood-labyrinth barrier (BLB) in the normal guinea-pig and following inflammation. These data, obtained from an animal model, have considerable implications for the assessment of inflammatory disease in the human inner ear and open up new possibilities to assess human cochlear pathophysiology using MRI.
The uptake of GBCA in cochlear fluid spaces is consistent with previous studies in normal guinea-pig and mouse cochlea (11,37), and diseased guinea-pig cochlea (12,13) observed using a 4.7T scanner. A similar slow but steady increase in relative signal intensity reflecting the uptake of GBCA into the perilymph has been observed in the normal guinea-pig (11-13) and mouse (37) cochlea and this increased significantly in both perilymph and endolymph of the guinea-pig following high intensity impulse noise (12). The latter changes following noise exposure may relate to loss of the tissue barriers between perilymph and endolymph, such as Reissners’ membrane or the organ of Corti, or disruption of the BLB (12,13). Although these previous studies have provided qualitative and quantitative evidence for the general time course of the uptake of GBCA contrast into the cochlear fluids, none of these have modeled the rate constant Ktrans to provide a quantitative index of the vascular permeability of the BLB under normal and diseased conditions.
There is an extensive literature in which Ktrans has been modeled and quantified for a variety of animal and human normal (38,39) and diseased (40,41) tissues and tumors (42) using DCE-MRI techniques similar to those described here. These studies have described the increase in Ktrans, as an index of an increase in vascular permeability, within malignant tumors, and associated with inflammation in animal models of multiple sclerosis lesions and osteoarthritis (40). Our observation of an increase in contrast extravasation with cochlear inflammation is consistent with these and with other studies in both animals and humans describing vascular changes associated with inflammation in different tissues (43-47). We conclude that the reversible changes that we observe in the signal intensity of the inner ear reflect reversible changes in vascular permeability associated with the LPS-induced inflammation of the inner ear and that this is reflected quantitatively as a 6-fold increase in Ktrans 4 days after LPS injection. The presence of an inflammatory response in the cochlea is confirmed by immunohistochemistry and the increased expression of macrophages in modiolus and lateral wall tissues (48).
With the exception of the Ktrans of the blood brain barrier in a normal subject, the averaged Ktrans values (0.004 min−1 in the untreated cochlea and 0.022 min−1 after LPS injection) are relatively low in comparison with other tissues, indicating a slow extravasation of contrast agent into the cochlea, even with inflammation. These values presumably reflect the presence of a tight blood-labyrinth barrier similar to the blood–brain barrier, affecting the permeability of the cochlear vasculature. It is interesting to note that there was no uptake in the endolymphatic compartment in both the noninflamed and inflamed cochlea, indicating that the blood-labyrinth barrier is much more restrictive in the tissues lining this compartment (scala media) relative to the perilymphatic spaces (scala tympani and scala vestibuli). Unlike other tissues, the profile of the signal enhancement from which Ktrans was calculated showed a slowly increasing time course never reaching a peak over the 65 min of measurements. Unlike other tissues where the extracellular space is relatively small and juxtaposed to the vascular bed, the cochlea has a very large extracellular fluid volume (the three fluid chambers), which are on the whole more separated from the vasculature by tissue. Although there are vessels lining the endosteum of the bony cavities, the predominant vascular supply is within the stria vascularis and spiral ligament of the lateral wall and the spiral ganglion in the modiolus. Thus the passage of contrast agent from the vasculature to the cochlear fluids, which predominantly affect T1-weighted MR images, may be affected by the diffusion through tissues as well as the movement across the vessel wall. Because of the compromise between spatial and temporal resolutions, we have treated the cochlea as a single tissue when assessing Ktrans as it is not possible to accurately resolve the MR signal from the lateral wall or modiolar tissues. Hence, our PK model does not incorporate the potential transendothelial and transcytolemmal water exchanges, which ultimately would improve the accuracy of Ktrans calculation (18,20). The arterial input function was approximated using a vein which may have led to slightly different Ktrans values. Thus, it may make comparisons with Ktrans of other tissues more difficult. Although the standard Tofts model may approximate kinetics of GBCA uptake in the whole cochlea (23), we are developing a more robust PK model accounting for the intrinsic complexity of cochlear tissues (i.e., more than two compartments, GBCA cochlear intravasation and extravasation may occur by different pathways, etc) that GBCA accesses including, but not limited to, a plasma to interstitial transport term, interstitial to fluid compartments term as well as diffusional terms within the perilymphatic spaces. This advanced step as well as the increase in dynamic and spatial resolutions should improve the accuracy for quantifying the GBCA uptake in cochlear compartments such as the perilymphatic spaces.
There was a consistent decrease in signal intensity in the inflamed cochlea with USPIO injection strongly suggesting the presence of USPIOs in the cochlear tissues which was confirmed by the Prussian Blue staining. The average 2-fold decrease of the relative signal intensities in the perilymphatic spaces and the average 1.8-fold decrease of the transverse relaxation time are, therefore, likely due to the presence of P904 USPIOs. Because USPIOs can be transported to the site of inflammation by circulating macrophages (25-27), where P904 USPIOs have been shown to be located in lysosomes (49), we interpret these findings as indicative of macrophage, or infiltrating leukocyte movement into the cochlea following inflammation, as reported by others following cochlear injury (50,51). There is the possibility that circulating USPIOs are entering the cochlea independently of macrophages. However, the lack of any change in signal in controls (no inflammation) and at times when the change in vascular permeability is maximal (on day 4 as shown by the GBCA contrast study) does not support this free passage of USPIOs into cochlear tissues. The results might therefore suggest that there is a rapid recruitment of macrophages in cochlear tissues surrounding perilymphatic spaces. Similar macrophage infiltration has been reported in other tissues where an inflammatory response develops due to multiple sclerosis (40) or following brain injuries (52). Unfortunately, our attempts to identify macrophages using CD68 immunohistochemistry were inconclusive. Whereas Prussian Blue staining often coincided with CD68 staining (KT117, clone # PM1-1K, TransGenic Inc., Kobe, Japan), there was also an upregulation of CD68 in cochlear tissues because of an increase in endogenous expression of F4/80 and CD68 markers, making it difficult to interpret the findings.
Interestingly, the endolymphatic compartment was not as affected by the presence of USPIOs as the perilymphatic compartments. No Prussian Blue staining was observed in the endolymphatic space, although it was observed in the stria vascularis and spiral ligament adjacent to this fluid compartment. Because a high concentration of iron oxide particles in the modiolus (which is a highly vascularized tissue sharing boundaries with the perilymphatic spaces) would explain the loss in signal intensities in the perilymph, it would seem that the presence of USPIOs in tissues adjacent to the endolymph is insufficient to have an impact on the MRI signal. This would also be consistent with the lack of evidence of macrophages in the endolymph, probably as a consequence of the tight junctions at the marginal (luminal) cell boundary which would impede the infiltration into this space, and the high potassium environment of the endolymph which would be toxic to phagocytic cells. However, whether the uptake of USPIOs is indeed indicative of macrophage function still needs confirmation by further study.
In conclusion, our data indicate that DCE-MRI can quantitatively monitor reversible changes in cochlear vascular permeability associated with cochlear inflammation. They also suggest that imaging using USPIO (P904) indicates the presence of phagocytic cells in a guinea-pig model of inner ear inflammation. These MR methodologies provide reference data that could be used to quantitatively assess the treatment of ear diseases in animal models and a platform for the translation of these MR imaging tools into clinical practice as markers of cochlear inflammation in patients with a hearing condition such as an autoimmune disease or sudden deafness.
Acknowledgments
Contract grant sponsor: The University of Auckland Faculty Research Development Fund; the Auckland Medical Research Foundation; the Deafness Research Foundation (NZ); the Maurice & Phyllis Paykel Trust.
REFERENCES
- 1.Listen hear! The economic impact and cost of hearing loss in Australia. Access Economics Pty Ltd; New South Wales: 2006. p. 91. [Google Scholar]
- 2.Thorne PR, Ameratunga S, Stewart J, et al. Epidemiology of noise-induced hearing loss in New Zealand. NZ Med J. 2008;121:33–44. [PubMed] [Google Scholar]
- 3.Migirov L, Kronenberg J, Volkov A. Local tissue response to cochlear implant device housings. Otol Neurotol. 2011;32:55–57. doi: 10.1097/MAO.0b013e3182009d5f. [DOI] [PubMed] [Google Scholar]
- 4.Cureoglu S, Schachern PA, Rinaldo A, Tsuprun V, Ferlito A, Paparella MM. Round window membrane and labyrinthine pathological changes: an overview. Acta Otolaryngol. 2005;125:9–15. doi: 10.1080/00016480410022534. [DOI] [PubMed] [Google Scholar]
- 5.Tornabene SV, Sato K, Pham L, Billings P, Keithley EM. Immune cell recruitment following acoustic trauma. Hear Res. 2006;222:115–124. doi: 10.1016/j.heares.2006.09.004. [DOI] [PubMed] [Google Scholar]
- 6.Haynes DS, O’Malley M, Cohen S, Watford K, Labadie RF. Intratympanic dexamethasone for sudden sensorineural hearing loss after failure of systemic therapy. Laryngoscope. 2007;117:3–15. doi: 10.1097/01.mlg.0000245058.11866.15. [DOI] [PubMed] [Google Scholar]
- 7.Mark AS, Fitzgerald D. Segmental enhancement of the cochlea on contrast-enhanced MR - correlation with the frequency of hearing-loss and possible sign of perilymphatic fistula and autoimmune labyrinthitis. Am J Neuroradiol. 1993;14:991–996. [PMC free article] [PubMed] [Google Scholar]
- 8.Sone M, Mizuno T, Naganawa S, Nakashima T. Imaging analysis in cases with inflammation-induced sensorineural hearing loss. Acta Otolaryngologica. 2009;129:239–243. doi: 10.1080/00016480802226163. [DOI] [PubMed] [Google Scholar]
- 9.Naganawa S, Ishihara S, Iwano S, Kawai H, Sone M, Nakashima T. Estimation of gadolinium-induced T1-shortening with measurement of simple signal intensity ratio between the cochlea and brain parenchyma on 3D-FLAIR: correlation with T1 measurement by TI scout sequence. Magn Reson Med Sci. 2010;9:17–22. doi: 10.2463/mrms.9.17. [DOI] [PubMed] [Google Scholar]
- 10.Naganawa S, Nakashima T. Cutting edge of inner ear MRI. Acta Otolaryngol. 2009;129:15–21. doi: 10.1080/00016480902729819. [DOI] [PubMed] [Google Scholar]
- 11.Zou J, Poe D, Bjelke B, Pyykko I. Visualization of inner ear disorders with MRI in vivo: from animal models to human application. Acta Otolaryngol. 2009;129:22–31. doi: 10.1080/00016480902729850. [DOI] [PubMed] [Google Scholar]
- 12.Counter SA, Bjelke B, Borg E, Klason T, Chen ZG, Duan ML. Magnetic resonance imaging of the membranous labyrinth during in vivo gadolinium (Gd-DTPA-BMA) uptake in the normal and lesioned cochlea. Neuroreport. 2000;11:3979–3983. doi: 10.1097/00001756-200012180-00015. [DOI] [PubMed] [Google Scholar]
- 13.Zou J, Pyykko I, Bretlau P, Klason T, Bjelke B. In vivo visualization of endolymphatic hydrops in guinea-pigs: magnetic resonance imaging evaluation at 4.7 tesla. Ann Otol Rhinol Laryngol. 2003;112:1059–1065. doi: 10.1177/000348940311201212. [DOI] [PubMed] [Google Scholar]
- 14.Pyykko I, Zou J, Poe D, Nakashima T, Naganawa S. Magnetic resonance imaging of the inner ear in Meniere’s disease. Otolaryngol Clin North Am. 2010;43:1059–1080. doi: 10.1016/j.otc.2010.06.001. [DOI] [PubMed] [Google Scholar]
- 15.Seltzer S, Mark AS. Contrast enhancement of the labyrinth on MR scans in patients with sudden hearing loss and vertigo: evidence of labyrinthine disease. AJNR Am J Neuroradiol. 1991;12:13–16. [PMC free article] [PubMed] [Google Scholar]
- 16.Tofts PS, Brix G, Buckley DL, et al. Estimating kinetic parameters from dynamic contrast-enhanced T1-weighted MRI of a diffusable tracer: standardized quantities and symbols. J Magn Reson Imaging. 1999;10:223–232. doi: 10.1002/(sici)1522-2586(199909)10:3<223::aid-jmri2>3.0.co;2-s. [DOI] [PubMed] [Google Scholar]
- 17.Buckley DL. Uncertainty in the analysis of tracer kinetics using dynamic contrast-enhanced T1-weighted MRI. Magn Reson Med. 2002;47:601–606. doi: 10.1002/mrm.10080. [DOI] [PubMed] [Google Scholar]
- 18.Landis CS, Li X, Telang FW, et al. Determination of the MRI contrast agent concentration time course in vivo following bolus injection: effect of equilibrium transcytolemmal water exchange. Magn Reson Med. 2000;44:563–574. doi: 10.1002/1522-2594(200010)44:4<563::aid-mrm10>3.0.co;2-#. [DOI] [PubMed] [Google Scholar]
- 19.Li X, Rooney WD, Springer CS. A unified magnetic resonance imaging pharmacokinetic theory: intravascular and extracellular contrast reagents. Magn Reson Med. 2005;54:1351–1359. doi: 10.1002/mrm.20684. [DOI] [PubMed] [Google Scholar]
- 20.Donahue KM, Weisskoff RM, Chesler DA, et al. Improving MR quantification of regional blood volume with intravascular T1 contrast agents: accuracy, precision, and water exchange. Magn Reson Med. 1996;36:858–867. doi: 10.1002/mrm.1910360608. [DOI] [PubMed] [Google Scholar]
- 21.Cao Y, Brown SL, Knight RA, Fenstermacher JD, Ewing JR. Effect of intravascular-to-extravascular water exchange on the determination of blood-to-tissue transfer constant by magnetic resonance imaging. Magn Reson Med. 2005;53:282–293. doi: 10.1002/mrm.20340. [DOI] [PubMed] [Google Scholar]
- 22.Kershaw LE, Cheng HLM. Temporal resolution and SNR requirements for accurate DCE-MRI data analysis using the AATH model. Magn Reson Med. 2010;64:1772–1780. doi: 10.1002/mrm.22573. [DOI] [PubMed] [Google Scholar]
- 23.Sourbron SP, Buckley DL. On the scope and interpretation of the Tofts models for DCE-MRI. Magn Reson Med. 2011;66:735–745. doi: 10.1002/mrm.22861. [DOI] [PubMed] [Google Scholar]
- 24.Bartos M, Keunen O, Jirik R, Bjerkvig R, Taxt T. Perfusion analysis of dynamic contrast enhanced magnetic resonance images using a fully continuous tissue homogeneity model with mean transit. Anal Biomed Sign Images. 2010;20:269–274. [Google Scholar]
- 25.Bulte JW, Kraitchman DL. Iron oxide MR contrast agents for molecular and cellular imaging. NMR Biomed. 2004;17:484–499. doi: 10.1002/nbm.924. [DOI] [PubMed] [Google Scholar]
- 26.Dousset V, Delalande C, Ballarino L, et al. In vivo macrophage activity imaging in the central nervous system detected by magnetic resonance. Magn Reson Med. 1999;41:329–333. doi: 10.1002/(sici)1522-2594(199902)41:2<329::aid-mrm17>3.0.co;2-z. [DOI] [PubMed] [Google Scholar]
- 27.Corot C, Robert P, Idee JM, Port M. Recent advances in iron oxide nanocrystal technology for medical imaging. Adv Drug Deliv Rev. 2006;58:1471–1504. doi: 10.1016/j.addr.2006.09.013. [DOI] [PubMed] [Google Scholar]
- 28.Weinstein JS, Varallyay CG, Dosa E, et al. Superparamagnetic iron oxide nanoparticles: diagnostic magnetic resonance imaging and potential therapeutic applications in neurooncology and central nervous system inflammatory, pathologies, a review. J Cereb Blood Flow Metab. 2010;30:15–35. doi: 10.1038/jcbfm.2009.192. [DOI] [PMC free article] [PubMed] [Google Scholar]
- 29.Zou J, Zhang W, Poe D, et al. MRI manifestation of novel superparamagnetic iron oxide nanoparticles in the rat inner ear. Nanomedicine. 2010;5:739–754. doi: 10.2217/nnm.10.45. [DOI] [PubMed] [Google Scholar]
- 30.Takumida M, Anniko M, Popa R. Possible involvement of free radicals in lipopolysaccharide-induced labyrinthitis in the guinea-pig: a morphological and functional investigation. ORL J Otorhinolaryngology Relat Spec. 1998;60:246–253. doi: 10.1159/000027605. [DOI] [PubMed] [Google Scholar]
- 31.Fram EK, Herfkens RJ, Johnson GA, et al. Rapid calculation of T1 using variable flip angle gradient refocused imaging. Magn Reson Imaging. 1987;5:201–208. doi: 10.1016/0730-725x(87)90021-x. [DOI] [PubMed] [Google Scholar]
- 32.Buckley D, Parker G. Measuring contrast agent concentration in T1-weighted dynamic contrast-enhanced MRI. Dyn Contrast-Enhanced Magn Reson Imaging Oncol. 2005:69–79. [Google Scholar]
- 33.Swan EEL, Mescher MJ, Sewell WF, Tao SL, Borenstein JT. Inner ear drug delivery for auditory applications. Adv Drug Deliv Rev. 2008;60:1583–1599. doi: 10.1016/j.addr.2008.08.001. [DOI] [PMC free article] [PubMed] [Google Scholar]
- 34.Rooney WD, Johnson G, Li X, et al. Magnetic field and tissue dependencies of human brain longitudinal 1H2O Relaxation in Vivo. Magn Reson Med. 2007;57:308–318. doi: 10.1002/mrm.21122. [DOI] [PubMed] [Google Scholar]
- 35.Geraldes CF, Urbano AM, Alpoim MC, et al. Preparation, physicochemical characterization, and relaxometry studies of various gadolinium(III)-DTPA-bis(amide) derivatives as potential magnetic resonance contrast agents. Magn Reson Imaging. 1995;13:401–420. doi: 10.1016/0730-725x(94)00117-l. [DOI] [PubMed] [Google Scholar]
- 36.Pearse AGE. Histochemistry. Little, Brown and Co; Boston: 1961. p. 998. [Google Scholar]
- 37.Zou J, Zhang W, Poe D, Zhang Y, Ramadan UA, Pyykko I. Differential passage of gadolinium through the mouse inner ear barriers evaluated with 4.7T MRI. Hear Res. 2009;259:36–43. doi: 10.1016/j.heares.2009.09.015. [DOI] [PubMed] [Google Scholar]
- 38.Faranesh AZ, Kraitchman DL, McVeigh ER. Measurement of kinetic parameters in skeletal muscle by magnetic resonance imaging with an intravascular agent. Magn Reson Med. 2006;55:1114–1123. doi: 10.1002/mrm.20884. [DOI] [PMC free article] [PubMed] [Google Scholar]
- 39.Jaspers K, Leiner T, Dijkstra P, et al. Optimized pharmacokinetic modeling for the detection of perfusion differences in skeletal muscle with DCE-MRI: effect of contrast agent size. Med Phys. 2010;37:5746–5755. doi: 10.1118/1.3484057. [DOI] [PubMed] [Google Scholar]
- 40.Floris S, Blezer ELA, Schreibelt G, et al. Blood-brain barrier permeability and monocyte infiltration in experimental allergic encephalomyelitis - A quantitative MRI study. Brain. 2004;127:616–627. doi: 10.1093/brain/awh068. [DOI] [PubMed] [Google Scholar]
- 41.Hodgson RJ, Connolly S, Barnes T, Eyes B, Campbell RS, Moots R. Pharmacokinetic modeling of dynamic contrast-enhanced MRI of the hand and wrist in rheumatoid arthritis and the response to anti-tumor necrosis factor-alpha therapy. Magn Reson Med. 2007;58:482–489. doi: 10.1002/mrm.21349. [DOI] [PubMed] [Google Scholar]
- 42.Li X, Huang W, Morris EA, et al. Dynamic NMR effects in breast cancer dynamic-contrast-enhanced MRI. Proc Natl Acad Sci U S A. 2008;105:17937–17942. doi: 10.1073/pnas.0804224105. [DOI] [PMC free article] [PubMed] [Google Scholar]
- 43.Alper CM, Tabari R, Seroky JT, Doyle WJ. Magnetic resonance imaging of the development of otitis media with effusion caused by functional obstruction of the eustachian tube. Ann Otol Rhinol Laryngol. 1997;106:422–431. doi: 10.1177/000348949710600511. [DOI] [PubMed] [Google Scholar]
- 44.Chan KH, Swarts JD, Tan L. Middle ear mucosal inflammation: an in vivo model. Laryngoscope. 1994;104:970–980. doi: 10.1288/00005537-199408000-00011. [DOI] [PubMed] [Google Scholar]
- 45.Metrikin DC, Wilson CA, Berkowitz BA, Lam MK, Wood GK, Peshock RM. Measurement of blood-retinal barrier breakdown in endotoxin-induced endophthalmitis. Invest Ophthalmol Vis Sci. 1995;36:1361–1370. [PubMed] [Google Scholar]
- 46.Sironi L, Guerrini U, Tremoli E, et al. Analysis of pathological events at the onset of brain damage in stroke-prone rats: a proteomics and magnetic resonance imaging approach. J Neurosci Res. 2004;78:115–122. doi: 10.1002/jnr.20219. [DOI] [PubMed] [Google Scholar]
- 47.Tigani B, Cannet C, Karmouty-Quintana H, et al. Lung inflammation and vascular remodeling after repeated allergen challenge detected noninvasively by MRI. Am J Physiol Lung Cell Mol Physiol. 2007;292:L644–L653. doi: 10.1152/ajplung.00122.2006. [DOI] [PubMed] [Google Scholar]
- 48.Watanabe K, Jinnouchi K, Hess A, et al. Detection of apoptotic change in the lipopolysaccharide (LPS)-treated cochlea of guinea pigs. Hear Res. 2001;158:116–122. doi: 10.1016/s0378-5955(01)00291-x. [DOI] [PubMed] [Google Scholar]
- 49.Levy M, Luciani N, Alloyeau D, et al. Long term in vivo biotransformation of iron oxide nanoparticles. Biomaterials. 2011;32:3988–3999. doi: 10.1016/j.biomaterials.2011.02.031. [DOI] [PubMed] [Google Scholar]
- 50.Dai M, Yang Y, Omelchenko I, et al. Bone marrow cell recruitment mediated by inducible nitric oxide synthase/stromal cell-derived factor-1alpha signaling repairs the acoustically damaged cochlear blood-labyrinth barrier. Am J Pathol. 2010;177:3089–3099. doi: 10.2353/ajpath.2010.100340. [DOI] [PMC free article] [PubMed] [Google Scholar]
- 51.Shi X. Resident macrophages in the cochlear blood-labyrinth barrier and their renewal via migration of bone-marrow-derived cells. Cell Tissue Res. 2010;342:21–30. doi: 10.1007/s00441-010-1040-2. [DOI] [PubMed] [Google Scholar]
- 52.Davoust N, Pialat JB, Moucharaffie S, et al. Proceedings of the 8th International Conference of Neuroimmunology. Nagoya: 2006. MR-tracking of in vivo magnetically labeled macrophages detects remote inflammation in focal ischemia of the mouse brain. (abstract 178:250) [Google Scholar]