Summary
Nicotinamide adenine dinucleotide (NAD+) plays a critical role in regulating numerous biological and physiological pathways including metabolism, inflammation, cancer, and aging in mammals. Here we describe a highly quantitative method with reverse-phase high-performance liquid chromatography (HPLC) for the determination of NAD+ levels in cells and tissues. This methodology provides accurate, reliable, and reproducible results of NAD+ measurement, which enables us to analyze various pathophysiological changes in NAD+ levels in vitro and in vivo.
Keywords: Nicotinamide adenine dinucleotide (NAD+), HPLC, NAMPT
1. Introduction
Nicotinamide adenine dinucleotide (NAD+) is a classic coenzyme known to play an important role in cellular redox reactions in a wide variety of organisms[1]. In mammals, an accumulating body of evidence suggests that NAD+ is involved in numerous biological pathways including metabolism, cancer, stress response, inflammation, and aging[1–4]. In recent years, the emerging importance of NAD+ biology has fueled enthusiasm to investigate both NAD+ biosynthetic pathways and NAD+-dependent mediators in diverse model organisms. These studies have uncovered a new layer of functional roles for NAD+ biosynthetic enzymes and NAD+-consuming regulators.
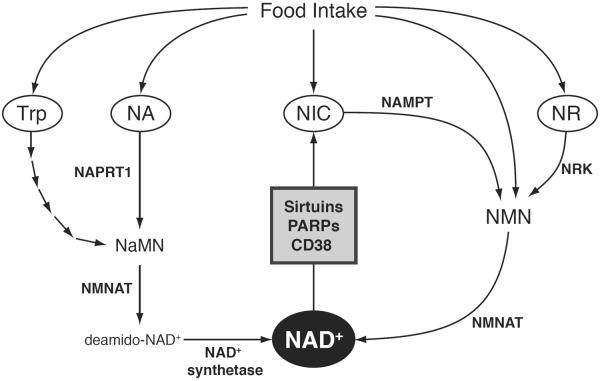
To synthesize NAD+, nicotinamide and nicotinic acid (two different forms of vitamin B3), tryptophan, and nicotinamide riboside (NR) are used as precursors [3,5,6]. NAD+ biosynthetic pathways from these precursors are summarized in Figure 1. In mammals, nicotinamide is a predominant precursor. Nicotinamide is converted into nicotinamide mononucleotide (NMN) by the rate-limiting enzyme nicotinamide phosphoribosyltransferase (NAMPT)[7], and NMN is then converted into NAD+ by the second enzyme, nicotinamide/nicotinic acid mononucleotide adenylyltransferase (NMNAT) (Figure 1). NAD+ exerts its pleiotropic functions through NAD+-consuming enzymes, such as poly(ADP-ribose) polymerases (PARPs)[8,9], mono-ADP ribosyltransferases[10], cyclic ADP ribose hydroses (e.g. CD38)[11], and sirtuins[12,13]. Recent studies show that alteration in NAD+ levels has a profound impact on various physiological functions, particularly metabolic functions, through these NAD+ consuming enzymes. For example, we and other group have reported that both NAMPT protein and NAD+ levels show circadian oscillatory patterns that are regulated by the core clock machinery in peripheral tissues, such as the liver and white adipose tissue[14,15]. This oscillation of NAD+ modulates the activity of SIRT1, one of the mammalian sirtuin family members, and thereby regulates the circadian transcriptional regulation of clock genes, including the Nampt gene itself, comprising a novel feedback loop of circadian rhythm[16]. Recently, we have also found that NAMPT-mediated NAD+ biosynthesis is compromised by high-fat diet feeding and aging, contributing to the pathogenesis of diet-and age-induced type 2 diabetes[17]. Haplodeficiency of Nampt also causes defects in glucose-stimulated insulin secretion in pancreatic islets[18]. Furthermore, genetically engineered mouse models show that inhibition of PARP-1 or CD38 significantly increases NAD+ content, SIRT1 activity, and mitochondrial functions in skeletal muscle and prevents diet-induced obesity by enhancing energy expenditure[19,20,9].
Figure 1. Mammalian NAD+ biosynthetic pathways.
In mammals, NAD+ can be generated from four precursors including tryptophan (Trp), nicotinic acid (NA), nicotinamide (NIC), and nicotinamide riboside (NR). The de novo pathway starts from Trp and is converged into the Preiss-Handler pathway through nicotinic acid mononucleotide (NaMN). In the Preiss-Handler pathway, nicotinic acid phosphoribosyltransferase (NAPRT1) produces NaMN from NA, and NAD+ is generated from NaMN via nicotinamide/nicotinic acid mononucleotide adenylyltransferase (NMNAT) and NAD+ synthetase. In the salvage pathway, NIC is converted to nicotinamide mononucleotide (NMN) by the rate-limiting enzyme, nicotinamide phosphoribosyltranferase (NAMPT). Our recent data suggest that NMN is also found in our daily food (Yoshino and Imai, unpublished data). NAD+ is synthesized from NMN by NMNAT. NR is converted to NMN by nioctinamide riboside kinase (NRK) and utilized for NAD+ biosynthesis. NAD+ is consumed by various enzymes such as sirtuins, poly(ADP-ribose) polymerases (PARPs), and cyclic ADP ribose hydrose (CD38).
Given that mammalian sirtuins (SIRT1–7)[12,13] are implicated in many age-associated diseases such as type 2 diabetes[21,17], Alzheimer's disease[22,23], osteoporosis[24,25], and cancer[26,27], it is conceivable that the regulation of NAD+ biosynthesis plays a crucial role in the pathophysiology of those diseases. NAD+ biosynthesis can also be an important therapeutic target. Indeed, enhancing NAD+ biosynthesis by key NAD+ intermediates, namely NMN[17] and NR[28], or by pharmacological inhibition of CD38[29], improves glucose tolerance, insulin secretion and action, plasma lipid panel, and energy expenditure through activating SIRT1 and SIRT3 in high-fat diet fed mice. These findings provide novel insight into the development of nutriceutical intervention against age-associated metabolic complications, such as obesity and type 2 diabetes[30]. Therefore, accurate and reliable methodology of NAD+ measurement is now getting higher demands in various scientific fields. Here we describe a method with high-performance liquid chromatography (HPLC) to accurately measure the levels of NAD+ in cells and tissues. We will also show a detailed validation of this HPLC-driven methodology with tandem mass spectrometry.
2. Materials
Prepare all solutions and buffers using HPLC-grade water.
2.1. NAD+ extraction components
Perchloric acid (HClO4): Dilute 70% HClO4 (Sigma, St. Louis, MO, USA) in HPLC-grade water and prepare 10% solution (see Note 1). Store at 4°C.
Potassium Carbonate (K2CO3): Weight and transfer 20.7 g of K2CO3 (Fisher Scientific, Pittsburg, PA) into a 50 mL conical tube. Make to 50 mL water and prepare 3 M solution (see Note 2).
2.2. HPLC components
0.5 M Potassium Phosphate Monobasic (KH2PO4): Transfer 34.0 g KH2PO4 (Sigma) into a glass beaker. Add about 400 mL of HPLC-grade water and stir until dissolved. Make up to 500 mL with water in a graduated cylinder. Filtrate solution with 0.22 μm filter.
0.5 M Potassium Phosphate Dibasic (K2HPO4): Weight 43.5 g K2HPO4 (Sigma) and prepare a 500 mL solution, as described in the previous step.
0.05 M Phosphate Buffer (pH 7.0): Add 38.5 mL of 0.5 M KH2PO4 and 61.5 mL of 0.5 M K2HPO4 to a 1 L graduated cylinder and make to 1 L with water. Filtrate with 0.22 μm filter and de-gas the buffer (see Note 3).
Methanol: HPLC-grade 100% Methanol (Sigma)
NAD+ standard solution: Prepare 50 mM stock solution in water from the pure NAD+ compound (Sigma) (see Note 4). Dilute the stock solution in water and make 100 μM working stock solution (see Note 5).
Columns: SUPELCOSIL™ LC-18-T HPLC column, 3 μm particle size, (15cm × 4.6cm; Sigma) (see Note 6). SUPELCOSIL™ LC-18-T Supelguard™ Cartridge (Sigma) (see Note 7).
HPLC instrument (Shimadzu Scientific Instruments, Columbia, MD): LC-20AT Quaternary Solvent Delivery Unit, SPD-20A Ultraviolet (UV) Detector, SIL-20A Autosampler, DGU-20A5 Degasser (see Note 8).
3. Methods
3.1. Acid extraction
Tissue sample
Collect tissue samples and rinse in cold PBS (Phosphate Buffered Saline) (see Note 9).
Remove excess PBS with Kim wipe or diaper and snap-freeze the tissue samples in liquid nitrogen (see Note 10). Store at −80°C. If a tissue sample is very small (e.g. hippocampus and hypothalamus), measure tissue weight before freezing and skip step 3 (see Note 11).
Weight frozen tissue samples when ready to measure NAD+ by HPLC (see Note 12).
Calculate the necessary amount of HClO4 for each sample (see Note 13).
Add a necessary volume of pre-chilled HClO4 to a 10 mL tube on ice. Transfer a frozen tissue sample into the tube and keep on ice.
Homogenize a frozen tissue sample in cold HClO4 using a Polytron Homogenizer or Tissue Lyser II (Qiagen, Valencia, CA)(see Note 14).
Keep the tissue HClO4 homogenate on ice for 15 minutes (see Note 15).
Centrifuge the homogenate at maximal speed (~15000 rpm) at 4°C for 5 min.
Carefully take the supernatant and transfer it to a new sample tube (see Note 16).
Add a one-third volume of 3 M K2CO3 and vortex rigorously (see Note 17).
Keep the sample on ice for 10 minutes (see Note 18).
Centrifuge the sample at maximal speed (~15000 rpm) at 4°C for 5 min.
Carefully take the supernatant and transfer it to a new sample tube.
Cultured cells
Grow cells and give necessary treatments (see Note 19).
Aspirate culture media and wash cultured cells in cold-PBS.
Aspirate PBS and add pre-chilled HClO4 (see Note 20).
Harvest the cells using a cell scraper and transfer the cell lysate into a 1.7 mL tube on ice.
Cells are thoroughly homogenized using a syringe with a 23–26 gauge needle or extensive pipetting.
Vortex the sample rigorously and keep on ice.
Prepare the sample, as described in the previous procedure (Steps 7–13).
3.2. Reverse phase HPLC
Sample set-up: Dilute the tissue/cell extract in 0.05 M Phosphate Buffer as needed, and transfer it to in a HPLC glass vial. Place the vials in the auto-sampler of the HPLC instrument. Inject 50–100 μL of samples into the HPLC. NAD+ standards should also be measured with biological samples (see Note 21).
Mobile Phase: The HPLC is run at a flow rate of 1 mL/min with 100% buffer A (0.05 M Phosphate Buffer) from 0–5 min, a linear gradient to 95% buffer A/5% buffer B (100% methanol) from 5–6 min, 95% buffer A/5% buffer B from 6–11 min, a linear gradient to 85% buffer A/15% buffer B from 11–13 min, 85% buffer A/15% buffer B from 13–23 min, a linear gradient to 100% buffer A from 23–24 min, and 100% buffer A from 24–30 min. The pressure through the HPLC system is also carefully monitored during the measurement (see Note 22).
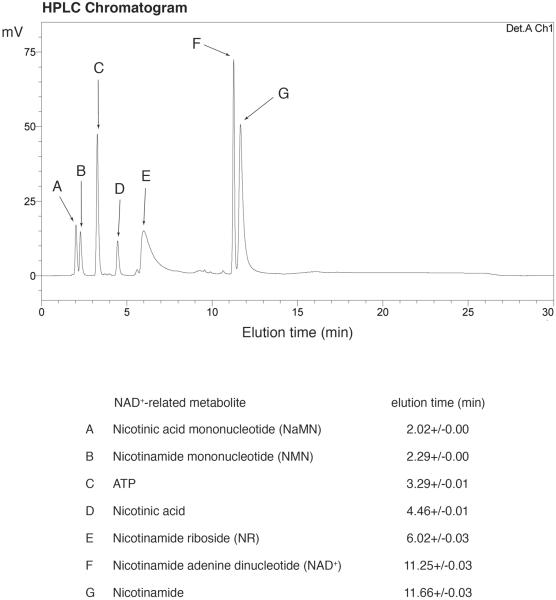
Detection of the peak for NAD+: NAD+ is monitored by absorbance at 261 nm. The peak for NAD+ is usually eluted as a sharp peak at 11 min and completely separable from peaks for other NAD+-related metabolites (Figure 2) (see Note 23). We confirmed that the NAD+ peak detected in mammalian extract, such as NIH3T3 fibroblasts, contained NAD+ >99% by using the NAMPT-specific chemical inhibitor FK866[31] (Figure 3).
Quantification of NAD+: NAD+ levels are quantitated based on the peak area compared to a standard curve and normalized to weights of tissues or protein content of cultured cells (see Note 24).
Figure 2. Separation of NAD+-related metabolites with a LC-18-T column.
Separation of NAD+-related metabolites using high-end HPLC with a LC-18-T column. A representative chromatogram and elution times of each compound are shown.
Figure 3. NAD+ detection in mammalian extract using HPLC system.
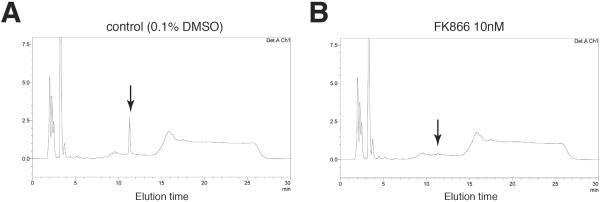
Representative chromatograms of control (A) and FK866 (a potent specific NAMPT inhibitor)-treated (B) NIH3T3 cells from our HPLC system. Cells were incubated with 0.1% DMSO (control) or 10 nM FK866 for 24 hrs. The peak for NAD+ is indicated in each chromatogram (arrow).
3.3. Validation by a tandem mass-spectrometry
To further validate our HPLC-driven NAD+ measurement (see Note 25), the NAD+ peak from the liver extract of a regular chow-fed, NMN-injected C57BL/6 mouse was fractionated and analyzed by liquid-chromatography tandem mass spectrometry (LC/MS/MS) [a Shimadzu 10A HPLC system (Shimadzu) coupled to a TSQ Quantum Ultra triple quadrupole mass spectrometer (Thermo Finnigan, San Jose, USA)] in the positive mode.
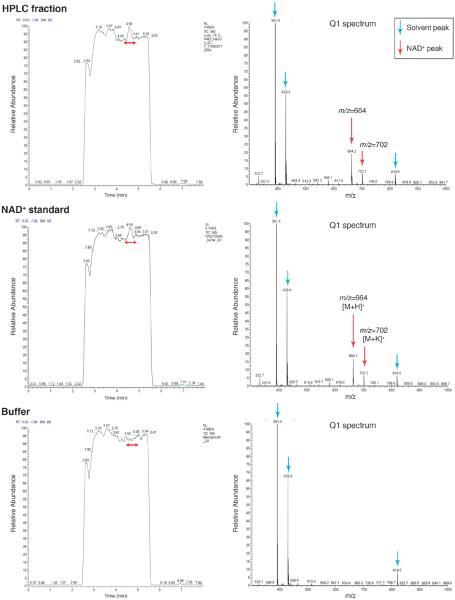
Q1 ion scanning: The NAD+-containing HPLC fraction was first examined by Q1 ion scanning in LC/MS/MS with a C18 column. The results from Q1 ion scanning clearly show that the ion species with 664 and 702 of m/z form only specific peaks, except for solvent peaks generated from the buffer (m/z=391.4, 429.3, and 819.5), in this HPLC fraction (Figure 4). Comparing to the Q1 spectra of standard NAD+ and the buffer only, these two ion species were identified as [M+H]+ (m/z=664) and [M+K]+ (m/z=702) of NAD+.
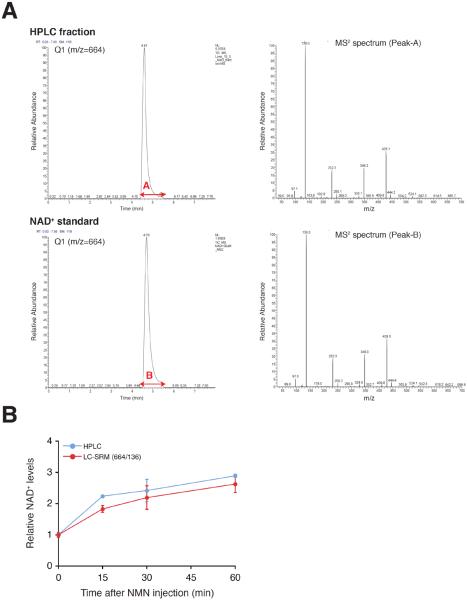
MS2 analyses: To further confirm the identity of NAD+ peak, we compared the MS2 scan for the Q1 spectrum (m/z=664) and found that MS2 product ions completely matched between the HPLC fraction and standard NAD+ (Sigma) (Figure 5A).
Quantification with the selected reaction monitoring (SRM) mode: Using the SRM mode in this LC/MS/MS method, we also measured relative changes in NAD+ levels in liver extracts from C57BL/6 mice injected with NMN at the dose of 500 mg/kg body weight. We successfully confirmed that the time course of relative NAD+ changes measured by LC/MS/MS were highly consistent with those measured by our HPLC-driven methodology[17] (Figure 5B). These results provide a convincing validation for the accuracy of the HPLC-driven NAD+ measurement method described in this chapter.
Figure 4. Q1 ion scanning of the NAD+ fraction isolated by HPLC.
Liquid chromatography-tandem mass spectrometry (LC/MS/MS) was performed with a Shimadzu 10A HPLC system coupled to a TSQ Quantum Ultra triple quadrupole mass spectrometer in the positive mode. The NAD+ peak was fractionated from a regular chow-fed liver extract by HPLC with a C18 column and analyzed by LC/MS/MS. NAD+ standard (Molecular weight=663.4) and blank (buffer) samples were also analyzed. Total ion chromatograms and Q1 scan spectra of indicated peaks are shown.
Figure 5. MS2 analysis and quantitation of NAD+ by LC/MS/MS.
(A) Extracted ion chromatograms of the NAD+ fraction and standard using LC/MS/MS. The ion [M+H]+ (m/z=664) was selected in Q1. MS2 spectra of the indicated peaks are shown.
(B) Relative changes in NAD+ levels in liver extracts prepared from NMN-injected B6 female mice. Relative changes in NAD+ levels were assessed by HPLC and LC/MS/MS and normalized to those at 0 min time point. NAD+ quantitation was conducted using the selected reaction monitoring (SRM) mode (m/z 664 → 136).
4. Notes
HClO4 is a very strong acid and corrosive solution and needs to be very carefully handled. Therefore, it is recommended that 10% solution is prepared in a fume hood.
K2CO3 solution is a strong base and should be carefully prepared and stored in a plastic conical tube (NOT in glass products).
We usually check the pH of prepared 0.05 M Phosphate Buffer using Litmus paper. The proper control of mobile phase pH is not only important for the reproducibility in the elution time but also critical for the shape and the separation of the peak.
We typically use “β-Nicotinamide adenine dinucleotide hydrate” (Sigma, N1511) to make NAD+ standard solution. NAD+ powder may be difficult to dissolve in water and need to be vortex rigorously until dissolved. Aliquots of 50 mM NAD+ stock solution should be stored at the deep freezer (−80°C). Avoid multiple freeze/thaw cycles with stock solution. Frozen NAD+ stock solution is stable at −80°C at least for one year.
100 μM NAD+ working stock solution should be stored in the sample box at the refrigerator (4°C). Working stock solution needs to be kept on ice when preparing standard solutions for the HPLC measurement. Working stock solution is stable at 4°C at least for a couple of weeks.
Column selection is the most important part for the HPLC methodology. We find that the LC-18-T HPLC column is the best for NAD+ measurement in terms of sensitivity, reproducibility, and convenience.
A HPLC guard column can extend the lifetime of the main column by preventing the accumulation of impurities on the column. A guard column should be connected with the HPLC instrument when biological samples are measured.
Sensitivity of UV detector is particularly important when examining the tissue sample that contains low amounts of NAD+, such as adipose tissue.
Tissue collection should be done as quickly and smoothly as possible to avoid the degradation of NAD+.
Liquid nitrogen, but not dry ice, needs to be used to snap-freeze the tissue samples. Frozen samples should be stored at the deep freezer (−80°C) without being thawed until NAD+ measurement.
Small frozen tissue samples tend to be thawed very easily and quickly so that NAD+ is degraded when measuring frozen tissue weight. To avoid this issue, we usually measure tissue weight quickly before freezing it and calculate the volume of HClO4 (see also Note 13).
Frozen tissue samples have to be kept in the dry ice box and immediately be weighted without being thawed. In most cases, no more than 100 mg of tissue is required for the determination of NAD+ levels. Frozen tissue samples can be cut into small pieces on dry ice, as needed.
Typically, a tissue sample is extracted in 10% HClO4 at a 1:10–50 ratio (tissue weight : HClO4 volume).
Extra cautions should be taken when dealing with HClO4 (see also Note 1). Use a Polytron Homogenizer in a fume hood and wear a safety goggle as needed. The Tissue Lyser II is operated for 5 min with the frequency of 30 shakes/s using the pre-chilled adaptor plates.
We usually transfer the HClO4 homogenate into a 1.7 mL tube during incubation on ice. For NAD+ quantitation, no more than 1 mL of tissue lysate is required. Excess amount of the homogenate can be discarded.
If the volume of the supernatant is more than 0.5 mL, it is recommended to transfer it into a 5–10 mL tube in order not to spill the solution due to the CO2 production in the next step (see also Note 18).
The precipitation of white crystals (KClO4) is observed after adding K2CO3 solution.
CO2 gas is produced in this neutralization and desalting step. Therefore, a cap of the tube should be opened at least once during incubation on ice to remove the gas.
We usually grow cells in a 6-well plate for NAD+ measurement. We use 3 wells for NAD+ and 3 wells for protein concentration measurement in each experimental condition. The average of protein concentrations through 3 wells is used for the normalization of NAD+ levels.
Typically 0.3–0.5 mL of HClO4 is added to each well on 6-well plate. Extra caution should be taken when dealing with HClO4 (see also Note 1).
We prepare NAD+ standard solution in 0.05 M Phosphate Buffer at four different concentrations (e.g. 0.2, 0.5, 1.0, and 2.0 μM). The linearity and reproducibility for NAD+ standard solutions should be evaluated at each measurement.
Make sure there is no leak in the instrument. Salt precipitation can result in the high pressure. Pump failure can cause a fluctuation in pressure.
Elution time must be always consistent in the same experimental condition. Wrong buffer preparation or HPLC pump problems can cause significant changes in the elution time.
By using this HPLC-driven methodology, we successfully detected the pathophysiological changes in NAD+ levels in multiple tissues induced by circadian oscillation[14], high-fat diet feeding[17], and aging[17].
Although the NAD+ peak is completely separable from other NAD+-related metabolites in this method (Figure 2), there is still a possibility that NAD+ fraction extracted from biological samples could contain compounds other than NAD+. Therefore, we addressed this issue by using LC/MS/MS as described in this chapter.
Acknowledgement
We thank Drs. Xuntian Jiang and Daniel Ory for mass spec analysis in the Metabolomics Facility at Washington University School of Medicine. We also thank members of the Imai lab for their critical discussions. This work was supported in part by the National Institute on Aging (AG02150), the Ellison Medical Foundation, and the Longer Life Foundation to S.I. and by institutional support from the Washington University Nutrition Obesity Research Center (P30DK056341) and the Washington University Diabetes Research and Training Center (P60DK020579). S.I. serves as a scientific advisory board member for Sirtris, a GSK company.
References
- 1.Belenky P, Bogan KL, Brenner C. NAD+ metabolism in health and disease. Trends Biochem Sci. 2007;32(1):12–19. doi: 10.1016/j.tibs.2006.11.006. doi:10.1016/j.tibs.2006.11.006. [DOI] [PubMed] [Google Scholar]
- 2.Stein LR, Imai S. The dynamic regulation of NAD metabolism in mitochondria. Trends Endocrinol Metab. 2012;23(9):420–428. doi: 10.1016/j.tem.2012.06.005. doi:10.1016/j.tem.2012.06.005. [DOI] [PMC free article] [PubMed] [Google Scholar]
- 3.Revollo JR, Grimm AA, Imai S. The regulation of nicotinamide adenine dinucleotide biosynthesis by Nampt/PBEF/visfatin in mammals. Curr Opin Gastroenterol. 2007;23(2):164–170. doi: 10.1097/MOG.0b013e32801b3c8f. doi:10.1097/MOG.0b013e32801b3c8f. [DOI] [PubMed] [Google Scholar]
- 4.Imai S. The NAD World: a new systemic regulatory network for metabolism and aging--Sirt1, systemic NAD biosynthesis, and their importance. Cell Biochem Biophys. 2009;53(2):65–74. doi: 10.1007/s12013-008-9041-4. doi:10.1007/s12013-008-9041-4. [DOI] [PMC free article] [PubMed] [Google Scholar]
- 5.Magni G, Amici A, Emanuelli M, Raffaelli N, Ruggieri S. Enzymology of NAD+ synthesis. Adv Enzymol Relat Areas Mol Biol. 1999;73:135–182. xi. doi: 10.1002/9780470123195.ch5. [DOI] [PubMed] [Google Scholar]
- 6.Bogan KL, Brenner C. Nicotinic acid, nicotinamide, and nicotinamide riboside: a molecular evaluation of NAD+ precursor vitamins in human nutrition. Annu Rev Nutr. 2008;28:115–130. doi: 10.1146/annurev.nutr.28.061807.155443. doi:10.1146/annurev.nutr.28.061807.155443. [DOI] [PubMed] [Google Scholar]
- 7.Revollo JR, Grimm AA, Imai S. The NAD biosynthesis pathway mediated by nicotinamide phosphoribosyltransferase regulates Sir2 activity in mammalian cells. The Journal of biological chemistry. 2004;279(49):50754–50763. doi: 10.1074/jbc.M408388200. doi:10.1074/jbc.M408388200. [DOI] [PubMed] [Google Scholar]
- 8.Krishnakumar R, Kraus WL. The PARP side of the nucleus: molecular actions, physiological outcomes, and clinical targets. Molecular cell. 2010;39(1):8–24. doi: 10.1016/j.molcel.2010.06.017. doi:10.1016/j.molcel.2010.06.017. [DOI] [PMC free article] [PubMed] [Google Scholar]
- 9.Bai P, Canto C. The Role of PARP-1 and PARP-2 Enzymes in Metabolic Regulation and Disease. Cell metabolism. 2012;16(3):290–295. doi: 10.1016/j.cmet.2012.06.016. doi:10.1016/j.cmet.2012.06.016. [DOI] [PubMed] [Google Scholar]
- 10.Corda D, Di Girolamo M. Functional aspects of protein mono-ADP-ribosylation. The EMBO journal. 2003;22(9):1953–1958. doi: 10.1093/emboj/cdg209. doi:10.1093/emboj/cdg209. [DOI] [PMC free article] [PubMed] [Google Scholar]
- 11.Lee HC. Physiological functions of cyclic ADP-ribose and NAADP as calcium messengers. Annu Rev Pharmacol Toxicol. 2001;41:317–345. doi: 10.1146/annurev.pharmtox.41.1.317. doi:10.1146/annurev.pharmtox.41.1.317. [DOI] [PubMed] [Google Scholar]
- 12.Imai S, Guarente L. Ten years of NAD-dependent SIR2 family deacetylases: implications for metabolic diseases. Trends Pharmacol Sci. 2010;31(5):212–220. doi: 10.1016/j.tips.2010.02.003. doi:10.1016/j.tips.2010.02.003. [DOI] [PMC free article] [PubMed] [Google Scholar]
- 13.Guarente L. Franklin H. Epstein Lecture: Sirtuins, aging, and medicine. The New England journal of medicine. 2011;364(23):2235–2244. doi: 10.1056/NEJMra1100831. doi:10.1056/NEJMra1100831. [DOI] [PubMed] [Google Scholar]
- 14.Ramsey KM, Yoshino J, Brace CS, Abrassart D, Kobayashi Y, Marcheva B, Hong HK, Chong JL, Buhr ED, Lee C, Takahashi JS, Imai S, Bass J. Circadian clock feedback cycle through NAMPT-mediated NAD+ biosynthesis. Science. 2009;324(5927):651–654. doi: 10.1126/science.1171641. doi:10.1126/science.1171641. [DOI] [PMC free article] [PubMed] [Google Scholar]
- 15.Nakahata Y, Sahar S, Astarita G, Kaluzova M, Sassone-Corsi P. Circadian control of the NAD+ salvage pathway by CLOCK-SIRT1. Science. 2009;324(5927):654–657. doi: 10.1126/science.1170803. doi:10.1126/science.1170803. [DOI] [PMC free article] [PubMed] [Google Scholar]
- 16.Imai S. “Clocks” in the NAD World: NAD as a metabolic oscillator for the regulation of metabolism and aging. Biochimica et biophysica acta. 2010;1804(8):1584–1590. doi: 10.1016/j.bbapap.2009.10.024. doi:10.1016/j.bbapap.2009.10.024. [DOI] [PMC free article] [PubMed] [Google Scholar]
- 17.Yoshino J, Mills KF, Yoon MJ, Imai S. Nicotinamide mononucleotide, a key NAD(+) intermediate, treats the pathophysiology of diet- and age-induced diabetes in mice. Cell metabolism. 2011;14(4):528–536. doi: 10.1016/j.cmet.2011.08.014. doi:10.1016/j.cmet.2011.08.014. [DOI] [PMC free article] [PubMed] [Google Scholar]
- 18.Revollo JR, Korner A, Mills KF, Satoh A, Wang T, Garten A, Dasgupta B, Sasaki Y, Wolberger C, Townsend RR, Milbrandt J, Kiess W, Imai S. Nampt/PBEF/Visfatin regulates insulin secretion in beta cells as a systemic NAD biosynthetic enzyme. Cell metabolism. 2007;6(5):363–375. doi: 10.1016/j.cmet.2007.09.003. doi:10.1016/j.cmet.2007.09.003. [DOI] [PMC free article] [PubMed] [Google Scholar]
- 19.Bai P, Canto C, Oudart H, Brunyanszki A, Cen Y, Thomas C, Yamamoto H, Huber A, Kiss B, Houtkooper RH, Schoonjans K, Schreiber V, Sauve AA, Menissier-de Murcia J, Auwerx J. PARP-1 inhibition increases mitochondrial metabolism through SIRT1 activation. Cell metabolism. 2011;13(4):461–468. doi: 10.1016/j.cmet.2011.03.004. doi:10.1016/j.cmet.2011.03.004. [DOI] [PMC free article] [PubMed] [Google Scholar]
- 20.Barbosa MT, Soares SM, Novak CM, Sinclair D, Levine JA, Aksoy P, Chini EN. The enzyme CD38 (a NAD glycohydrolase, EC 3.2.2.5) is necessary for the development of diet-induced obesity. FASEB journal : official publication of the Federation of American Societies for Experimental Biology. 2007;21(13):3629–3639. doi: 10.1096/fj.07-8290com. doi:10.1096/fj.07-8290com. [DOI] [PubMed] [Google Scholar]
- 21.Gillum MP, Erion DM, Shulman GI. Sirtuin-1 regulation of mammalian metabolism. Trends in molecular medicine. 2010 doi: 10.1016/j.molmed.2010.09.005. doi:10.1016/j.molmed.2010.09.005. [DOI] [PMC free article] [PubMed] [Google Scholar]
- 22.Braidy N, Jayasena T, Poljak A, Sachdev PS. Sirtuins in cognitive ageing and Alzheimer's disease. Curr Opin Psychiatry. 2012;25(3):226–230. doi: 10.1097/YCO.0b013e32835112c1. doi:10.1097/YCO.0b013e32835112c1. [DOI] [PubMed] [Google Scholar]
- 23.Donmez G, Wang D, Cohen DE, Guarente L. SIRT1 suppresses beta-amyloid production by activating the alpha-secretase gene ADAM10. Cell. 2010;142(2):320–332. doi: 10.1016/j.cell.2010.06.020. doi:10.1016/j.cell.2010.06.020. [DOI] [PMC free article] [PubMed] [Google Scholar] [Retracted]
- 24.Cohen-Kfir E, Artsi H, Levin A, Abramowitz E, Bajayo A, Gurt I, Zhong L, D'Urso A, Toiber D, Mostoslavsky R, Dresner-Pollak R. Sirt1 is a regulator of bone mass and a repressor of Sost encoding for sclerostin, a bone formation inhibitor. Endocrinology. 2011;152(12):4514–4524. doi: 10.1210/en.2011-1128. doi:10.1210/en.2011-1128. [DOI] [PubMed] [Google Scholar]
- 25.Li Y, He X, Li Y, He J, Anderstam B, Andersson G, Lindgren U. Nicotinamide phosphoribosyltransferase (Nampt) affects the lineage fate determination of mesenchymal stem cells: a possible cause for reduced osteogenesis and increased adipogenesis in older individuals. Journal of bone and mineral research : the official journal of the American Society for Bone and Mineral Research. 2011;26(11):2656–2664. doi: 10.1002/jbmr.480. doi:10.1002/jbmr.480. [DOI] [PubMed] [Google Scholar]
- 26.Finley LW, Carracedo A, Lee J, Souza A, Egia A, Zhang J, Teruya-Feldstein J, Moreira PI, Cardoso SM, Clish CB, Pandolfi PP, Haigis MC. SIRT3 opposes reprogramming of cancer cell metabolism through HIF1alpha destabilization. Cancer cell. 2011;19(3):416–428. doi: 10.1016/j.ccr.2011.02.014. doi:10.1016/j.ccr.2011.02.014. [DOI] [PMC free article] [PubMed] [Google Scholar]
- 27.Sebastian C, Zwaans BM, Silberman DM, Gymrek M, Goren A, Zhong L, Ram O, Truelove J, Guimaraes AR, Toiber D, Cosentino C, Greenson JK, Macdonald AI, McGlynn L, Maxwell F, Edwards J, Giacosa S, Guccione E, Weissleder R, Bernstein BE, Regev A, Shiels PG, Lombard DB, Mostoslavsky R. The Histone Deacetylase SIRT6 Is a Tumor Suppressor that Controls Cancer Metabolism. Cell. 2012;151(6):1185–1199. doi: 10.1016/j.cell.2012.10.047. doi:10.1016/j.cell.2012.10.047. [DOI] [PMC free article] [PubMed] [Google Scholar]
- 28.Canto C, Houtkooper RH, Pirinen E, Youn DY, Oosterveer MH, Cen Y, Fernandez-Marcos PJ, Yamamoto H, Andreux PA, Cettour-Rose P, Gademann K, Rinsch C, Schoonjans K, Sauve AA, Auwerx J. The NAD(+) precursor nicotinamide riboside enhances oxidative metabolism and protects against high-fat diet-induced obesity. Cell metabolism. 2012;15(6):838–847. doi: 10.1016/j.cmet.2012.04.022. doi:10.1016/j.cmet.2012.04.022. [DOI] [PMC free article] [PubMed] [Google Scholar]
- 29.Escande C, Nin V, Price NL, Capellini V, Gomes AP, Barbosa MT, O'Neil L, White TA, Sinclair DA, Chini EN. Diabetes. 2012. Flavonoid Apigenin Is an Inhibitor of the NAD+ase CD38: Implications for Cellular NAD+ Metabolism, Protein Acetylation, and Treatment of Metabolic Syndrome. doi:10.2337/db12-1139. [DOI] [PMC free article] [PubMed] [Google Scholar]
- 30.Imai S. A possibility of nutriceuticals as an anti-aging intervention: activation of sirtuins by promoting mammalian NAD biosynthesis. Pharmacol Res. 2010;62(1):42–47. doi: 10.1016/j.phrs.2010.01.006. doi:10.1016/j.phrs.2010.01.006. [DOI] [PMC free article] [PubMed] [Google Scholar]
- 31.Hasmann M, Schemainda I. FK866, a highly specific noncompetitive inhibitor of nicotinamide phosphoribosyltransferase, represents a novel mechanism for induction of tumor cell apoptosis. Cancer research. 2003;63(21):7436–7442. [PubMed] [Google Scholar]


