

Abstract
Better understanding of uranyl toxicity in bacteria is necessary to optimize strains for bioremediation purposes or for using bacteria as biodetectors for bioavailable uranyl. In this study, after different steps of optimization, Escherichia colicells were exposed to uranyl at low pH to minimize uranyl precipitation and to increase its bioavailability. Bacteria were adapted to mid acidic pH before exposure to 50 or 80 µM uranyl acetate for two hours at pH≈3. To evaluate the impact of uranium, growth in these conditions were compared and the same rates of cells survival were observed in control and uranyl exposed cultures. Additionally, this impact was analyzedby two-dimensional differential gel electrophoresis proteomics to discover protein actors specifically present or accumulated in contact with uranium.Exposure to uranium resulted in differential accumulation of proteins associated with oxidative stress and in the accumulation of the NADH/quinone oxidoreductase WrbA. This FMN dependent protein performs obligate two-electron reduction of quinones, and may be involved in cells response to oxidative stress. Interestingly, this WrbA protein presents similarities with the chromate reductase from E. coli, which was shown to reduce uranyl in vitro.
Introduction
Uranium is a heavy radioactive metal naturally present on earth, which has been widely exploited for industrial and military applications. Mining activities, uranium processing and leaching of wastes are significant anthropogenic sources of uranium dissemination in the environment, in subsurface sediments or ground water. Although metals are often met in biological systems and are essential for living organisms, uranium is universally recognized as a toxin, presenting both chemical and radiological toxicity to living organisms [1], [2].
In the environment, uranium is predominantly observed in two oxidation states, the oxidized U(VI) form, mainly represented as the uranyl UO2 2+ cation in the presence of oxygen, and the reduced form U(IV), mainly occurring as insoluble species, stable in anoxic conditions. In addition, uranyl may be associated to a large range of organic or inorganic ligands as carboxylates, carbonates or phosphates [3], that determine its solubility and hence its bioavailability, i.e. its ability to bind to or traverse the cell surface of an organism. These properties -called uranium speciation- have been demonstrated to be both pH and concentration dependant [3], [4].
Interactions between uranium and bacteria have been extensively studied to identify the potential role of soil bacteria to change the speciation of uranium and its bioavailability. This work also led to evaluate their potential for bioremediation of contaminated areas [5], [6], [7], [8]. Besides uranium reduction in anoxic conditions, the most frequent phenomenon described for uranium-bacteria interaction is uranium biosorption or precipitation at cell surface. Uranium binding to cell envelopes (cell wall/membrane) involvescoordinationby negatively charged groups, such as carboxylates and phosphoryl groups [7], [9]–[13]. Precipitation as uranyl phosphate [11], [14], [15] or calcium-uranium-phosphate were notably documented [15], [16], [17], [18]. These interactions largely depend on the properties of cell wallsand of the external milieu and may be independent of cells viability [7].
There is far less information concerning intracellular uranium accumulation, or consequences of uranium exposure in bacterial cells [7]. Uranyl penetration in cells is thought to be associated with increased membrane permeability, and intracellular uranium sequestration considered as a passive process involving formation of inorganic compounds as polyphosphate granules [19], [20]. It is of major interest to enlarge our knowledge on the cellular response of cells to uranium exposure to better understand toxicity mechanisms of uranyl in bacteria and, as a consequence, to identify potential interesting mechanisms in terms of bioremediation.
The response to uranium exposure of environmental bacteria such as Caulobacter crescentus [16], Geobacter uraniireducens [21], and Shewanella oneidensis [22] was previously analysed at the transcription level. In the uranium tolerant species C. crescentus, response to uranium did not overlap substantially with other heavy metal stresses [16] and this specific response was used subsequently to develop a whole cell uranyl biosensor [23]. A proteogenomic approach was also conducted to analyse the evolution of Geobacter community structure and physiology under stimulated uranium reduction [24].
While several studies have used two-dimensional gel electrophoresis (2D–E) to investigate changes in protein expression of many bacteria after exposure to a wide range of toxic or biological metals, e.g., silver [25], copper, lead, cobalt [26], [27], [28], or chromium [27], [29], [30], none focused on the effect of uranium. This may be due to difficulties associated with the control of uranyl speciation in bacteria culture media. Only two papers described the impact of uranium stress on lung and kidney cells proteomes [31], [32], [33].
To help uncover the mechanisms of toxicity associated with exposure to uranyl, we developed an experimental model to expose the bacterial model Escherichia coli to uranium in conditions allowing uranium bioavailability and cells survival. To reach this objective, we challenged bacterial cells with uranium at low pH in a diluted LB medium supplemented with glucose.For these experiments, we took advantage of the acid resistance of E. coli, one of the best scientifically analyzed organisms that represents an invaluable tool in molecular microbiology and biotechnology.The uranium speciation in the exposure medium was analyzed by means of X-ray absorption spectroscopy (XAS), and we analyzed the proteomic response of the bacteria in light of its genome annotation.The regulated proteins were identified by mass spectrometry after two-dimensional gel electrophoresis (2D–E). The data that we report here may be of interest to optimise strains for biodetection or bioremediation purposes, notably in frame of optimizing in-cell sequestration of uranium.
Results and Discussion
1. Uranium challenge conditions
Uranium precipitates as uranium phosphate in culture media at pH above 3.5–4.5 [34], limiting its bioavailability. Exposure of bacterial cells to uranyl has often been performed in water or water supplemented with 0.1 M NaCl or 0.1 M NaClO4 at various pH, including pH as low as 2 or 3, [7], [35] or in the presence of strong uranyl complexing agents as citrate [17].These exposure conditions were used to avoid uranyl precipitation with phosphate that could occur in rich growth medium, or in minimal mineral medium containing phosphates.In addition, a large number of bacteria precipitate uranium in the form of inorganic uranyl-phosphate complexes at the cell surface or in the medium at neutral to mid acidic pH [7]. In these conditions, low uranyl bioavailability impairs the analysis of the impact of moderate concentrations of uranyl on bacterial cells physiology.
With Microbacterium isolates, uranyl precipitates in the form of inorganic phosphate complexes (meta-autunite) at pH 4.5, while it interacts with organic phosphate groups at more acidic pH [35]. Interaction of uranyl with organic phosphate was also described at low pH for Bacillus subtilis [12], and with protonated phosphoryl groups and carboxylic sites for Pseudomonas fluorescens [36]. These data are in line with a higher bioavailability of uranyl at low pH.
In this study, we took advantage of the acid resistance property of E. coli to characterize the E. coli K-12 strain MG1655after uranium 238 (238U) exposure in LB (1/10)-glucose medium at pH 2.7 (Figure 1). These experimental conditions of exposure were chosen mainly for two reasons. First, the pH was fixed below pH 4 and the LB medium diluted tenfold to minimize the level of complexation between uranyl and phosphate orcarbonate groups. In addition, diluted LB supplemented with glucose was chosen for the presence of various amino acids and organic molecules since this may reduce the level of stress engendered by the hostile growth conditions (i.e. low pH anduranyl exposure). Second, E. coli has been used in basic research as a model organism for a long time. Physiology and genetics of this bacterium are among the best characterized of all species. Accordingly, the activity of its encoded proteins is probably at the best level of understanding in bacteria.
Figure 1. Schematic view of E. coli cells exposure to uranium and details of the optimized analysis protocol.

2. Uranyl speciation in the exposure medium
The speciation of uranyl in the exposure medium was analyzed using X-ray absorption spectroscopy (XAS) (Figure 2). This medium, dedicated to bacterial growth is mainly composed of proteins or amino acids, sugar moieties and salts. It contains phosphate residues, but the presence of strong uranyl ligands such as carbonate or citrate is unexpected. Consequently, uranyl may be found as complexes with phosphate, glucose, or carboxylate moieties of proteins and amino acids residues [37], [38]. Given the complexity of this medium, uranium speciation is suspected to be rather complex.
Figure 2. Uranium speciation in the exposure medium.
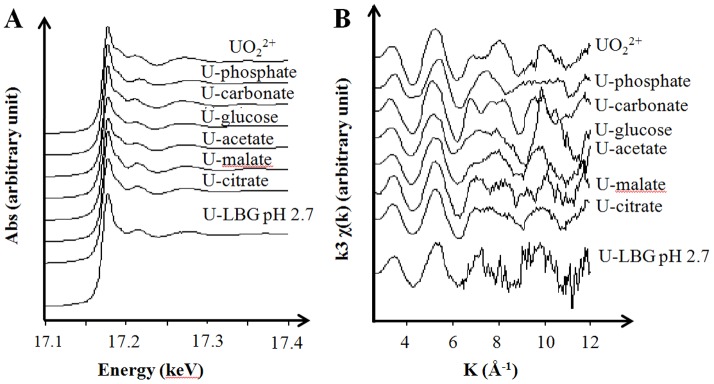
Uranium LIII-edge XAS spectra (A), normalized to equal intensity at 17.176 keV; and k3-weighted EXAFS curves (B) of uranyl acetate 50 µM prepared in LB-glucose medium at pH 2.7 (U-LBG pH 2,7) compared to reference spectra.
To get a more precise picture of uranium complexation, a XAS spectrum of the exposure medium (diluted LB medium with glucose at pH 2.7, see below) supplemented with 50 µM uranyl acetate was recorded at the uranium LIII-edge, and compared to spectra of reference uranyl complexes (Figure 2). The exposure medium was analyzed in the same conditions as during bacterial exposure even if the uranyl concentration is close to the limit of detection of the majority of synchrotron beamlines (including those dedicated to the analysis of diluted samples such as FAME: BM30B, ESRF, France). However, changing the uranyl concentration in the medium would have modified its speciation.
In these conditions, the acquired spectra are noisy and their analysis can only be partial. The XANES (X-ray Absorption Near Edge Structure) region and the position of the absorption edge (∼17.177 keV, Figure 2-A) is however characteristic of the U(VI) oxidation state [39]. The shoulder at 17.190 keV after the absorption edge, typical from the linear uranyl dioxocation UO2 2+, is absent. This suggests that this linear structure may be distorted in the uranyl complexes formed in the medium. In addition, EXAFS spectra (Extended X-ray absorption fine structure Figure 2-B) show a first peak massif (4.5–6 Å−1) with its maximum aligned with that of spectra recorded with UO2 2+ or U-malate, U-acetate, or U-glucose complexes, but not with U-phosphate or U-carbonate complexes. The remaining of the EXAFS spectrum, although very noisy, also differs from spectra recorded with U-phosphate and U-carbonate complexes. The second peak massif (6.5–8.8 Å−1), aligns with contributions present in the U-malate spectrum, while the peak massif at 9–11 Å−1 has a strong contribution in the U-glucose spectrum. Even if this interpretation is strictly qualitative, uranium speciation in the LB-glucose medium may be a mixture of glucose and carboxylate complexes of uranyl. Therefore uranyl is expected to be bioavailable for E. coli cells in these experimental conditions.
3. Exposure assay of E. coli cells
Acid resistance is an inherent property of the enteric bacterium E. coli, associated to its necessity to develop strategies to overcome acidic gastric conditions [40]. In addition to acid resistance associated with the stationary phase, situations of tolerance have also been described in the exponential growth phase [41], [42]. Moreover, the survivability of E. coli cells has been reported at a pH as low as pH 2.5 after preculture in a moderate acidic medium overnight.
In this study, E. coli cells were grown in LB-Mes medium at pH 5.5 to promote resistance to mild acid conditions and then exposed to uranyl at pH 2.7 for two hours. As summarized in Figure 1, a LB-Mes pH 5.5 medium was inoculated at 1/100 (v/v) with an overnight culture grown in LB-Mes pH 5.5, and the cells grown to mid exponential phase. Cells were then collected by centrifugation and exposed at pH 2.7 in a tenfold diluted LB medium supplemented with glucose (4 g/L) and 50 µM sodium acetate (control samples) or uranyl acetate (exposed samples) at 50 µM or 80 µM concentrations. The rate of cells survival after the uranium challenge was evaluated by numeration of colony forming units (CFU). These data showed that exposure of E. coli cells for two hours at pH 2.7 (medium: LB 1/10 + glucose) resulted in around 15% cell viability (Figure 3). More interestingly, similar percentages of cell survival were obtained for control samples and samples exposed to 50 µM or 80 µM of uranyl acetate.
Figure 3. Cell survival after exposure to uranyl at acidic pH.
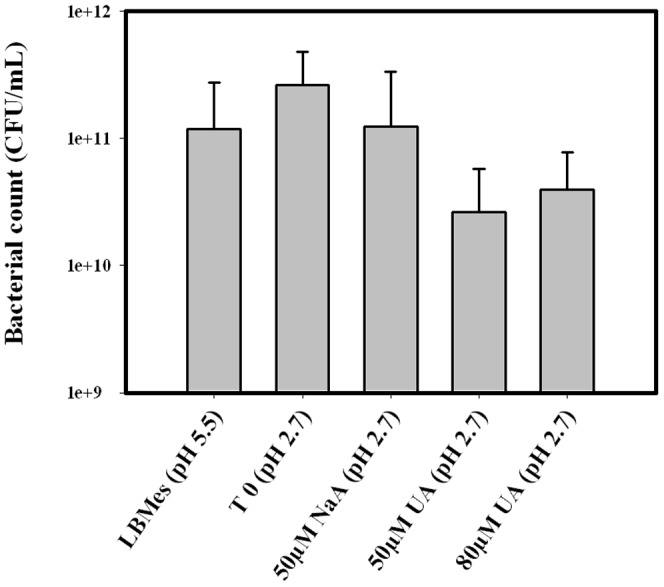
Numbering of Colony Forming Units from the E. coli culture in LB-Mes pH 5.5, and in the exposure LB 1/10 Glucose medium at pH 2.7 before (T0) and after exposure for 2 hours to 50 µM sodium acetate, 50 µM of uranyl acetate, and 80 µM of uranyl acetate.
The cells were then harvested by centrifugation, washed twice in Tris buffer (pH 7), and the uranyl concentration in the exposure media and post-exposure supernatants was measured using UV-visible spectrophotometry [43]. Less than 5% of the total uranium was still soluble in the exposure medium after the 2 hours exposure of E. coli cells. About 25% to 30% of the uranium was further released by the washing steps in Tris buffer (pH 7), reflecting uranium weakly associated to the bacterial cells. Consequently, we deduced percentages of 73 and 65% of the uranium were retained in the cell pellets after 2 h of cells exposure to 50 µM or 80 µM of uranyl acetate, respectively (Table 1). These measurements demonstrated that a main fraction of the uranium was retained by bacteria.
Table 1. Uranyl concentrations in the supernatants and in the cell pellets.
| Control | 50 µM | 80 µM | |
| Uranyl in supernatant after 2 hours exposure at pH 2.7 (%) | 0 | 2.4±1.8 | 4.1±2.2 |
| Uranyl fraction released upon Tris washing (%) | 0 | 24±8 | 31±2 |
| Uranyl present in the cell pellets (deduced) (%) | 0 | ≈ 73% | ≈ 65% |
4. Proteomic response to uranyl exposure
The proteomic response to uranyl exposure was investigated on three independent experiments, where samples exposed to 50 or 80 µM of uranyl acetate were compared to control samples exposed to 50 µM sodium acetate. After protein spots abundances measurements, PCA analysis was performed on normalized data (vertically and horizontally, Figure 4A). It revealed that the proteome of control samples is significantly different from that of E. coli cells exposed to 50 or 80 µM of uranyl acetate. The first component, which explains more than 33% of the total variability, strongly discriminates the uranyl exposed samples with respect to the control ones, arguing for the physiological impact of the uranium treatment. The second component, accounting for 21% of the total variability, separates the samples exposed to 50 µM and 80 µM uranyl acetate, indicating here the concentration-dependence of the bacterial response. Those results show clearly an effect of uranium on the bacterial proteome and also further evidence its bioavailability for cells in the optimized experimental culture conditions.
Figure 4. Protein regulations from 2D-gel analysis.

A: Principal component analysis performed on the proteomes of control cells and cells exposed to 50 and 80 µM of uranyl acetate. Each colored cross represents one independent replicate. The numbers in grey represent the protein spots which are impacted by the uranium stress in a statistically pertinent manner. B: Two-dimensional gel-electrophoresis obtained with a control sample (2 hours sodium acetate), showing the position of up-regulated proteins (red circles) and down-regulated proteins (blue circles) in uranyl exposed cells (protein loading: 100 µg; silver nitrate staining).
At the protein level, eleven spots were differentially regulated in uranyl exposed cells, i.e., fulfilling the described criteria (see Methods). These spots were identified by mass spectrometry (Table 2). The corresponding proteins were observed in a large range of pI and protein masses (as illustrated in Figure 4B). Two protein groups were discriminated, according to their behavior, i.e., up or down-regulation after uranyl acetate exposure (Table 2).
Table 2. Proteins with differentiated abundances in uranyl exposed E. coli cells.
| Protein | MW Da | pI | S | Np | % | Name | Code | Norm V±SD | Fold 50 UA/50 NaA | p-value | Fold 80 UA/50 NaA | p-value | ||
| 50 µM NaA | 50 µM UA | 80 µM UA | ||||||||||||
| Up-regulated | ||||||||||||||
| TrpR binding protein WrbA | 20832 | 5.59 | 159 | 5 | 35 | WrbA | b1004 | 3.8 105±5.0 104 | 2.5 106±1.3 106 | 3.4 106±1.2 106 | 6.64 | 0.04 | 9.08 | 0.01 |
| Superoxide dismutase. Fe | 21253 | 5.58 | 122 | 5 | 22 | SodB | b1656 | 1.4 106±5.1 105 | 7.1 106±6.4 106 | 1.0 107±4.7 106 | - | NS | 7.18 | 0.03 |
| Hypothetical protein b1667 | 11281 | 5.09 | 118 | 4 | 34 | YdhR | b1667 | 2.4 106±5.8 105 | 4.8 106±1.8 106 | 8.1 106±4.1 106 | - | NS | 3.39 | 0.05 |
| Transaldolase B | 35197 | 5.11 | 79 | 3 | 10 | TalB | b0008 | 1.7 106±1.6 105 | 2.7 106±9.7 105 | 4.7 106±6.7 105 | - | NS | 2.78 | 0.002 |
| Down-regulated | ||||||||||||||
| Polynucleotide phosphorylase/polyadenylase | 79797 | 5.39 | 147 | 6 | 10 | Pnp | b3164 | 2.6 106±8.9 105 | 4.6 105±1.6 105 | 1.6 106±4.7 105 | 5.55 | 0.01 | - | NS |
| Adeninephosphoribosyltransferase | 19847 | 5.26 | 81 | 2 | 16 | Apt | b0469 | 1.9 106±6.4 105 | 3.5 105±2.3 105 | 5.0 105±4.6 105 | 5.26 | 0.02 | 4.54 | 0.04 |
| Hydroperoxidase HPII(III) (catalase) | 84140 | 5.54 | 57 | 2 | 1 | KatE | b1732 | 1.6 106±4.1 105 | 7.3 105±5.5 105 | 3.5 105±2.5 105 | - | NS | 4.54 | 0.01 |
| GTP-bindingprotein | 67313 | 5.16 | 40 | 2 | 4 | BipA | b3871 | 8.7 105±1.9 105 | 2.1 105±7.0 104 | 3.8 105±2.3 105 | 4.17 | 0.004 | - | NS |
| Hypothetical protein b2266 | 11299 | 5.35 | 62 | 2 | 24 | ElaB | b2266 | 2.9 106±1.3 106 | 7.4 105±4.5 105 | 1.0 106±7.4 105 | 4.00 | 0.05 | - | NS |
| Molecular chaperone with ATPase activity | 71378 | 5.09 | 217 | 7 | 16 | HtpG | b0473 | 1.6 106±7.0 105 | 4.9 105±1.9 105 | 1.3 106±4.5 105 | 3.33 | 0.05 | - | NS |
| Protein disaggregation chaperone | 95526 | 5.37 | 354 | 12 | 19 | ClpB | b2592 | 1.76 106±1.9 105 | 5.9 105±2.3 105 | 8.1 105±6.2 104 | 3.03 | 0.002 | 2.17 | 0.001 |
MW: Molecular weight; pI: Isoelectric points; S: Identification score; Np: Number of identified peptides; %: Sequence coverage from identification results; Code: NCBI entry; NormV±SD: Averaged normalized spot volume±standard deviation; NaA: sodium acetate; UA: uranyl acetate; NS is indicated when the fold change was not significant.
4.1. Oxidative stress
Exposure to 80 µM uranyl acetatesignificantly affected the cells content in proteinsinvolved in oxidative stress response SodB and KatE. Fe-superoxide dismutase SodB was accumulated by more than 7 fold after exposure to 80 µM of uranyl acetate (Table 2). SodB is associated with the elimination of superoxide ions in the cytoplasm, by conversion into oxygen and hydrogen peroxide. In contrast, the hydroperoxidase HPII(III) (catalase) KatE was less abundant by a factor of 4.5 in cells exposed to 80 µM of uranyl acetate. KatE catalyzes the dismutation of hydrogen peroxide into water and oxygen. The increased SodB content in the presence of uranyl may suggest that uranyl exposure induces an oxidative stress mediated by the formation of superoxide radicals rather than by the formation of hydrogen peroxide.The strong up regulation of SodB in E. coli cells exposed to uranyl contrasts with transcriptomic results reported on uranyl exposure of C. crescentus cells [16]. In this study, no change in the expression of the sodB gene was observed, but the gene coding for Mn superoxide dismutase, SodA, was up-regulated by a factor of 2.9, upon C.crescentus cells exposure to 200 µM of uranyl nitrate [15]. These different superoxide dismutases, associated with different metal binding: Mn for SodA and Fe for SodB, exert a similar function of superoxide detoxification.
4.2. Redox reactions associated to oxidative stress
The most largely up-regulated protein upon uranium exposure, WrbA, is an oligomeric protein, that binds one molecule of flavin mononucleotide (FMN) per monomer [44]. This protein was respectively accumulated by factors of 6.64 and 9.08 in cells exposed to 50 µM and 80 of µMuranyl acetate. WrbA was characterized as well as under control of the master regulator RpoS [45], [46] and as a prototype of FMN containing NAD(P)H/quinone oxidoreductase (NQO) and classified as a type IV NQO protein [47]. It was shown to perform obligate two-electron reduction of quinones [47], a process that may be involved in the protection of cells against oxidative stress, by avoiding the reaction of semiquinone forms with oxygen. In addition to WrbA, a conserved hypothetical protein YdhR was also accumulated ≈3.4 fold in cells exposed to 80 µM of uranyl acetate (Table 2). YdhR is yet uncharacterized, however proteogenomic analysis revealed that YdhR (b1667) likely belongs to an identified group of mono-oxygenases (including ActVA-Orf6 and YgiN) involved in the oxygenation of polyaromatic ring compounds [48].
Interestingly, WrbA bears large similarity with other FMN-containing NAD(P)H/quinone oxidoreductases, as the chromate reductase (ChrR), which was previously shown to reduce a large range of molecules including chromate [49] or uranyl in vitro [50]. The ability to reduce chromate is shared by several FMN containing proteins of the flavodoxin family. However, it was observed that differences exist between these proteins concerning their ability/efficiency to perform the two-electron reduction of these compounds [51]. In particular the chromate reductases from E. coli and Pseudomonas putida were shown to differ in the rate of ROS production upon chromate reduction [49].
4.3. Additional stress responses
Exposure of E. coli cells to 50 and 80 µM of uranyl acetate led to the strong down-regulation of adenine phosphoribosyl transferase (Apt), that is involved in the synthesis of AMP from adenine and ribosylpyrophosphate. The polynucleotidephosphorylase (Pnp) was down regulated in cells exposed to 50 µM of uranyl acetate. Pnp is an exoribonuclease primary involved in single-stranded RNA degradation and is part of the RNA degradosome [52]. It was recently shown, that the stability of several small RNAs decreased in Δpnp mutants [53], which affected their regulatory function.
Finally, two heat shock proteins, the protein disaggregation chaperone ClpB and the molecular chaperone HtpG (Hsp90) are significantly less abundant in cells exposed to 50 µM of uranyl acetate than in control cells. This behaviour is unclear since these two heat shock proteins are chaperones involved in the stabilisation of proteins and have been shown to facilitate the folding of newly synthesized proteins in E. coli [54].
Concluding remarks
The experimental conditions used to challenge E. coli cells at low pH allowed the analysis of the proteomic response to uranyl exposure in conditions in which uranyl is associated with weak ligands as glucose and/or organic compounds and thus bioavailable to cells. Although, only 15% of cell survival was obtained after the 2 hours challenge at acidic pH, similar survival rates were obtained for both control and exposed cells, allowing to record reliable comparative proteomic data. Indeed, the PCA analysis showed a clear separation of exposed and control cells.
These proteomic data suggest that uranyl exposure in these conditions generates an oxidative stress probably due to redox reactions directly or indirectly mediated by uranyl. These results are supported by the up-regulation of WrbA and YdhR, possibly involved in a quinone redox cycling mechanisms. Since WrbA presents sequence homology with the chromate reductase of E. coli which was demonstrated to reduce uranyl in vitro by a “safe” two electron reduction mechanisms [49], [55], it would be interesting to study whether WrbA may be directly involved in uranyl reduction.
Methods
1. Bacterial strain
This E. coli strain MG1655 was used. Bacteria were maintained as glycerol stocks and stored at −80°C.
2. Growth conditions
Overnight pre-cultures in 20 mL of LB-Mes 100 mM pH 5,5 medium were inoculated with single colonies from LB agar plates and incubated at 37°C under agitation (150 rpm). The cultures were diluted in 100 mL of LB-Mes medium (Luria-Bertani medium LB buffered with 100 mM MES (morpholineethanesulfonic acid) pH 5.5) and incubated at 37°C under agitation (150 rpm). The bacterial growth was followed by measuring the optical density at 600 nm (OD). When the mid exponential growth phase was reached (i.e., OD600 = 0.6), cells were collected by centrifugation at 4000× g for 10 min and resuspended in 50 ml of LB medium diluted at 1/10 at pH 2.7 and supplemented with 4 g/L of glucose. In each flask, 50 µM or 80 µM of uranyl acetate or sodium acetate as control, were added. The cultures were exposed for 2 hours at 37°C under agitation. Finally each bacterial culture was harvested by centrifugation at 4000× g, for 10 min at 4°C, and the pellet was washed twice in 50 ml of Tris 100 mM at pH 7.
3. Uranium speciation using XAS
XAS experiments were performed at the U LIII-edge (17.166 keV) on the BM30B beamline[56] of the European Synchrotron Radiation Facility, Grenoble, France. The storage ring was operated in 16 bunches mode at 6 GeV with a ∼90 mA current. The beam energy was selected using a Si(220) double-crystal monochromator with an experimental resolution close to that theoretically predicted (∼0.4 eV). The beam size on the sample was approximately 300×200 µm (H x V). Spectra were recorded in fluorescence mode for the samples and liquid references, using a 30-element solid state Ge detector (Canberra, St Quentin en Yvelines, France), and in transmission mode for one solid sample, pressed as a pellet (U-phosphate).
Spectra were normalized and EXAFS oscillations were extracted using the Athena code [57]. The resulting EXAFS curves were weighted by k3 and qualitatively analyzed.
4. Dosage of uranium and bacterial enumeration
The uranium concentration in the supernatant was determined by spectrophotometric measurements using 2-(2-Thiazolylazo)-p-Cresol (TAC), as described in [43]. Bacterial survival rates were determined by counting bacterial colonies plated on LB agar medium at varying dilution rates before and after incubation with 50 µM or 80 µM of uranyl acetate or sodium acetate at pH 2.7.
5. Protein extraction and solubilisation
After centrifugation, the bacterial pellet was freeze-dried for 2 h and re-suspended in isoelectric focalisation (IEF) buffer of the following composition: 7 M urea, 2 M thiourea, 0.1% amidosulfobetaine (ASB14), 20 mM Dithiotheritol (DTT), 2% (v/v) carrier ampholytes (pH 4–7; GE Healthcare). The mixture was incubated twice during 10 min successively at 37°C and −80°C, and subsequently submitted to two cycles of 1 min sonication on ice. Protein extracts were then harvested in the supernatant after elimination of cellular debris by centrifugation (10,000× g for 30 min). Protein concentrations were evaluated using the Bio-Rad protein assay and protein extracts were stored at −20°C until further analysis.
6. Isoelectric focusing (IEF)
For IEF, an additional volume of IEF buffer was added to the protein solution containing 100 µg of proteins in a final volume of 400 µl (with 0.4% of Coomassie blue). IEF was carried out with immobilised pH gradients (Immobiline DryStrips pH 4–7, 18 cm NL GE Healthcare). After passive rehydration for 24 h, IEF was performed by using a Multiphor II (GE Healthcare) as follows: 150 V for 1 h, 350 V for 15 min, 750 V for 45 min, 1.5 kV for 1 h, and 3.5 kV for 17 h (1 mA, constant) for a total of 70 kVh.
7. SDS-PAGE
After two equilibration steps dedicated to reduction/alkylation of cysteins (using DTT (25 mM) and iodoacetamide (50 mM) respectively), the second dimension was obtained by SDS-PAGE, carried out with a Protean® II xi cell (Bio-Rad), and using a 12.5% (w/v) polyacrylamide resolving gel (width, 16 cm; length, 20 cm; thickness, 0.75 mm). The gels were fixed overnight and proteins were revealed using the silver nitrate staining. Gels were stored in water at 4°C before spot excision. For each condition, three independent cultures were obtained and the corresponding gels realized in triplicate.
8. Statistical analysis
Gels were scanned using the Fluorimager ProXpress from PerkinElmer and analyzed using the SameSpots 4.0 software (Nonlinear Dynamics, Newcastle upon Tyne, UK). Images were primarily tested for similar dynamic range and absence of saturation, and entirely pre-aligned before detection, resulting in optimal matching between all gels. The statistical tool integrated into the software, combines calculation of p values (ANOVA), q values, power, correlation analysis and Principal Component Analysis (PCA). PCA was used to interpret spot quantity variation among the different experimental conditions tested. This analysis is based upon the generation of a covariance matrix describing how each spot varies with respect to every other spot in the data set.
For this analysis, ANOVA was calculated using a variance stabilisation technique based on the logarithm of normalised volume. The spots with p value <0.05 and a power >0.8 were selected. In addition to statistical parameters a 2-fold ratio for significant spot alteration has been arbitrarily chosen. In order to remove false positives, spots with q values >0.15 were rejected [58].
9. Protein identification
9.1. Tryptic digestion
After protein spots excision from 2D gels, the excised fragments were washed several times and dried in a SpeedVac centrifuge for few minutes. Trypsin digestion (with 10 µL of a 10 ng/µL trypsin solution) was performed overnight with a dedicated automate (MultiPROBE II, Perkin Elmer). Thereafter, gel fragments were subsequently incubated twice for 15 min in a H2O/CH3CN (1∶1) solution to extract the peptides from the gel. The peptide extracts were then dried and solubilised in starting buffer for chromatographic elution, consisting of CH3CN 3%/HCOOH 0.1% in water.
9.2. Tandem mass spectrometry
The peptides were enriched and separated by reversed-phase LC with a precolumn/analytical column nano-flow setup (HPLC-Chip cube; Agilent Technologies). The peptides were further fragmented after a full survey scan (m/z 300-200) using an on-line ion trap mass spectrometer (model 6330, Agilent). MS/MS experiments of the 5 most abundant precursor ions were acquired and the fragmentation data were exported using the DataAnalysis Software (version 3.4, Bruker Daltonic).
9.3. Analysis of peptide sequences
For protein identification, extracted MS/MS peak lists were compared to the E. coli ORF protein database using the MASCOT Daemon (version 2.1.3) search engine. All searches were performed with no fixed modification and with variable modifications for carbamidomethylation of cysteines and for oxidation of methionines, and with a maximum of one missed cleavage. MS2 spectra were searched with a mass tolerance of 1.6 Da for precursor ions and 0.6 Da for fragment ions, respectively. The protein identification was validated if 2 peptides exhibited fragmentation profile score higher than the average default value for significance using MASCOT.
Funding Statement
This work was funded in part by the CNRS program EC2CO (Cytrix and MicrobiEn), and the “Toxicologie” program of the Commissariat à l'Energie Atomique CEA. The funders had no role in study design, data collection and analysis, decision to publish, or preparation of the manuscript.
References
- 1. Taylor DM, Taylor SK (1997) Environmental uranium and human health. Rev Environ Health 12: 147–157. [DOI] [PubMed] [Google Scholar]
- 2. Brugge D, de Lemos JL, Oldmixon B (2005) Exposure pathways and health effects associated with chemical and radiological toxicity of natural uranium: a review. Rev Environ Health 20: 177–193. [DOI] [PubMed] [Google Scholar]
- 3. Maher K, Bargar JR, Brown GE Jr (2013) Environmental speciation of actinides. Inorg Chem 52: 3510–3532. [DOI] [PubMed] [Google Scholar]
- 4. Li W, Victor D, Chakrabarlti C (1980) Effect of pH and Uranium Concentration on Interaction of Uranium(VI) and Uranium(IV) with organic Ligand in aqueous Solutions. Anal Chem 52: 520–523. [Google Scholar]
- 5. Cardenas E, Wu WM, Leigh MB, Carley J, Carroll S, et al. (2008) Microbial communities in contaminated sediments, associated with bioremediation of uranium to submicromolar levels. Appl Environ Microbiol 74: 3718–3729. [DOI] [PMC free article] [PubMed] [Google Scholar]
- 6. Akob DM, Mills HJ, Kostka JE (2007) Metabolically active microbial communities in uranium-contaminated subsurface sediments. FEMS Microbiol Ecol 59: 95–107. [DOI] [PubMed] [Google Scholar]
- 7. Merroun ML, Selenska-Pobell S (2008) Bacterial interactions with uranium: an environmental perspective. J Contam Hydrol 102: 285–295. [DOI] [PubMed] [Google Scholar]
- 8. Mondani L, Benzerara K, Carriere M, Christen R, Mamindy-Pajany Y, et al. (2011) Influence of uranium on bacterial communities: a comparison of natural uranium-rich soils with controls. PLoS One 6: e25771. [DOI] [PMC free article] [PubMed] [Google Scholar]
- 9. Finlay JA, Allan VJ, Conner A, Callow ME, Basnakova G, et al. (1999) Phosphate release and heavy metal accumulation by biofilm-immobilized and chemically-coupled cells of a Citrobacter sp. pre-grown in continuous culture. Biotechnol Bioeng 63: 87–97. [DOI] [PubMed] [Google Scholar]
- 10. Choudhary S, Sar P (2009) Characterization of a metal resistant Pseudomonas sp. isolated from uranium mine for its potential in heavy metal (Ni2+, Co2+, Cu2+, and Cd2+) sequestration. Bioresour Technol 100: 2482–2492. [DOI] [PubMed] [Google Scholar]
- 11. Kazy SK, D'Souza SF, Sar P (2009) Uranium and thorium sequestration by a Pseudomonas sp.: mechanism and chemical characterization. J Hazard Mater 163: 65–72. [DOI] [PubMed] [Google Scholar]
- 12. Kelly SD, Boyanov MI, Bunker BA, Fein JB, Fowle DA, et al. (2001) XAFS determination of the bacterial cell wall functional groups responsible for complexation of Cd and U as a function of pH. J Synchrotron Radiat 8: 946–948. [DOI] [PubMed] [Google Scholar]
- 13. Merroun ML, Raff J, Rossberg A, Hennig C, Reich T, et al. (2005) Complexation of uranium by cells and S-layer sheets of Bacillus sphaericus JG-A12. Appl Environ Microbiol 71: 5532–5543. [DOI] [PMC free article] [PubMed] [Google Scholar]
- 14. Jroundi F, Merroun ML, Arias J, Maria, Rossberg A, et al. (2007) Spectroscopic and Microscopic Characterization of Uranium Biomineralization in Myxococcus xanthus. Geomicrobiology journal 24: 441–449. [Google Scholar]
- 15. Renninger N, Knopp R, Nitsche H, Clark DS, Keasling JD (2004) Uranyl precipitation by Pseudomonas aeruginosa via controlled polyphosphate metabolism. Appl Environ Microbiol 70: 7404–7412. [DOI] [PMC free article] [PubMed] [Google Scholar]
- 16. Hu P, Brodie EL, Suzuki Y, McAdams HH, Andersen GL (2005) Whole-genome transcriptional analysis of heavy metal stresses in Caulobacter crescentus. J Bacteriol 187: 8437–8449. [DOI] [PMC free article] [PubMed] [Google Scholar]
- 17. Macaskie LE, Bonthrone KM, Yong P, Goddard DT (2000) Enzymically mediated bioprecipitation of uranium by a Citrobacter sp.: a concerted role for exocellular lipopolysaccharide and associated phosphatase in biomineral formation. Microbiology 146: 1855–1867. [DOI] [PubMed] [Google Scholar]
- 18. Beazley MJ, Martinez RJ, Sobecky PA, Webb SM, Taillefert M (2007) Uranium biomineralization as a result of bacterial phosphatase activity: insights from bacterial isolates from a contaminated subsurface. Environ Sci Technol 41: 5701–5707. [DOI] [PubMed] [Google Scholar]
- 19. Suzuki Y, Banfield J (2004) Resistance to, and Accumulation of, Uranium by Bacteria from a Uranium-Contaminated Site. Geomicrobiology journal 21: 113–121. [Google Scholar]
- 20. Strandberg GW, Shumate SE, Parrott JR (1981) Microbial Cells as Biosorbents for Heavy Metals: Accumulation of Uranium by Saccharomyces cerevisiae and Pseudomonas aeruginosa. Appl Environ Microbiol 41: 237–245. [DOI] [PMC free article] [PubMed] [Google Scholar]
- 21. Holmes DE, O'Neil RA, Chavan MA, N'Guessan LA, Vrionis HA, et al. (2009) Transcriptome of Geobacter uraniireducens growing in uranium-contaminated subsurface sediments. Isme J 3: 216–230. [DOI] [PubMed] [Google Scholar]
- 22. Bencheikh-Latmani R, Williams SM, Haucke L, Criddle CS, Wu L, et al. (2005) Global transcriptional profiling of Shewanella oneidensis MR-1 during Cr(VI) and U(VI) reduction. Appl Environ Microbiol 71: 7453–7460. [DOI] [PMC free article] [PubMed] [Google Scholar]
- 23. Hillson NJ, Hu P, Andersen GL, Shapiro L (2007) Caulobacter crescentus as a whole-cell uranium biosensor. Appl Environ Microbiol 73: 7615–7621. [DOI] [PMC free article] [PubMed] [Google Scholar]
- 24. Wilkins MJ, Verberkmoes NC, Williams KH, Callister SJ, Mouser PJ, et al. (2009) Proteogenomic monitoring of Geobacter physiology during stimulated uranium bioremediation. Appl Environ Microbiol 75: 6591–6599. [DOI] [PMC free article] [PubMed] [Google Scholar]
- 25. Lok CN, Ho CM, Chen R, Tam PK, Chiu JF, et al. (2008) Proteomic identification of the Cus system as a major determinant of constitutive Escherichia coli silver resistance of chromosomal origin. J Proteome Res 7: 2351–2356. [DOI] [PubMed] [Google Scholar]
- 26. Barre O, Mourlane F, Solioz M (2007) Copper induction of lactate oxidase of Lactococcus lactis: a novel metal stress response. J Bacteriol 189: 5947–5954. [DOI] [PMC free article] [PubMed] [Google Scholar]
- 27. Sharma S, Sundaram CS, Luthra PM, Singh Y, Sirdeshmukh R, et al. (2006) Role of proteins in resistance mechanism of Pseudomonas fluorescens against heavy metal induced stress with proteomics approach. J Biotechnol 126: 374–382. [DOI] [PubMed] [Google Scholar]
- 28. Bar C, Patil R, Doshi J, Kulkarni MJ, Gade WN (2007) Characterization of the proteins of bacterial strain isolated from contaminated site involved in heavy metal resistance–a proteomic approach. J Biotechnol 128: 444–451. [DOI] [PubMed] [Google Scholar]
- 29. Kilic NK, Stensballe A, Otzen DE, Donmez G (2010) Proteomic changes in response to chromium(VI) toxicity in Pseudomonas aeruginosa. Bioresour Technol 101: 2134–2140. [DOI] [PubMed] [Google Scholar]
- 30. Mrvcic J, Butorac A, Solic E, Stanzer D, Bacun-Druzina V, et al. (2012) Characterization of Lactobacillus brevis L62 strain, highly tolerant to copper ions. World J Microbiol Biotechnol 29: 75–85. [DOI] [PubMed] [Google Scholar]
- 31. Malard V, Gaillard JC, Berenguer F, Sage N, Quemeneur E (2009) Urine proteomic profiling of uranium nephrotoxicity. Biochim Biophys Acta 1794: 882–891. [DOI] [PubMed] [Google Scholar]
- 32. Malard V, Prat O, Darrouzet E, Berenguer F, Sage N, et al. (2005) Proteomic analysis of the response of human lung cells to uranium. Proteomics 5: 4568–4580. [DOI] [PubMed] [Google Scholar]
- 33. Prat O, Berenguer F, Malard V, Tavan E, Sage N, et al. (2005) Transcriptomic and proteomic responses of human renal HEK293 cells to uranium toxicity. Proteomics 5: 297–306. [DOI] [PubMed] [Google Scholar]
- 34. Thomas RA, Macaskie LE (1998) The effect of growth conditions on the biodegradation of tributyl phosphate and potential for the remediation of acid mine drainage waters by a naturally-occurring mixed microbial culture. Appl Microbiol Biotechnol 49: 202–209. [DOI] [PubMed] [Google Scholar]
- 35. Nedelkova M, Merroun ML, Rossberg A, Hennig C, Selenska-Pobell S (2007) Microbacterium isolates from the vicinity of a radioactive waste depository and their interactions with uranium. FEMS Microbiology Ecology 59: 694–705. [DOI] [PubMed] [Google Scholar]
- 36. Lutke L, Moll H, Bernhard G (2012) Insights into the uranium(vi) speciation with Pseudomonas fluorescens on a molecular level. Dalton Trans 41: 13370–13378. [DOI] [PubMed] [Google Scholar]
- 37. Koban A, Geipel G, Roßberg A, Bernhard G (2004) Uranium(VI) complexes with sugar phosphates in aqueous solution. Radiochimica Acta 92: 903–908. [Google Scholar]
- 38. Allen PG, Shuh DK, Bucher JJ, Edelstein NM, Reich T, et al. (1996) EXAFS Determinations of Uranium Structures: The Uranyl Ion Complexed with Tartaric, Citric, and Malic Acids. Inorganic Chemistry 35: 784–787. [Google Scholar]
- 39. Hudson EA, Allen PG, Terminello LJ, Denecke MA, Reich T (1996) Polarized x-ray-absorption spectroscopy of the uranyl ion: Comparison of experiment and theory. Physical Review B 54: 156–165. [DOI] [PubMed] [Google Scholar]
- 40. Foster JW (2004) Escherichia coli acid resistance: tales of an amateur acidophile. Nat Rev Microbiol 2: 898–907. [DOI] [PubMed] [Google Scholar]
- 41. Foster JW, Hall HK (1991) Inducible pH homeostasis and the acid tolerance response of Salmonella typhimurium. J Bacteriol 173: 5129–5135. [DOI] [PMC free article] [PubMed] [Google Scholar]
- 42. Lin J, Lee IS, Frey J, Slonczewski JL, Foster JW (1995) Comparative analysis of extreme acid survival in Salmonella typhimurium, Shigella flexneri, and Escherichia coli. J Bacteriol 177: 4097–4104. [DOI] [PMC free article] [PubMed] [Google Scholar]
- 43. Teixeira LSG, Costa ACS, Ferreira SLC, Freitas ML, Souza de Carvalho M (1999) Spectrophotometric Determination of Uranium Using 2-(2-Thiazolylazo)-p-Cresol (TAC) in the Presence of Surfactants. J Braz Chem Soc 10: 519.522. [Google Scholar]
- 44. Grandori R, Khalifah P, Boice JA, Fairman R, Giovanielli K, et al. (1998) Biochemical characterization of WrbA, founding member of a new family of multimeric flavodoxin-like proteins. J Biol Chem 273: 20960–20966. [DOI] [PubMed] [Google Scholar]
- 45. Rahman M, Hasan MR, Oba T, Shimizu K (2006) Effect of rpoS gene knockout on the metabolism of Escherichia coli during exponential growth phase and early stationary phase based on gene expressions, enzyme activities and intracellular metabolite concentrations. Biotechnol Bioeng 94: 585–595. [DOI] [PubMed] [Google Scholar]
- 46. Collet A, Cosette P, Beloin C, Ghigo JM, Rihouey C, et al. (2008) Impact of rpoS deletion on the proteome of Escherichia coli grown planktonically and as biofilm. J Proteome Res 7: 4659–4669. [DOI] [PubMed] [Google Scholar]
- 47. Patridge EV, Ferry JG (2006) WrbA from Escherichia coli and Archaeoglobus fulgidus is an NAD(P)H:quinone oxidoreductase. J Bacteriol 188: 3498–3506. [DOI] [PMC free article] [PubMed] [Google Scholar]
- 48. Revington M, Semesi A, Yee A, Shaw GS (2005) Solution structure of the Escherichia coli protein ydhR: a putative mono-oxygenase. Protein Sci 14: 3115–3120. [DOI] [PMC free article] [PubMed] [Google Scholar]
- 49. Ackerley DF, Gonzalez CF, Park CH, Blake R 2nd, Keyhan M, et al. (2004) Chromate-reducing properties of soluble flavoproteins from Pseudomonas putida and Escherichia coli. Appl Environ Microbiol 70: 873–882. [DOI] [PMC free article] [PubMed] [Google Scholar]
- 50. Barak Y, Ackerley DF, Dodge CJ, Banwari L, Alex C, et al. (2006) Analysis of novel soluble chromate and uranyl reductases and generation of an improved enzyme by directed evolution. Appl Environ Microbiol 72: 7074–7082. [DOI] [PMC free article] [PubMed] [Google Scholar]
- 51. Fraaije MW, Mattevi A (2000) Flavoenzymes: diverse catalysts with recurrent features. Trends Biochem Sci 25: 126–132. [DOI] [PubMed] [Google Scholar]
- 52. Kushner SR (2002) mRNA decay in Escherichia coli comes of age. J Bacteriol 184: 4658–4665. [DOI] [PMC free article] [PubMed] [Google Scholar]
- 53. De Lay N, Gottesman S (2011) Role of polynucleotide phosphorylase in sRNA function in Escherichia coli. RNA 17: 1172–1189. [DOI] [PMC free article] [PubMed] [Google Scholar]
- 54. Thomas JG, Baneyx F (2000) ClpB and HtpG facilitate de novo protein folding in stressed Eschericia coli cells. Mol Microbiol 36: 1360–70. [DOI] [PubMed] [Google Scholar]
- 55. Swaramoorthy S, Poulain S, Hienerwadel R, Bremond N, Sylvester MD, et al. (2012) Crystal structure of ChrR–a quinone reductase with the capacity to reduce chromate. PLoSOne 7(4): e36017. [DOI] [PMC free article] [PubMed] [Google Scholar]
- 56. Proux O, Biquard X, Lahera E, Menthonnex J, Prat A, et al. (2005) A new beamline for X-ray absorption investigation of very diluted systems of environmental, material and biological interests. Phys Scr 115: 970–973. [Google Scholar]
- 57. Ravel B, Newville M (2005) ATHENA, ARTEMIS, HEPHAESTUS: data analysis for X-ray absorption spectroscopy using IFEFFIT. J Synchrotron Radiat 12: 537–541. [DOI] [PubMed] [Google Scholar]
- 58. Storey JD, Tibshirani R (2003) Statistical significance for genomewide studies. Proc Natl Acad Sci U S A 100: 9440–9445. [DOI] [PMC free article] [PubMed] [Google Scholar]