Abstract
Purpose
We examined the development of osteoarthritis (OA) and post-traumatic bone loss after surgery for tibial plateau fractures (TPF).
Methods
Patients who had participated in previous follow-up (FU) examinations after TPF and primary reduction and internal fixation were re-evaluated. At the first FU, a median of three years after the accident (short-term FU), the patients underwent functional assessments and standardised X-rays to grade radiological OA and post-traumatic bone loss. At the second FU, a median of 22 years after the accident (long-term FU), 30 patients were available. An identical protocol was applied, and additional investigations [Knee Injury and Osteoarthritis Outcome Score (KOOS) and magnetic resonance imaging (MRI) of the injured knee] were performed.
Results
When the subjective and objective results at first FU were compared with those of the second FU for the same patients, deterioration of symptoms, signs and radiological OA was noted; however, ten patients had no OA even after the long-term FU. Some patients developed post-traumatic bone loss. In 13 of 31 knees, there was little or no radiological evidence of bone loss at the second FU.
Conclusions
The short-term FU examination results after TPF have little prognostic value for the individual patient, as good results may deteriorate over the long run; however, there were some knees with no OA at the long-term FU. This is the first report focusing on post-traumatic bone loss after TPF.
Keywords: Tibial plateau fractures, Follow-up studies, Osteoarthritis, Fracture fixation, Radiography
Introduction
Tibial plateau fractures (TPF) are associated with the risk of developing pain, limited knee motion, angular deformity, instability and post-traumatic osteoarthritis (OA) of the knee. In 1955, Ender emphasised that the rate of OA increases with time after the accident.[1] Dustman et al. noted a 56 % incidence in radiological OA after a two to five-year follow-up (FU) and a 78 % incidence after ten to 20 years.[2] At final follow-up, evidence of radiological OA was present in 33 of 125 cases (26.4 %) in a series conducted by Manidakis et. al. comparing different treatment options.[3] Using registry data from their institution, Mehin et al. conducted a survival analysis and showed that the number of patients with TPF who needed total knee arthroplasty (TKA) increased with time after injury.[4] These studies compared groups of patients with different lengths of follow-up. The development of OA in individual patients can be ascertained by examining the same patients at two different time points after the accident. So far, however, few reports have re-examined the same patients after several years. Hohl reported the results of 300 patients with an average FU of five years.[5] He re-examined 25 of those patients after a further two years and found that their clinical results remained the same. Lansinger et al. presented the results of 102 tibial condylar fractures with a mean FU of 20 years (patients were part of a study by Rasmussen that had a mean FU length of 7.3 years).[6, 7] The authors found no difference in clinical results of the shorter and longer FU. Rademakers et al. performed examinations at one year and an average of 14 years after operated TPF and concluded that the one year FU adequately predicts long-term results.[8] However, these studies did not address longitudinal changes in radiological OA in individual patients. A longer FU may provide more information about the development of OA after TPF. Nonetheless, studies with FUs greater than ten years are limited (Table 1).
Table 1.
Length of follow-up (FU) in frequently cited studies on tibial plateau fracture (TPF)
| Average length of FU (years)a | Minimum and maximum length of FU (years) | Patients examined/total number of patients | |
|---|---|---|---|
| Ender 1955 | 8 | 2 - 23 | 122/303 |
| Thiele 1968 | 8.8 | 4 - 14 | 204/486 |
| Roberts 1968 | 4 | 1 - 12 | 100/230 |
| Dovey and Heerfordt 1971 | NA | 1.5 - 10 | 200/261 |
| Rasmussen 1972; 1973 | 7.3 | 4 - 11 | 204/260 |
| Hohl 1974 | 5 | 2 - 29 | 300/917 |
| Lansinger 1986 b | 20 | NA | 102/260 |
| Moore 1987 | 3.7 | 1 - 10 | 320/988 |
| Tscherne 1993 | 5.9 | NA | 190/244 |
| Honkonen 1994 | 7.6 | 3.3 – 13.4 | 130/212 |
| Rademaker 2007 | 14 | 5 - 27 | 109/202 |
NA not available/applicable
aMost papers did not state whether “average” signified the arithmetic mean or the median
bPart of Rasmussen’s collective
Low bone mass is a known complication after an injury to a lower extremity.[9–11] Although the same could be expected for TPF, formal proof is lacking. The aims of this study were to:
Gather information about OA more than ten years after TPF
Compare OA grade at two time points in the same patients
Investigate the interrelation of conventional X-rays and magnetic resonance imaging (MRI) in knees with healed TPF
Compare post-traumatic bone loss following TPF at two time points in the same patients.
Methods
Patients with surgically treated TPF for whom data from a standardised FU examination was available were recruited for the intended re-evaluation. Two studies concerning TPF treated with the same plate design and rehabilitation protocol were conducted in 1985 and 1999 at our institution. [12, 13] The objective of these previous FU examinations was to assess the results of open reduction and internal fixation (ORIF) of TPF. Out of 128 consecutive patients who participated in one of the previous two studies, 46 patients were still alive. All living patients were contacted. Patients with dementia or those unable to participate in the study due to impaired health were excluded. Nineteen men and 11 women entered the study, for a total of 31 TPF. Twenty-five Arbeitsgemeinschaft für Osteosynthesefragen/Association for the Study of Internal Fixation (AO/ASIF) type B and six type C fractures were encountered. From 1971 to 1998, a specially designed plate was used to stabilise displaced B- and C-type TPF (Fig. 1). The plate was manufactured by Heinrich C. Ulrich Company (Ulm, Germany) until 1999 and has since been replaced by anatomically shaped plates with fixed–angle screws (Fig. 2).The study was approved by the Ethics Committee of our institution. All patients were contacted in accordance with the Ethics Committee guidelines, and all patients signed informed consent regarding the protocol and purpose of the study.
Fig. 1.
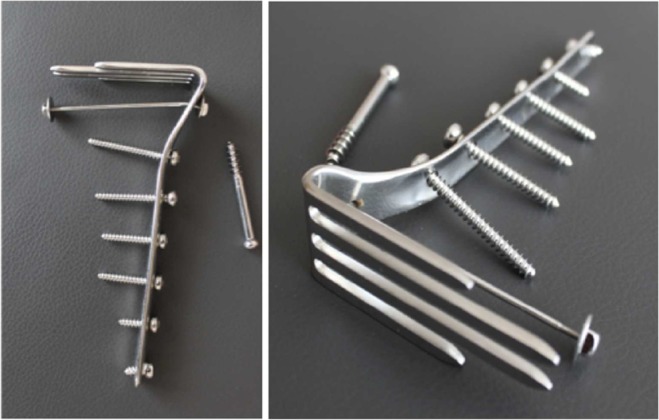
Fork-shaped plate (or fork plate): The prongs of the fork were designed to support the shattered tibial plateau, an early example of a fixed-angled implant. Plates with either short prongs or long prongs were used, depending on fracture form
Fig. 2.
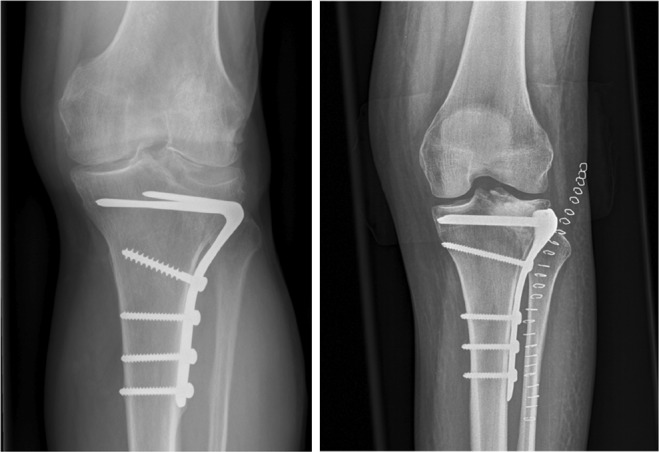
Anteroposterior X-ray with the fork plate on the left and modern fixed-angle, anatomically shaped plates (Synthes ®) on the right
The plate and surgical procedure are described by the developer[14]: The proximal lateral tibia was approached through an inverted L incision. The lateral compartment of the knee joint was opened by submeniscal arthrotomy to visualise the joint surface. After realignment of the fragments and reconstruction of the tibial plateau, the fork-shaped plate was attached so that the prongs supported the shattered tibial plateau. All operations were carried out by the former head of the department and inventor of the plate or by senior surgeons. No patient underwent a meniscectomy. During the postoperative period, all patients were treated consistently with the same protocol. Passive motion was initiated on the first postoperative day; full weight bearing was not allowed for 12 postoperative weeks.
Scores and classifications applied at the first and second FU examinations
At the first two FU examinations (1985 and 1999),[12, 13] the following outcome measures were used: subjective complaints (Table 2) were quantified using a symptom scale (SYS), with a range of 5–20; clinical examinations (Table 3) were summarised using a clinical examination scale (CES), with a range of 5–18. Higher scale values indicate poorer results.
Table 2.
A symptom scale (SYS) value was determined by summing the point values of the listed items. The minimum score on the SYS for an asymptomatic knee is 5, and the maximum value is 20, representing the worst subjective report
| Symptoms | Scores | |
|---|---|---|
| 1. Patient’s statement of pain | no pain | 1 |
| mild pain | 2 | |
| mild pain at certain movements (e.g. ascending stairs) | 3 | |
| mild pain at walking | 4 | |
| moderate but permanent | 5 | |
| strong | 6 | |
| 2. Subjective feeling of instability | stable | 1 |
| occasional instability | 2 | |
| permanent instability | 3 | |
| 3. Walking distance | unlimited | 1 |
| up to 1 h | 2 | |
| up to 15 min | 3 | |
| a few steps | 4 | |
| no walking possible | 5 | |
| 4. Ability to ascend/descend stairs | good | 1 |
| painful | 2 | |
| impossible | 3 | |
| 5. Ability to squat | good | 1 |
| painful | 2 | |
| impossible | 3 |
Table 3.
Clinical examination scale (CES) value was determined by summing the following items: minimum score on the CES for a stable knee with normal range of motion, 5; highest possible value, 18, representing the worst clinical presentation
| Objective findings | Scores | |
|---|---|---|
| 1. Varus or valgus instability | <5° | 1 |
| 5-9° | 2 | |
| >10° | 3 | |
| 2. Anterior drawer instability | <5 mm | 1 |
| 5 - 9 mm | 2 | |
| >10 mm | 3 | |
| 3. Extension lag | <10° | 1 |
| 10-20° | 2 | |
| >20° | 3 | |
| 4. Flexion deficit | <10° | 1 |
| 10-14° | 2 | |
| 15-19° | 3 | |
| >20° | 4 | |
| 5. Gait characteristic | good | 1 |
| limping | 2 | |
| 1 walking stick | 3 | |
| 2 walking sticks/crutches | 4 | |
| impossible | 5 |
Table 4.
Age at accident, length of hospital stay and time until return to work for 30 patients with tibial plateau fractures (TPF). Lengths of first and second follow-up (FU)
| Minimum | 25 % quartile | Median | 75 % quartile | Maximum | |
|---|---|---|---|---|---|
| Age at accident (years) | 18 | 31 | 41 | 49 | 79 |
| Length of hospital stay (days) | 6 | 10 | 14 | 20 | 92 |
| Time until return to work (days) | 61 | 111 | 136 | 177 | 309 |
| First FU (years) | 1 | 2 | 3 | 7 | 10 |
| Second FU (years) | 13 | 15 | 22 | 29 | 35 |
OA of the knee was classified according to a modified Kellgren–Lawrence grading scale[15], with an additional grade added for endoprosthesis: 1 = no OA; 2 = osteophytes; 3 = narrowing of joint space; 4 = subchondral alterations; 5 = total knee endoprosthesis. The degree of bone rarefaction at the knee was defined using a system similar to Singh’s grades of osteoporosis at the hip[16] and Jhamaria’s classification of osteoporosis at the calcaneus.[17, 18] Grading was determined by changes in bone structure rather than bone density and were based on previously published definitions[19]:
normal
slight reduction of trabecular bone
osteoporosis, predominantly of trabecular bone
osteoporosis of trabecular and cortical bone
Second follow-up examination
At the second FU examination, we followed the same protocol used in the prior examination to maintain comparability. Additional investigations were also performed. Clinical examination was conducted by the first two authors (GM and EF) using a structured examination protocol. The patients completed the Knee Injury and Osteoarthritis Outcome Score (KOOS).[20, 21] For further analysis, the sum of the five KOOS components was used. On full-length leg X-rays, the mechanical axis deviation (MAD) was measured as the horizontal distance between the intercondylar eminence and a line drawn through the centre of the femoral head and the centre of the ankle joint, with negative values indicating varus malalignment.[22] Standard anteroposterior (AP) and lateral radiographs of the knee were performed with patients lying down, and full-length weight-bearing radiographs were performed with patients standing up. Radiographs were accepted if all measurement criteria were available. MRI of the injured knee was examined for degree of effusion, chondral damage and changes to the medial and lateral meniscus and cruciate and lateral ligaments. The semiquantitative Whole Organ Magnetic Resonance Score (WORMS) was also assessed.[23] Evaluations were performed by a radiologist experienced in musculoskeletal radiology (GS).
Statistical analysis
Relationships between two variables are expressed as Pearson’s correlation coefficients with 95 % confidence intervals (CI). Cronbach’s alpha coefficient was used to assess the consistency of the KOOS components. Values > 0.9, > 0.8 and > 0.7 corresponded to excellent, good and acceptable, respectively.[24] Because OA and bone loss were quantified as ordered categories and symptom and sign scales were ordinal, the paired differences between these variables at the investigated time points were tested with the Wilcoxon signed-rank test, with ties being taken into account. The null hypotheses were rejected at the 0.05 level. We used Systat 12 (Systat Software, Inc., Chicago, IL, USA) for statistical calculations.
Results
Injury and primary care
In this series, there were no open fractures. An emergency operation was performed the day the injury in 16 of 31 knees. For patient data related to age at time of accident, length of hospital stay and time until return to work, see Table 4.
Comparison of outcomes at three years versus 22 years of FU
We considered the first FU examinations, which had a median of three years, the short-term FU. The second FU, which occurred after a median of 22 years, was considered the long-term FU (Table 4).
Subjective and objective clinical results
Between short- and long-term FU examinations, four patients received a total knee endoprosthesis. For those patients, SYS and CES do not describe the post-traumatic condition at the long-term FU. The worst possible values for SYS and CES were inserted. This approach was valid, as statistical tests used ranks and not numerical values. With these regulations, SYS ameliorated in six knees and deteriorated in 12. Paired differences, as tested using the Wilcoxon signed-rank test, were significant (P = 0.047). CES was better in five knees and worse in 13 (P = 0.041). For comparability with other studies, patients with endoprosthesis were excluded, and the analysis was repeated. Under this condition, SYS and CES did not deteriorate (P = 0.43 and P = 0.39, respectively). The process of scoring obscures the fact that the ability to bend the knee and gait characteristics deteriorated (P ≤ 0.05). Two patients had anterior drawer instabilities of ten millimetres or more at the long-term but not at the short-term FU. Even at the long-term FU, nine patients had the highest possible scores in all SYS subcategories; ten patients had the best scores in all CES subcategories.
Radiological outcome
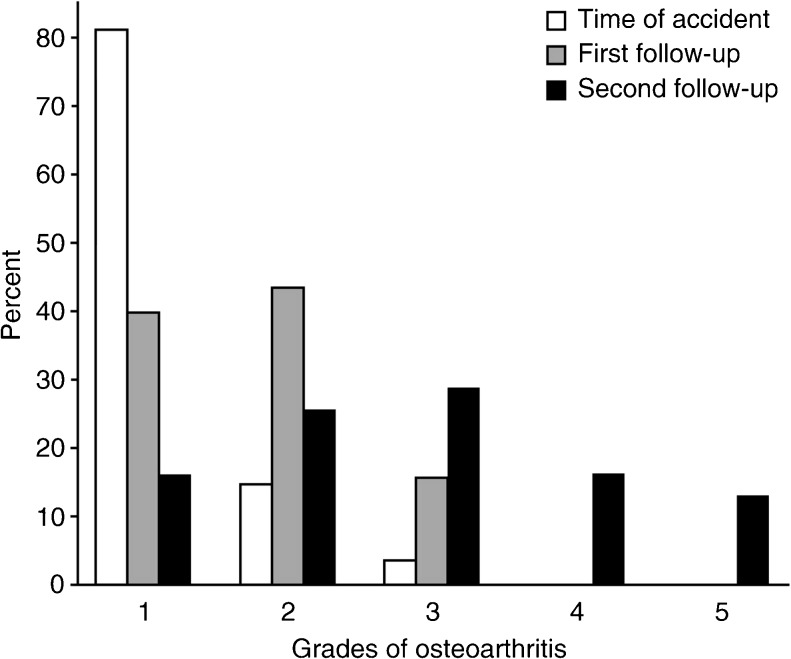
The incidence of radiological OA increased at each FU (Fig. 3).
Fig. 3.
Radiological degree of osteoarthritis (OA) at the time of accident and after short- and long-term follow-up (FU) (median 3 and 22 years, respectively)
The Wilcoxon signed-rank test indicated significant differences between OA at the time of accident and the short-term FU (P = 0.0021), between short- and long-term FUs (P = 0.00033) and between OA at the time of accident and long-term FU (P = 0.000014). At the long-term FU, a radiological assessment of the contralateral knee was performed, and the difference between OA in the affected and unaffected knee was significant (P < 0.01). Of the 21 knees that had no OA or osteophytes as the only sign of degeneration (grade 1 or 2) at the short-term FU, ten remained in this subgroup at the long-term FU; 11 showed deterioration.
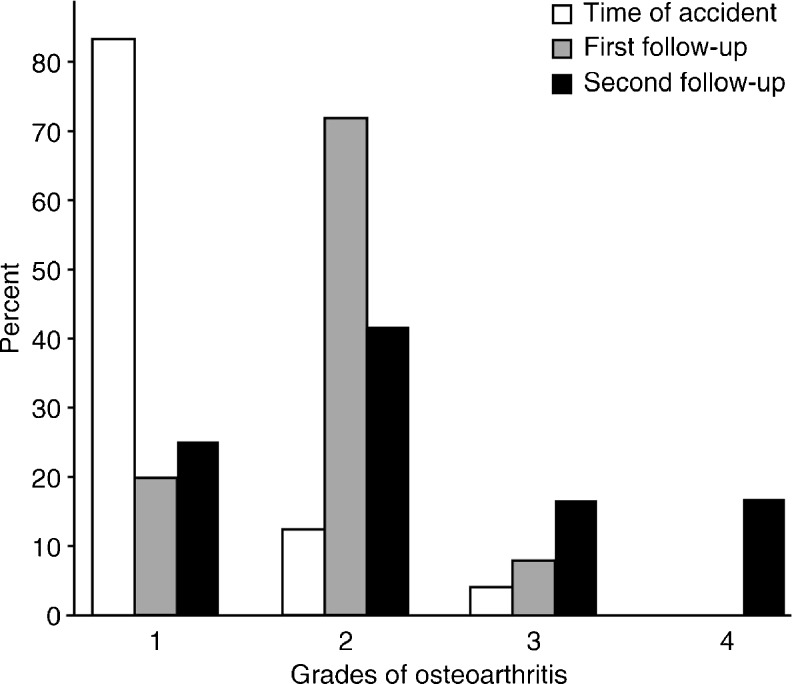
Figure 4 shows the progression of structural bone loss at the knee. The Wilcoxon signed-rank test indicated significant differences between the degree of osteoporosis at the time of injury and at the short-term FU (P < 0.01) and between time of injury and long-term FU (P < 0.01) but not between short- and long-term FU (P = 0.10). The side-to-side difference in the degree of osteoporosis at the long-term FU was also significant (P = 0.00091). Osteoporosis of the knee is not an inevitable consequence of TPF, as indicated by the fact that there were 13 knees with no or only slight bone loss (grade 1 and 2) at the long-term FU. Between the time of injury and the short-term FU, bone structure was classified as worsened in 17 knees and as ameliorated in two. Between short- and long-term FUs, bone loss appeared to increase in nine knees and to improve in five.
Fig. 4.
Degree of bone loss at the time of accident and after short- and long-term follow-up (FU) (median 3 and 22 years, respectively)
At the second FU, we asked patients whether they had had fractures of the lower extremities during the years between TPF and the FU, hypothesising an equal risk of fracture for both legs. Five patients reported having had fractures in the same extremity as the TPF: two of the proximal femur, one of the tibial shaft fracture, one bimalleolar and one calcaneus. On the contralateral extremity, no fracture occurred. This produces a binomial probability of P = 0.031. Therefore, the null hypothesis of equal risk of fracture for extremities with and without preceding TPF must be rejected.
Additional investigations at the second FU
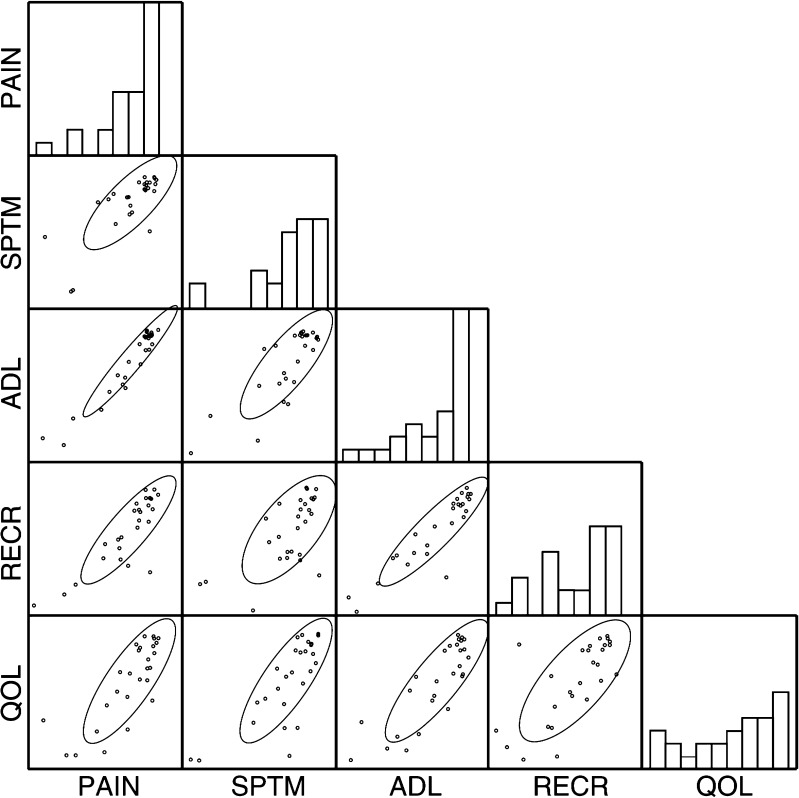
Correlations between the five components of the KOOS at long-term FU are illustrated in Fig. 5. Cronbach’s alpha was 0.95, which indicates that the five scales reflect results essentially similar to patients’ subjective complaints. Hence, the sum of the five KOOS components represents patient questionnaire results, and an asymptomatic patient may receive a maximum score of 500.
Fig. 5.
The five components of the Knee Injury and Osteoarthritis Outcome Score (KOOS): PAIN pain, SPTM symptoms, ADL activities of daily living, RECR recreational activities, QOL quality of life. Four patients with total knee endoprostheses were omitted. Histograms are marginal distributions; ovals are 0.6827 confidence ellipses
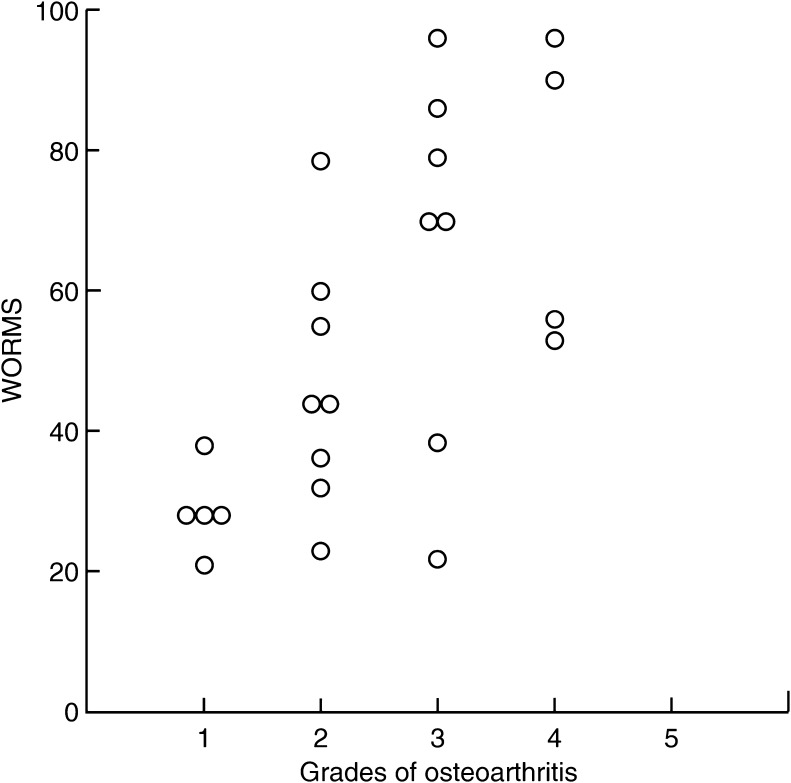
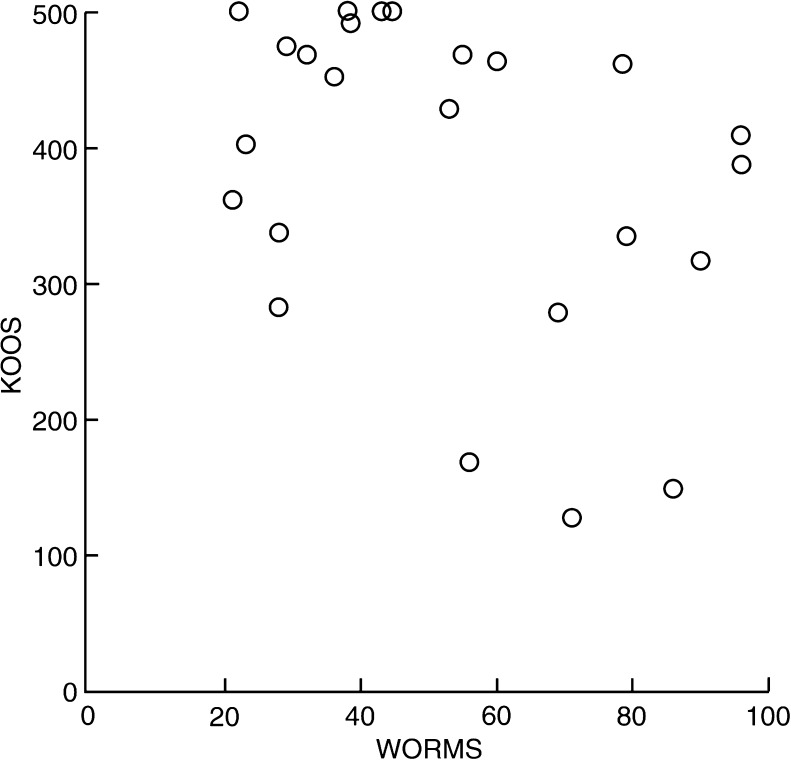
Because SYS is not a validated outcome measure, we compared results with the sum of the KOOS components. Pearson’s correlation coefficient was −0.91 (0.95 % CI: −0.96 to −0.81). Therefore, the SYS is a valid surrogate for the KOOS. Median WORMS values increased with radiographically determined OA; however, there was considerable variance (Fig. 6). Pearson’s correlation coefficient was −0.65 (0.95 CI −0.33 to −0.83)
Fig. 6.
Whole Organ Magnetic Resonance Scores (WORMS) for four groups with radiological osteoarthritis (OA)
Four patients with no complaints (KOOS = 500) had no OA (low WORMS); three with appreciable complaints (KOOS <250) had OA (higher WORMS). Pearson’s correlation coefficient was −0.38 (0.95 CI −0.68 to 0.03). Therefore, there was only a weak association between subjective complaints as measured by KOOS and OA as ascertained by WORMS (Fig. 7).
Fig. 7.
Knee Injury and Osteoarthritis Outcome Score (KOOS) versus Whole Organ Magnetic Resonance Score (WORMS)
Discussion
In the long term, patients experience a worsening of OA after TPF. There is, however, a subset of patients who experience long-term deterioration despite good short-term FU results, whereas other patients’ outcomes remain good. Furthermore, some patients develop post-traumatic bone loss after TPF surgery.
The evolution of TPF treatments is described in Hohl, which includes an extensive annotated bibliography of 1,166 entries.[25] The implant used for TPF stabilisation in this study was produced until 1999; while it was being produced, it was a valuable implant. The implant’s value was proven with standardised FU examinations in 1985 and 1999.[12, 13] The same patients then underwent a second FU examination focusing on the development of OA and post-traumatic bone loss. The limitation of this two-stage-approach is that the available study population was highly selected and relatively small. The methods used to ascertain OA and post-traumatic bone loss were acceptable in 1985, when the previous FU examinations were performed. They are now obsolete; however, they had to be retained for the purpose of comparison. The advantages of this design are explained below.
To compare results at the two time points for each patient, it is essential to use the same examination procedure. This condition was met by the use of SYS and CES. SYS is a valid measure in the sense that it correlates very well with the KOOS, which is a validated instrument. The items on the CES are very similar to the scoring system used by Moore.[26] Comparing SYS and CES values at the first and second FUs, we found that some knees deteriorated in the long run whereas some remained notably the same or even improved. There were patients with no or minimal complaints, even 13–35 years after their injury. After we excluded patients with total knee endoprostheses, we found no deterioration in the remaining sample, which is misleading. We suppose that this finding may explain why some studies that did not address TKA patients or excluded them from further analysis reported that clinical results remained the same.[5, 6, 8] Half of the patients with no or minimal OA at the first FU in our study showed no deterioration of radiological OA at the second FU.
In this study, approximately three of four of the injured knees demonstrated bone loss at both short- and long-term FU. The failure to regain full bone strength may be explained by the fact that muscle strength is frequently not fully restored after the TPF heals. In a series of 63 patients with TPF, Gaston et al. demonstrated that only nine patients (14 %) had normal quadriceps muscle strength 12 months after the accident, which is indirect evidence of bone loss in the affected extremity.[27] Honkonen et al. verified a similar effect at an average of seven years after TPF.[28] It seems a matter of course that stronger muscles create stronger bones. This concept was substantiated in Rikkonen et al.’s study of 979 women: the torque of knee extension was 545 nm in osteoporotic patients, 623 nm in osteopenic patients and 680 nm in normal patients [29]. Another explanation is that a 12-week period of non-weight bearing produces disuse osteoporosis from which patients do not recover. Newer techniques and the development of new materials should facilitate earlier weight bearing [30, 31].
Study limitations
We are aware that the study population with a long-term FU is small and does not adequately represent all types of TPF, especially as there were only four bicondylar fractures and no open fractures. A conclusive analysis of the influencing factors requires a much larger sample. Nevertheless, this study allows statements about the existence of certain phenomena missed in studies with a FU of over ten years, and this information can be valuable when informing patients about the expected outcome and when comparing previous results of FU examinations of the same patients.
Conclusion
Half of the patients with no or minimal OA at the first FU showed no deterioration of radiological OA at the second FU. A novel aspect of this study is the finding that FU examinations at an average of three years after injury do not necessarily predict future clinical and radiological results.
References
- 1.Ender J. Treatment and therapeutic results of tibia head fractures. Archiv fur orthopadische und Unfall-Chirurgie. 1955;47:287–306. doi: 10.1007/BF00416245. [DOI] [PubMed] [Google Scholar]
- 2.Dustmann HO, Schulitz KP. Conservative and operative treatemnt of fractures of the head of tibia (author’s transl) Z Orthop Grenzgeb. 1973;111:160–168. [PubMed] [Google Scholar]
- 3.Manidakis N, Dosani A, Dimitriou R, Stengel D, Matthews S, Giannoudis P. Tibial plateau fractures: functional outcome and incidence of osteoarthritis in 125 cases. Int Orthop. 2010;34:565–570. doi: 10.1007/s00264-009-0790-5. [DOI] [PMC free article] [PubMed] [Google Scholar]
- 4.Mehin R, O’Brien P, Broekhuyse H, Blachut P, Guy P. Endstage arthritis following tibia plateau fractures: average 10-year follow-up. Canadian journal of surgery. Journal canadien de chirurgie. 2012;55:87–94. doi: 10.1503/cjs.003111. [DOI] [PMC free article] [PubMed] [Google Scholar]
- 5.Hohl M. Tibial condylar fractures: long-term follow-up. Texas medicine. 1974;70:46–54. [PubMed] [Google Scholar]
- 6.Lansinger O, Bergman B, Korner L, Andersson GB. Tibial condylar fractures. A twenty-year follow-up. J. Bone Joint Surg Am Vol. 1986;68:13–19. [PubMed] [Google Scholar]
- 7.Rasmussen PS. Tibial condylar fractures as a cause of degenerative arthritis. Acta orthopaedica Scandinavica. 1972;43:566–575. doi: 10.3109/17453677208991279. [DOI] [PubMed] [Google Scholar]
- 8.Rademakers MV, Kerkhoffs GM, Sierevelt IN, Raaymakers EL, Marti RK. Operative treatment of 109 tibial plateau fractures: five- to 27-year follow-up results. J. Orthop. Trauma. 2007;21:5–10. doi: 10.1097/BOT.0b013e31802c5b51. [DOI] [PubMed] [Google Scholar]
- 9.Jarvinen M, Kannus P. Injury of an extremity as a risk factor for the development of osteoporosis. J. Bone Joint Surg Am Vol. 1997;79:263–276. doi: 10.2106/00004623-199702000-00017. [DOI] [PubMed] [Google Scholar]
- 10.Karlsson MK, Josefsson PO, Nordkvist A, Akesson K, Seeman E, Obrant KJ (2000) Bone loss following tibial osteotomy: a model for evaluating post-traumatic osteopenia. Osteoporosis international : a journal established as result of cooperation between the European Foundation for Osteoporosis and the National Osteoporosis Foundation of the USA 11:261–264 [DOI] [PubMed]
- 11.Petersen MM. Bone mineral measurements at the knee using dual photon and dual energy X-ray absorptiometry: Methodological evaluation and clinical studies focusing on adaptive bone remodeling following lower extremity fracture, total knee arthroplasty, and partial versus total meniscectomy. Acta Orthop Scand Suppl. 2000;293:1–37. doi: 10.1080/000164700753767935. [DOI] [PubMed] [Google Scholar]
- 12.Foltin E, Fischmeister MF, Wurdinger W. Die Versorgung der Tibiakopffrakturen mit der Gabelplattenach Streli. Ergebnisse einer Nachuntersuchung von 94 Frakturen bei 92 Patienten. Hefte zur Unfallchirurgie. 1990;212:177–178. [Google Scholar]
- 13.Fischmeister MF, Schneiderbauer A. Die operative Behandlung von proximalen Tibiafrakturen Typ B und C mit der Gabelplatte. Acta Chir Austriaca. 2000;32:14–16. [Google Scholar]
- 14.Streli R (1975) [The fork plate in tibial head fractures]. Hefte zur Unfallheilkunde:253–255 [PubMed]
- 15.Kellgren JH, Lawrence JS. Radiological assessment of osteo-arthrosis. Ann Rheum Dis. 1957;16:494–502. doi: 10.1136/ard.16.4.494. [DOI] [PMC free article] [PubMed] [Google Scholar]
- 16.Singh M, Nagrath AR, Maini PS. Changes in trabecular pattern of the upper end of the femur as an index of osteoporosis. J. Bone Joint Surg Am Vol. 1970;52:457–467. [PubMed] [Google Scholar]
- 17.Jhamaria NL, Lal KB, Udawat M, Banerji P, Kabra SG. The trabecular pattern of the calcaneum as an index of osteoporosis. J. Bone Joint Surg Br Vol. 1983;65:195–198. doi: 10.1302/0301-620X.65B2.6826630. [DOI] [PubMed] [Google Scholar]
- 18.Aggarwal ND, Singh GD, Aggarwal R, Kaur RP, Thapar SP. A survey of osteoporosis using the calcaneum as an index. Int Orthop. 1986;10:147–153. doi: 10.1007/BF00267758. [DOI] [PubMed] [Google Scholar]
- 19.Foltin E. Bone loss and forms of tibial condylar fracture. Arch Orthop Trauma Surg. 1987;106:341–348. doi: 10.1007/BF00456867. [DOI] [PubMed] [Google Scholar]
- 20.Roos EM, Lohmander LS. The Knee injury and Osteoarthritis Outcome Score (KOOS): from joint injury to osteoarthritis. Health Qual Life Outcomes. 2003;1:64. doi: 10.1186/1477-7525-1-64. [DOI] [PMC free article] [PubMed] [Google Scholar]
- 21.Roos EM, Toksvig-Larsen S. Knee injury and Osteoarthritis Outcome Score (KOOS)-validation and comparison to the WOMAC in total knee replacement. Health Qual Life Outcomes. 2003;1:17. doi: 10.1186/1477-7525-1-17. [DOI] [PMC free article] [PubMed] [Google Scholar]
- 22.Paley D, Herzenberg JE. Principles of Deformity Correction. New York: Springer; 2001. [Google Scholar]
- 23.Peterfy CG, Guermazi A, Zaim S, Tirman PF, Miaux Y, White D, Kothari M, Lu Y, Fye K, Zhao S, Genant HK. Whole-Organ Magnetic Resonance Imaging Score (WORMS) of the knee in osteoarthritis. Osteoarthr Cartil. 2004;12:177–190. doi: 10.1016/j.joca.2003.11.003. [DOI] [PubMed] [Google Scholar]
- 24.Bland JM, Altman DG. Cronbach’s alpha. Bmj. 1997;314:572. doi: 10.1136/bmj.314.7080.572. [DOI] [PMC free article] [PubMed] [Google Scholar]
- 25.Hohl M (1997) Tibial plateau fractures. W.B. Saunders in Philadelphia
- 26.Moore TM, Patzakis MJ, Harvey JP. Tibial plateau fractures: definition, demographics, treatment rationale, and long-term results of closed traction management or operative reduction. Journal of orthopaedic trauma. 1987;1:97–119. doi: 10.1097/00005131-198702010-00001. [DOI] [PubMed] [Google Scholar]
- 27.Gaston P, Will EM, Keating JF. Recovery of knee function following fracture of the tibial plateau. J Bone Joint Surg Br. 2005;87:1233–1236. doi: 10.1302/0301-620X.87B9.16276. [DOI] [PubMed] [Google Scholar]
- 28.Honkonen SE, Kannus P, Natri A, Latvala K, Jarvinen MJ. Isokinetic performance of the thigh muscles after tibial plateau fractures. Int Orthop. 1997;21:323–326. doi: 10.1007/s002640050177. [DOI] [PMC free article] [PubMed] [Google Scholar]
- 29.Rikkonen T, Sirola J, Salovaara K, Tuppurainen M, Jurvelin JS, Honkanen R, Kroger H. Muscle strength and body composition are clinical indicators of osteoporosis. Calcif Tissue Int. 2012;91:131–138. doi: 10.1007/s00223-012-9618-1. [DOI] [PubMed] [Google Scholar]
- 30.Ahrens P, Sandmann G, Bauer J, Konig B, Martetschlager F, Muller D, Siebenlist S, Kirchhoff C, Neumaier M, Biberthaler P, Stockle U, Freude T. Balloon osteoplasty–a new technique for reduction and stabilisation of impression fractures in the tibial plateau: a cadaver study and first clinical application. Int Orthop. 2012;36:1937–1940. doi: 10.1007/s00264-012-1592-8. [DOI] [PMC free article] [PubMed] [Google Scholar]
- 31.Yu B, Han K, Ma H, Zhang C, Su J, Zhao J, Li J, Bai Y, Tang H. Treatment of tibial plateau fractures with high strength injectable calcium sulphate. Int Orthop. 2009;33:1127–1133. doi: 10.1007/s00264-008-0611-2. [DOI] [PMC free article] [PubMed] [Google Scholar]


