

Abstract
The adipocytokine leptin is a key mediator of energy homeostasis. Recent papers have suggested that leptin may also have roles in the brain however it is unclear whether leptin is connected to symptoms of mental disorders. In this study, we sought to clarify the relationships between serum leptin level and psychopathology in schizophrenia (SZ) patients. The severity of positive symptoms inversely correlated with the serum leptin levels among SZ patients. There was no correlation between leptin levels and negative symptoms or neurocognition. Our data suggest a role of leptin in SZ positive symptoms.
Keywords: schizophrenia, leptin, cognitive function, positive symptoms, negative symptom, metabolic syndrome
1. Introduction
The adipocytokine leptin is thought to link reduced storage of energy to eating behavior (Ahima 2008). Thus, leptin is important in weight regulation and energy homeostasis. Leptin also activates its receptors in the brain limbic structures and may regulate brain functions beyond the limbic functions (Harvey 2007). However, conflicting results have been published so far on the relationship between cognition and serum leptin level (Gunstad et al. 2008; Holden et al. 2009; Beydoun et al. 2011).
In patients with schizophrenia (SZ) treated with atypical antipsychotic medications, changes of serum leptin level and body weight are reportedly correlated (see reviews, Jin et al. 2008; Sentissi et al. 2008). In addition to these observations, a positive correlation of changes in serum leptin level and improved overall psychopathology was also reported (Atmaca et al. 2003; Atmaca et al. 2007). However, it is unclear whether serum leptin level correlates with specific subdomains of psychopathology, such as positive and negative symptoms, or cognitive performance. We address these questions by estimating the relationships of serum leptin level with severity of illness and psychopathology in SZ patients by using baseline data from the Clinical Antipsychotic Trials in Intervention Effectiveness (CATIE) study. In the present study, we show possible roles of leptin in symptoms of SZ, especially those associated with positive symptoms. We also compare serum leptin levels between patients with antipsychotics and without any antipsychotics prior to the trial, in order to address potential effects of antipsychotics on serum leptin levels.
2. Materials and methods
2.1. The methods of the CATIE study
The CATIE study was to primarily assess the efficacy of atypical antipsychotics under the NIMH funding. The study was conducted between 2001 and 2004 at 57 clinical sites in the United States. Patients were randomly assigned to receive olanzapine, perphenazine, quetiapine, risperidone, or ziprasidone under double-blind conditions and followed for up to 18 months or until treatment was discontinued for any reason. Patients between 18–65 years who received a Diagnostic and Statistical Manual of Mental Disorders Fourth Edition (DSM-IV) diagnosis of SZ, based on the Structured Clinical Interview of the DSM-IV (SCID) were eligible to participate in this study. A wide spectrum of patients with SZ participated in the study, ranging from partially remitted outpatients to exacerbated inpatients. Patients were excluded if they 1) had a diagnosis of schizoaffective disorder, mental retardation, or other cognitive disorders, 2) had a history of severe adverse reaction to the antipsychotics used in the trial, 3) had had only one schizophrenic episode, 4) had a history of treatment resistance, 5) were pregnant or breast-feeding, or 6) had a severe medical condition.
2.2. Study participants
We randomly selected 240 SZ patients from patients who were taking either olanzapine or no antipsychotics (antipsychotic-free) at baseline of the trial by using the STATA software (version 10, “sample” command). The definition of “antipsychotic-free” is that the subjects did not take any antipsychotics at the baseline of the trial, however medications other than antipsychotics (e.g., antidepressants, benzodiazepines, mood stabilizers, and drugs for physical illnesses) could be taken by these patients prior to the trial. Among 240 subjects, the information of neurocognitive measures was not available in 25 participants. Thus, 215 participants were finally used for this study. Table 1 summarizes demographic, clinical and cognitive measures of participants used in this study.
Table 1.
Demographic and clinical variables of the study’s sample
| Included patients | Excluded patients | |||||||||
|---|---|---|---|---|---|---|---|---|---|---|
| Olanzapine group | Antipsychotic free | Statisticsd | Statisticse | |||||||
|
|
||||||||||
| Variables | Mean | SD | Mean | SD | t | p | Mean | SD | t | p |
| Age (years) | 39.5 | 10.8 | 41.4 | 10.2 | −1.3 | 0.181 | 44.2 | 10.8 | −1.73 | 0.085 |
| Patient's education (years) | 12.3 | 1.9 | 12.1 | 2.3 | 0.7 | 0.456 | 12.5 | 2.0 | −0.59 | 0.553 |
| PANSS positive score | 18.6 | 6.2 | 19.1 | 5.6 | −0.7 | 0.507 | 16.2 | 5.1 | 1.78 | 0.076 |
| PANSS negative score | 20.4 | 6.1 | 19.0 | 6.1 | 1.6 | 0.106 | 20.5 | 6.2 | −0.52 | 0.605 |
| Total cholesterol (mg/dl)a | 209.1 | 69.9 | 203.2 | 51.0 | 0.7 | 0.482 | 204.4 | 54.5 | 0.15 | 0.884 |
| HDL cholesterol (mg/dl)b | 39.8 | 13.3 | 44.9 | 15.6 | −2.5 | 0.012 | 45.3 | 12.9 | −1.00 | 0.320 |
| HbA1C (%)c | 5.8 | 1.5 | 5.9 | 1.6 | −0.5 | 0.606 | 5.9 | 1.8 | 0.02 | 0.987 |
| Blood pressure (systolic, mmHg) | 124.4 | 15.3 | 126.1 | 17.9 | −0.7 | 0.459 | 122.0 | 14.9 | 0.81 | 0.419 |
| Blood pressure (diastolic, mmHg) | 79.5 | 10.6 | 80.0 | 11.4 | −0.3 | 0.784 | 76.4 | 8.2 | 1.29 | 0.198 |
| Body mass index | 29.9 | 6.4 | 29.2 | 6.7 | 0.9 | 0.393 | 28.6 | 6.5 | 0.61 | 0.542 |
| Log10leptin | 1.93 | 0.33 | 1.88 | 0.40 | 1.09 | 0.278 | 1.88 | 0.30 | 0.35 | 0.728 |
| Neurocognitive test score | ||||||||||
| Verbal memory | 0.03 | 0.96 | 0.01 | 1.05 | 0.14 | 0.886 | ||||
| Vigilance | 0.07 | 0.97 | 0.11 | 1.11 | −0.24 | 0.812 | ||||
| Processing speed | 0.19 | 0.98 | 0.19 | 1.14 | −0.02 | 0.986 | ||||
| Reasoning | 0.19 | 0.93 | 0.01 | 1.01 | 1.41 | 0.161 | ||||
| Working memory | 0.02 | 0.98 | −0.03 | 1.00 | 0.37 | 0.709 | ||||
| Days between blood collection and clinical evaluation | 10.9 | 8.4 | 12.1 | 10.7 | 0.86 | 0.389 | ||||
| N | % | N | % | X2 | p | N | % | X2 | p | |
|---|---|---|---|---|---|---|---|---|---|---|
| Gender (Male) | 93 | 82 | 80 | 78 | 0.88 | 0.434 | 15 | 60 | 5.53 | 0.036 |
| Race (White) | 78 | 69 | 44 | 43 | 10.63 | 0.001 | 15 | 60 | 0.10 | 0.833 |
| Donated blood at fasting state | 59 | 55 | 42 | 43 | 3.18 | 0.089 | 12 | 48 | 0.20 | 1.000 |
| Total N | 113 | 102 | 25 | |||||||
Unavailable from 2 subjects
Unavailable from 3 subjects
Unavaiable from 42 subjects
olanzapine group vs. antipsychotic-free group
included vs. excluded
2.3. Assessment of psychopathology and cognitive function
Positive and Negative Syndrome Scale (PANSS) was used to evaluate positive and negative symptoms. Cognitive functions assessed in the CATIE subjects have been published (Keefe et al. 2003; Keefe et al. 2006): there were 24 individual scores from 11 neurocognitive tests that were grouped into five domain scores (processing speed, reasoning, verbal memory, working memory, and vigilance). Those domain summary scores were converted to standardized scores which we used in our statistical analyses. On the first day of the trial (i.e., baseline), clinical and neurocognitive measuresh were assessed.
2.4. Laboratory evaluation
Blood samples were collected at screening of the CATIE study. A number of laboratory evaluations, including serum lipids and hemoglobin A1c (HbA1c), were already available. Leptin level was measured by enzyme-linked immunosorbent assay (R&D systems, Minneapolis, USA). Since the distribution of serum leptin level was skewed (skewness = 6.9, kurtosis = 53.8), the logarithmic transformation was used for statistical analyses (log10 leptin).
2.5. Statistical analysis
A series of 7 linear regression analyses was conducted to evaluate the association of serum leptin level and psychopathology, each with standardized sub-domain score of cognitive functions (i.e., verbal memory, vigilance, processing speed, reasoning, and working memory) and PANSS sub components (i.e., positive and negative) as the dependent variables, whereas log10 leptin was entered as the predictor. Repeated analyses were adjusted for age, gender, race, BMI, and olanzapine medication at baseline (Model I). Furthermore, we also tested by adding two more variables: (1) variable of whether or not blood was collected after fasting (defined as longer than 8 hours since last meal) and (2) continuous variable of days between blood collection and clinical evaluation.
We also examined the relationships among log10 leptin and metabolic parameters including body mass index (BMI), total cholesterol, HDL cholesterol, hemoglobin A1C (HbA1C) and diastolic/systolic blood pressure by calculating Spearman’s rho.
All statistical analyses except for randomization were conducted using SPSS version 19. Statistical significance level was set at p<0.05 (two-tailed).
3. Results
3.1. Relationships of leptin with psychopathology and cognitive function
When adjusted for age, gender, race, body mass index, and olanzapine medication at baseline (Model I), log10leptin remain a significant predictor for positive symptoms score (beta = −0.164, p = 0.047). Log10leptin did not predict negative symptoms score (Table 2). This conclusion was unchanged (beta = −0.17, p = 0.045) even after adding two more variables as described in the method section (Model II). Log10leptin did not serve as a significant predictor for other dependent variables (i.e., cognitive domain scores and negative symptoms score) in both models (Table 2). Data before these adjustments are also presented as references in Table 2. The scatter plots of the relationship between log10leptin and positive symptoms are depicted in the olanzapine and antipsychotic-free groups, respectively (Figure).
Table 2.
Results of linear regression analyses with log10leptin level as an independent variable.
| Unadjusted
|
Model 1a
|
Model 2b
|
||||
|---|---|---|---|---|---|---|
| Dependent variables | Beta | p value | Beta | p value | Beta | p value |
|
|
|
|
||||
| Cognitive domains | ||||||
| Verbal memory | 0.142 | 0.038 | 0.255 | 0.348 | ||
| Vigilance | 0.076 | 0.281 | 0.102 | 0.214 | 0.132 | 0.123 |
| Processing speed | 0.088 | 0.199 | 0.041 | 0.527 | 0.047 | 0.564 |
| Reasoning | 0.067 | 0.327 | 0.069 | 0.350 | 0.095 | 0.215 |
| Working memory | 0.048 | 0.486 | 0.042 | 0.588 | 0.050 | 0.536 |
| PANSS score | ||||||
| Negative components | 0.027 | 0.694 | 0.124 | 0.128 | 0.148 | 0.073 |
| Positive components | −0.173 | 0.011 | −0.164 | 0.047 | −0.170 | 0.045 |
Beta = standardized coefficients
Adjusted for age, gender, race, body mass index, and olanzapine monotherapy at baseline
Adjusted for age, gender, race, body mass index, olanzapine monotherapy at baseline, fasting state at blood donation, and days between blood donation and clinical evaluation
Figure.
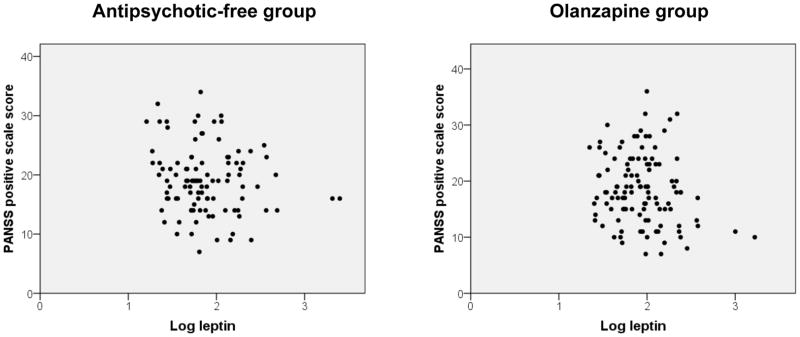
The scatter plots of the relationship between log10leptin and positive symptoms, among antipsychotic-free (left) and olanzapine (right) groups.
3.2. Relationships between leptin serum levels and metabolic parameters
In the correlation analyses, log10leptin positively correlated with BMI (rho = 0.457, p < 0.001). This is consistent with the observations published by others (Jin et al. 2008; Sentissi et al. 2008). Serum HDL cholesterol level was negatively associated with log10leptin (rho = −0.260, p < 0.001), however this correlation was no longer significant when we adjusted for BMI by using linear regression analyses with HDL cholesterol as the dependent and log10 leptin as an independent variable (beta = 0.09, p = 0.20), as was the case in a past study (Marinari et al. 2001). Other metabolic parameters did not reveal any significant correlations with serum leptin (Table 3).
Table 3.
Correlations among leptin and metabolic parameters (Spearman's rho).
| Log10leptin | BMI | Blood pressure (systolic) | Blood pressure (diastolic) | Total Cholesterol | HDL cholesterol | HbA1C | |
|---|---|---|---|---|---|---|---|
| Log10leptin | 1.000 | 0.457** | −0.003 | 0.054 | 0.100 | −0.260** | 0.049 |
| BMI | 1.000 | 0.152* | 0.221** | 0.154* | −0.411** | 0.165* | |
| Blood pressure (systolic) | 1.000 | 0.644** | 0.136* | −0.030 | 0.143 | ||
| Blood pressure (diastolic) | 1.000 | 0.140* | −0.061 | 0.044 | |||
| Total Cholesterol | 1.000 | 0.042 | 0.218** | ||||
| HDL cholesterol | 1.000 | −0.093 | |||||
| HbA1C | 1.000 |
p<0.05,
p<0.01
4. Discussion
The main finding of the present study is that higher serum leptin levels are associated with less severe SZ positive symptoms, but not with cognitive function nor negative symptoms. As far as we are aware, these data are the first evidence that leptin could possibly be associated with positive symptoms of SZ.
Our data of no correlation of negative symptoms and serum leptin levels may look inconsistent with a recent study that reported an inverse association between the change of serum leptin level and the severity of negative symptoms (Venkatasubramanian et al. 2010). We do not think that these two studies are inconsistent: instead differences in the methodology, the study design (i.e., longitudinal vs. cross-sectional), the inclusion criteria, the psychopathology evaluation (SANS/SAPS vs. PANSS), and the statistical methods, may lead to a different conclusion. In particular, the previous study includes only relatively recent onset antipsychotic-naïve SZ patients (mean duration of illness, 3.1 years) whereas we studied subjects with longer duration of illness (the mean years since first administration of antipsychotics, 13.8 years).
We acknowledge limitations of our study, such as lack of a reference group without a diagnosis of SZ, lack information for smoking status and age at onset of SZ (Sacco et al. 2005; Rajji et al. 2009). The inclusion of non-fasting subjects may have confounded our results, although we adjusted for the fasting vs. non-fasting status in the regression models and the correlation of serum leptin levels with positive symptoms shows a strong trend toward significance if we use only fasting patients (p = 0.052). Finally, due to lack of information regarding the dosage and treatment duration with olanzapine prior to the CATIE study, we were unable to address the possible confounding effect due to the magnitude of exposure to olanzapine. Likewise, we had no information regarding the duration of treatment discontinuation among the antipsychotic-free participants.
The inclusion of olanzapine-taking participants for the present study was originally intended with the expectation that the subjects in this group might show higher leptin levels, according to previous publications by others (Jin et al. 2008; Sentissi et al. 2008) and help the study to explore the relationship between leptin level and symptoms of SZ. However, in the present analysis, olanzapine-taking group and antipsychotic-free group had essentially similar demographic and clinical characteristics including serum leptin levels. In previous publications reporting that a positive correlation of changes in serum leptin level and improved overall psychopathology in medicated SZ patients, the authors discussed the improved overall psychopathology possibly to be a secondary outcome of weight gain (Atmaca et al. 2003; Atmaca et al. 2007). In contrast, in the present study we controlled for BMI in the regression models and assume that the association of serum leptin level and positive symptoms is independent of body weight.
Since leptin can modulate mesolimbic dopamine system indirectly (Leinninger et al. 2009) or directly (Hommel et al. 2006) it is possible to hypothesize that the increased serum leptin levels are a part of negative feedback against increased brain dopamine activity associated with SZ positive symptoms. Thus it is important to address how leptin level may affect dopaminergic signaling. Higher leptin level is also associated with insulin resistance (Donahue et al. 1999; Huang et al. 2004), a condition accompanied by hyperinsulinemia. A systematic study addressing relationships of insulin, leptin, and dopamine may also be a significant future subject of investigation.
Acknowledgments
This study is supported by NIH grants (MH 53188 to WWE). AS is supported by NIH grants (MH-084018, MH-094268 Silvio O. Conte center, MH-069853, MH-085226, MH-088753, and MH-092443) and grants from Stanley, RUSK, S-R foundations, NARSAD, and MSCRF. This study was based on results from the Clinical Antipsychotic Trials of Intervention Effectiveness study, supported with Federal funds from the NIMH.
Footnotes
Conflict of interest
None.
References
- Ahima RS. Revisiting leptin's role in obesity and weight loss. J Clin Invest. 2008;118(7):2380–2383. doi: 10.1172/JCI36284. [DOI] [PMC free article] [PubMed] [Google Scholar]
- Atmaca M, Kuloglu M, Tezcan E, Ustundag B. Serum leptin and triglyceride levels in patients on treatment with atypical antipsychotics. J Clin Psychiatry. 2003;64(5):598–604. doi: 10.4088/jcp.v64n0516. [DOI] [PubMed] [Google Scholar]
- Atmaca M, Tezcan E, Ustundag B. Plasma nitric oxide and leptin values in patients with olanzapine-induced weight gain. J Psychiatr Res. 2007;41(1–2):74–79. doi: 10.1016/j.jpsychires.2005.12.003. [DOI] [PubMed] [Google Scholar]
- Beydoun MA, Beydoun HA, Shroff MR, Kitner-Triolo MH, Zonderman AB. Serum leptin, thyroxine and thyroid-stimulating hormone levels interact to affect cognitive function among US adults: evidence from a large representative survey. Neurobiol Aging. 2011 doi: 10.1016/j.neurobiolaging.2011.05.008. [DOI] [PMC free article] [PubMed] [Google Scholar]
- Donahue RP, Prineas RJ, Donahue RD, Zimmet P, Bean JA, De Courten M, Collier G, Goldberg RB, Skyler JS, Schneiderman N. Is fasting leptin associated with insulin resistance among nondiabetic individuals? The Miami Community Health Study. Diabetes Care. 1999;22(7):1092–1096. doi: 10.2337/diacare.22.7.1092. [DOI] [PubMed] [Google Scholar]
- Gunstad J, Spitznagel MB, Keary TA, Glickman E, Alexander T, Karrer J, Stanek K, Reese L, Juvancic-Heltzel J. Serum leptin levels are associated with cognitive function in older adults. Brain Res. 2008;1230:233–236. doi: 10.1016/j.brainres.2008.07.045. [DOI] [PubMed] [Google Scholar]
- Harvey J. Leptin regulation of neuronal excitability and cognitive function. Curr Opin Pharmacol. 2007;7(6):643–647. doi: 10.1016/j.coph.2007.10.006. [DOI] [PMC free article] [PubMed] [Google Scholar]
- Holden KF, Lindquist K, Tylavsky FA, Rosano C, Harris TB, Yaffe K Health ABC study. Serum leptin level and cognition in the elderly: Findings from the Health ABC Study. Neurobiol Aging. 2009;30(9):1483–1489. doi: 10.1016/j.neurobiolaging.2007.11.024. [DOI] [PMC free article] [PubMed] [Google Scholar]
- Hommel JD, Trinko R, Sears RM, Georgescu D, Liu ZW, Gao XB, Thurmon JJ, Marinelli M, DiLeone RJ. Leptin receptor signaling in midbrain dopamine neurons regulates feeding. Neuron. 2006;51(6):801–810. doi: 10.1016/j.neuron.2006.08.023. [DOI] [PubMed] [Google Scholar]
- Huang KC, Lin RC, Kormas N, Lee LT, Chen CY, Gill TP, Caterson ID. Plasma leptin is associated with insulin resistance independent of age, body mass index, fat mass, lipids, and pubertal development in nondiabetic adolescents. Int J Obes Relat Metab Disord. 2004;28(4):470–475. doi: 10.1038/sj.ijo.0802531. [DOI] [PubMed] [Google Scholar]
- Jin H, Meyer JM, Mudaliar S, Jeste DV. Impact of atypical antipsychotic therapy on leptin, ghrelin, and adiponectin. Schizophr Res. 2008;100(1–3):70–85. doi: 10.1016/j.schres.2007.11.026. [DOI] [PMC free article] [PubMed] [Google Scholar]
- Keefe RS, Bilder RM, Harvey PD, Davis SM, Palmer BW, Gold JM, Meltzer HY, Green MF, Miller DD, Canive JM, Adler LW, Manschreck TC, Swartz M, Rosenheck R, Perkins DO, Walker TM, Stroup TS, McEvoy JP, Lieberman JA. Baseline neurocognitive deficits in the CATIE schizophrenia trial. Neuropsychopharmacology. 2006;31(9):2033–2046. doi: 10.1038/sj.npp.1301072. [DOI] [PubMed] [Google Scholar]
- Keefe RS, Mohs RC, Bilder RM, Harvey PD, Green MF, Meltzer HY, Gold JM, Sano M. Neurocognitive assessment in the Clinical Antipsychotic Trials of Intervention Effectiveness (CATIE) project schizophrenia trial: development, methodology, and rationale. Schizophr Bull. 2003;29(1):45–55. doi: 10.1093/oxfordjournals.schbul.a006990. [DOI] [PubMed] [Google Scholar]
- Leinninger GM, Jo YH, Leshan RL, Louis GW, Yang H, Barrera JG, Wilson H, Opland DM, Faouzi MA, Gong Y, Jones JC, Rhodes CJ, Chua S, Jr, Diano S, Horvath TL, Seeley RJ, Becker JB, Munzberg H, Myers MG., Jr Leptin acts via leptin receptor-expressing lateral hypothalamic neurons to modulate the mesolimbic dopamine system and suppress feeding. Cell Metab. 2009;10(2):89–98. doi: 10.1016/j.cmet.2009.06.011. [DOI] [PMC free article] [PubMed] [Google Scholar]
- Marinari GM, Scopinaro N, Adami GF. Leptin and HDL-cholesterol in non-diabetic normotensive subjects. Obes Surg. 2001;11(3):252–253. doi: 10.1381/096089201321336539. [DOI] [PubMed] [Google Scholar]
- Rajji TK, Ismail Z, Mulsant BH. Age at onset and cognition in schizophrenia: meta-analysis. Br J Psychiatry. 2009;195(4):286–293. doi: 10.1192/bjp.bp.108.060723. [DOI] [PubMed] [Google Scholar]
- Sacco KA, Termine A, Seyal A, Dudas MM, Vessicchio JC, Krishnan-Sarin S, Jatlow PI, Wexler BE, George TP. Effects of cigarette smoking on spatial working memory and attentional deficits in schizophrenia: involvement of nicotinic receptor mechanisms. Arch Gen Psychiatry. 2005;62(6):649–659. doi: 10.1001/archpsyc.62.6.649. [DOI] [PubMed] [Google Scholar]
- Sentissi O, Epelbaum J, Olie JP, Poirier MF. Leptin and ghrelin levels in patients with schizophrenia during different antipsychotics treatment: a review. Schizophr Bull. 2008;34(6):1189–1199. doi: 10.1093/schbul/sbm141. [DOI] [PMC free article] [PubMed] [Google Scholar]
- Stroup TS, McEvoy JP, Swartz MS, Byerly MJ, Glick ID, Canive JM, McGee MF, Simpson GM, Stevens MC, Lieberman JA. The National Institute of Mental Health Clinical Antipsychotic Trials of Intervention Effectiveness (CATIE) project: schizophrenia trial design and protocol development. Schizophr Bull. 2003;29(1):15–31. doi: 10.1093/oxfordjournals.schbul.a006986. [DOI] [PubMed] [Google Scholar]
- Venkatasubramanian G, Chittiprol S, Neelakantachar N, Shetty TK, Gangadhar BN. A longitudinal study on the impact of antipsychotic treatment on serum leptin in schizophrenia. Clin Neuropharmacol. 2010;33(6):288–292. doi: 10.1097/WNF.0b013e3181fa2a6f. [DOI] [PubMed] [Google Scholar]