

Abstract
A major goal in natural product discovery programs is to rapidly dereplicate known entities from complex biological extracts. We demonstrate here that molecular networking, an approach that organizes MS/MS data based on chemical similarity, is a powerful complement to traditional dereplication strategies. Successful dereplication with molecular networks requires MS/MS spectra of the natural product mixture along with MS/MS spectra of known standards, synthetic compounds, or well-characterized organisms, preferably organized into robust databases. This approach can accommodate different ionization platforms, enabling cross correlations of MS/MS data from ambient ionization, direct infusion, and LC-based methods. Molecular networking not only dereplicates known molecules from complex mixtures, it also captures related analogs, a challenge for many other dereplication strategies. To illustrate its utility as a dereplication tool, we apply mass spectrometry-based molecular networking to a diverse array of marine and terrestrial microbial samples, illustrating the dereplication of 58 molecules including analogs.
Natural products (NPs) are produced by various life forms as specialized metabolites that control cellular processes and drive biology.1 They are also some of the most prolific sources of therapeutics.2 Despite the overwhelming number of NPs and NP derivatives approved by the FDA, the majority of the pharmaceutical industry has reduced their reliance on NP-based drug discovery programs, in part due to the costs behind high rates of rediscovery in the late stages of the isolation process. However, academic and other scientists continue to explore the natural world for molecules with interesting chemistries, for they are the drivers of biology and are important to biotechnology, biofuels, agriculture, and medicine.1
Dereplication, or the identification of known molecules, early in the NP workflow minimizes time, effort, and cost.3 Current dereplication strategies include hyphenated techniques, such as HPLC-MS, HPLC-NMR, HPLC-NMR-MS, and HPLC-SPE-NMR,4-6 or bioactivity fingerprints, such as cytological profiling or BioMAP.7,8 The common denominator of these strategies is the attempt to exploit the fact that structurally similar or identical molecules share similar physical characteristics, such as UV-vis profiles, chromatographic retention times, MS, NMR chemical shifts, or biological properties. However, even when multiple characteristics are experimentally verified, a full elucidation either occurs late in the workflow or otherwise remains elusive. Hence, alternative and orthogonal dereplication strategies need to be developed.
Mass spectrometry based dereplication is critical to modern natural product dereplication pipelines, the processes of characterizing natural products via an established infrastructure of structural analyses to identify known molecules.9-13 MS is more sensitive than NMR, however, it is often difficult to reliably dereplicate a given compound when solely using precursor or parent masses because of the sheer number of results returned when searching databases such as AntiBase,14 MarinLit,15 Beilstein Dictionary of Natural Products,16 and SciFinder. However, MS/MS fragmentation has yet to be routinely exploited in NP dereplication. In principle, MS/MS data are definitive characteristics of a molecule, and thus could be effectively used in dereplication. The underlying assumption of MS together with MS/MS-based dereplication is that structural architecture, chemical stability, and functional groups combine to dictate reactivity by collision-induced dissociation in the gas phase, and therefore, similarities in MS/MS fragmentation patterns can be used as proxies for chemical similarity. Thus, these MS/MS patterns are more discriminatory than parent mass alone. Because natural product workflows typically incorporate LC-MS analysis, and MS/MS data can be simultaneously acquired on most mass spectrometers, introduction of molecular networking does not require significant adjustment of the current NP discovery process. Here we present molecular networking as a complement to current dereplication strategies.
Mass spectrometry-based molecular networking relies on the observation that structurally similar molecules share similar MS/MS fragmentation patterns. Molecular networking is implemented in three fundamental steps (Figure 1). First, MS/MS spectra are collected. Second, a molecular network is generated using ‘cosine scores’ which measure relatedness in MS/MS spectra and can be visualized using Cytoscape, a tool designed to visualize correlations of large datasets.17-20 Finally, the molecular network is analyzed as described in Figure 2. Thus, a molecular network is a visual representation of molecular relatedness (chemical similarity) of any given set of compounds.
Figure 1. Three steps to implement molecular networking for dereplication.

Experimental MS/MS spectra of samples, which can be of a high degree of complexity and heterogeneity, and MS/MS spectra of known molecules, dubbed “seed” spectra, are analyzed on a 64-bit Linux system. The resultant network is visualized in Cytoscape where one node represents one consensus MS/MS spectrum and is labeled with the precursor mass, and an edge represents relatedness, where edge thickness indicates cosine similarity.
Figure 2. Validation of nodes and annotation of MS/MS spectra.

Using the carmabin A “seed” as a starting node, molecular networking revealed that carmabin A was present in two different cyanobacterial collections (also in Figure 3). In the same cluster, there were three additional nodes of two precursor masses, m/z 645.0 and 705.1. Putative assignment of modifications based on the precursor mass difference – sodium, potassium, alkylated, halogenated, oxidized, etc. – and mass differences between peaks in the MS/MS spectra also provide insight to the structures of the related NPs. Manual inspection of the carmabin A MS/MS spectrum showed a sequence tag consistent with b-type ions. Inspection of the MS/MS spectra of the connected nodes, m/z 645.0 and 705.1, matched to known lipopeptides in the same molecular family as carmabin A, but with differing lengths and degrees of unsaturation of the lipophilic tail. With one seed, carmabin A, molecular networking was able to dereplicate carmabin A and two MS/MS spectra that match to the structurally related analogs, carmabin B and dragomabin.
Because structurally similar NPs share similar MS/MS fragmentation patterns, molecular families tend to cluster together within a network.17 These networks then allow for the simultaneous visual exploration of identical molecules, analogs, or compound families, within single or multiple datasets and from a wide variety of biological sources.17,18 Within the network, one node corresponds to one consensus MS/MS spectrum, a mathematical merging of MS/MS spectra with nearly identical precursor mass and peak patterns, and is typically labeled with the precursor mass. Edges (lines) connect nodes with related consensus MS/MS spectra. In the networks depicted in this manuscript, we have added node and edge attributes so that the color of the node corresponds to the origin of the sample and the thickness of the edge reflects the similarity as defined by the cosine score.
In the current study, we generated two networks of MS/MS data from phylogenetically distinct sample sets to demonstrate how molecular networking can be used to dereplicate known compounds and identify close analogs. One network contained LC-MS/MS spectra of fractionated extracts and purified NPs from cyanobacterial collections. The other network combined MS/MS spectra from direct analysis of microbial colonies using ambient ionization nanoDESI18 and direct infusion nanoESI of purified NPs and extracts of well-studied bacteria. The MS/MS data of purified NPs act as “seed” spectra, which serve as the initial focal points in the network when processed with the MS/MS spectra from a mixture of unknown compounds. Implementation of molecular networking to six cyanobacterial collections and eight bacterial strains resulted in the concurrent dereplication of four NPs and 38 possible analogs, and eight NPs and eight analogs, respectively, encompassing NPs of different structural classes, such as polyketides, alkaloids, and peptides. The identification of known molecules is most rapid when standards are included, but the utility of molecular networking does not depend on inclusion of a database. Networking identifies potential analogs and guides the user to molecules that may be unknown, thereby decreasing the time to the decision as to pursue or not pursue the isolation of individual metabolites.
RESULTS
The cyanobacterial network contained MS/MS data from six different marine collections (Figure 3) and five pure NPs which had been previously characterized by NMR, UV-vis, HRMS and comparison to MarinLit and/or chromatographic retention times.15 The bacterial network (Figure 4) was generated from direct infusion of extracts or direct sampling via nanoDESI18 of eight bacterial strains from three phyla (Firmicutes, Actinobacteria, and Proteobacteria), 13 NP standard samples, and 104,228 MS/MS spectra from five metabolomics databases. However, the actual number of unique compounds in these databases is much less as there are multiple spectra for many compounds. In the networks, each cyanobacterial collection or bacterial strain is represented by a different color; overlapping experimental nodes with data from more than one organism are grey circles, nodes that are a consensus of experimental and seed spectra are dark green squares, and seed nodes that do not overlap with experimental data are light green triangles. The dereplicated nodes were manually inspected and MS/MS fragmentation patterns were annotated to verify that the fragmentation patterns were related (Supporting Information).
Figure 3. Cyanobacterial network with a cosine similarity score cut off of 0.65.


This network was generated when extracts of cyanobacteria (six distinct collections) were separated into nine fractions based on polarity and then analyzed via LC-MS/MS with five known compounds. The inlaid portions of the network were rearranged in Cytoscape for easier visualization of node connectivity. Italicized labels indicate putative assignments. A. Standard “seed” spectra of carmabin A overlapped with three different cyanobacterial collections (bold outlined dark green squares). Additionally carmabin B and dragomabin were identified from the same collection and two different genera, respectively. B. A cluster of nodes from a collection of Moorea bouillonii, a known producer of the lyngbyabellins, was highly suggestive of lyngbyabellin A and potential novel analogs, including a monochlorinated species. The presence of M+2 nodes within this cluster provided further evidence for these analogs. C. Tumonoic acid I clustered closely with novel analogs present in both the crude cyanobacterial sample and the pure seed compound. D. Barbamide and the recently described 4-O-demethylbarbamide analog were present in multiple cyanobacterial samples. Additionally, a dimethyl analog was present in two samples. E. Carmaphycins A and B were included in the network, but only carmaphycin B was in one Schizothrix sp. collection. Also, the precursor ion of a putative non-oxygenated methionine analog clustered closely, as well as an analog with a precursor mass of m/z 511. F. A cluster of nodes from Moorea bouillonii, a known producer of the apratoxins, putatively contained five known and 13 novel apratoxin analogs.
Figure 4. Bacterial network with a cosine similarity score cut off of 0.65.


This network was generated from direct infusion of extracts or direct nanoDESI-MS/MS sampling of 8 bacteria, 14 known compounds,and 5 databases.The inlaid portions of the network were rearranged in Cytoscape for easier visualization of node connectivity and annotation.Italicized labels indicate putative assignments. A. 2-Heptyl-4-quinolone (HHQ) and Pseudomonas quinolone signal (PQS) fragment similarly. The structures of the connected database nodes do contain conjugated cyclic moieties, but are not of the same molecular family as HHQ and PQS. B. Small molecules m/z <350 in the condensed cluster. Commercial Pseudomonas aeruginosa molecules pyocyanin and methoxyphenazine overlap with sample spectra, whereas N-methylphenazine does not. Phenazine fragments differently. S. marcescens sp. ES129 yields a node with a precursor mass that matches to prodigiosin, which is supported by comparison of the MS/MS sample spectra to published spectra. C. MS/MS spectra of abyssomicins (Aby) B, C, D, H, and L purified from Verrucosispora sp. MS100128 and proximicin B isolated from sp. SRM7 were incorporated into the bacterial network. Aby B and H “seed” spectra overlapped with data directly sampled from Verrucosispora sp. VM37 (bold outlined dark green squares). Aby C, D, and L were incorporated into the network, but do not match to sample data (bold outline light green triangles). Aby J and proximicin B were not incorporated into the network. D. The surfactins (Srf) 1+ cluster includes protonated (H), sodiated (Na), and potassiated (K) forms of surfactinC13-15. Protonated precursor nodes are labeled with bold solid outlines. This cluster reveals nodes for precursor mass m/z 994.6, 14 less than Srf-C13, suggesting the presence of a C12 surfactin and was instrumental in dereplication of the bioactive molecule/s from Dietzia sp. FI-1026 (cyan). E. Putatively assigned surfactin 2+ cluster.
Molecular networking of the cyanobacterial data resulted in dereplication of carmabin A,21tumonoic acid I,22 barbamide,23 and carmaphycin B;24 interestingly, carmaphycin A was not present in the network. Carmabin A was present in fractions of a Moorea sp. extract (Figure 2) and the cluster of nodes around carmabin A included precursor masses and corresponding MS/MS spectra (Figure S2, Supporting Information) that agreed with the analogs carmabin B and dragomabin.25
A cluster of six dark green square nodes revealed that a mixed collection of two cyanobacteria, Lyngbya sp. and Schizothrix sp. from Papua New Guinea, contained tumonoic acid I (Figure 3C).22 This cluster suggested the presence of five analogs within the seed LC-MS/MS run for tumonoic acid I, which was supported by MS/MS spectra and extracted ion chromatograms (EICs) (Figure S4, Supporting Information).
From the network, it was determined that barbamide, with its characteristic complex chlorine isotope pattern, was present in multiple collections (Figures 3D and S5, Supporting Information).23 In addition to this “seed,” the recently described 4-O-demethylbarbamide along with its chlorine isotope pattern were also present,26 as well as a putative analog of barbamide. The MS/MS fragmentation pattern for 4-O-demethylbarbamide contained an intact y ion, thus supporting its assignment. The MS/MS spectrum for the putative barbamide analog contained b and y ions consistent with dechlorobarbamide.27
Carmaphycin B and two nodes suggestive of novel carmaphycin analogs were dereplicated from the cyanobacterial network.24 Carmaphycin B was present in the crude sample from one collection from Panama, confirmed by matching MS/MS fragmentation patterns and retention times. The two novel carmaphycin analogs, one consistent with a non-oxidized methionine analog and a second with an m/z 511, were supported by the presence of b and y ions in the MS/MS spectra (Figure S6, Supporting Information). These predictions are being pursued with a full structure elucidation of each following isolation and NMR analysis.
The cyanobacterial network also contained two clusters from Moorea bouillonii that contain precursor masses that correspond to known lyngbyabellins and apratoxins. M. bouillonii is well known to produce both lyngbyabellins and apratoxins, and these clusters could be identified based on MS/MS fragmentation, precursor masses, and isotopic patterns despite the lack of seed spectra for dereplication. The lyngbyabellin A28 cluster had masses, which suggested novel analogs including a rare monochlorinated species, a deoxygenated species, a demethylated species, a demethylated and deoxygenated species, and a methylated species. Additionally, the precursor masses for these analogs had distinct isotopic patterns characteristic of chlorinated species, thus providing orthogonal evidence for the presence of lyngbyabellin analogs in this cyanobacterial sample. The other cluster contained 67 nodes and likely contained apratoxins A and B29,30 as well as precursor masses suggestive of the analogs apratoxins D,31 E,32 F, and G33 (Figure S7, Supporting Information). However, the molecular formulas of these compounds could not be definitively assigned due to high ppm error values and the lack of standard MS/MS spectra.
In the bacterial and database network, molecular networking enabled the dereplication of polycyclic polyketide-type antibiotics termed abyssomicins,34-36 phenazines,37 quinolones,38 and surfactin lipopeptides.39 MS/MS spectra of two of the NMR-pure abyssomicin standards formed consensus nodes from data directly collected from Verrucosispora sp. MS100128, thereby dereplicating abyssomicins B and H as well as revealing abyssomicin H (+OH) as previously described36 (Figures 4C and S11, Supporting Information). Nodes for abyssomicins C, D, and L were also present in the network, but these nodes originated from standards and were not present in the sample. Similarly, the node corresponding to proximicin B, previously determined to be produced by Verrucosispora sp. SRM7, was present in the network but did not match or connect to any experimental SRM7 node.40
Molecular networking analysis of data-independent nanoDESI-MS/MS of Pseudomonas aeruginosa PAO1 and PA1441 with five reference spectra – hydroxyphenazine, methoxyphenazine, N-methylphenazine, Pseudomonas quinolone signal (PQS), and pyocyanin – resulted in dereplication of methoxyphenazine,41 pyocyanin, PQS, a reduced pyocyanin analog, phenazine, and 2-heptyl-4-quinolone (HHQ). Pyocyanin (m/z 211 [M+H]+) was immediately linked to a putative analog 2 amu higher, corresponding to a reduced analog. PQS exhibited a perfect match between experimental and reference data, resulting in an overlapping node. Nodes corresponding to methoxyphenazine and N-methoxyphenazine were also present in this cluster (Figure 4B).
Molecular networking dereplicated prodigiosin from Serratia marcescens sp. Environmental Strain 129 (Lab Environmental Strain Collection), without a “seed” spectrum or a full characterization of the organism. S. marcescens sp. ES129 was isolated from soil, produced a red pigment, and was sampled directly via nanoDESI.18S. marcescens strains are known to produce the red-pigmented antibiotic prodigiosin (m/z 323.1997 calcd), a tripyrrole alkaloid, which has a published MS/MS spectrum.42 Comparison of the sample MS/MS spectrum to the published verified that the fragmentation patterns matched. Thus, m/z 324 from S. marcescens sp. ES129 matches to prodigiosin.
Nodes from Dietzia sp. FI-1026 extracts clustered with nodes from B. subtilis and surfactin MS/MS datasets in two clusters that were assigned to singly charged and doubly charged surfactin (Figure 4E and F, respectively). The consensus nodes (dark green squares) in both clusters contained MS/MS spectra from all three sources, and contained protonated as well as sodium and potassium adducts of surfactins C13-15. The cluster for singly charged surfactin (Figure 4E) revealed nodes with a precursor mass m/z 994.6, a difference of 14 amu less than surfactin-C13, suggesting the presence of a surfactin-C12.
DISCUSSION
Mass spectrometry-based molecular networking is a useful tool when applied to cyanobacterial and bacterial MS/MS datasets. In the current study it was used to dereplicate 58 molecules including analogs. Three advantages of molecular networking as a dereplication strategy are highlighted here. First, it allows for the simultaneous identification of known NPs and analogs from complex mixtures. Second, molecular networking is compatible with any mass spectrometry ionization platform. And lastly, molecular networking is easily incorporated into standard NP discovery workflows.
Molecular networking based dereplication can be used to match identical as well as related molecules, an asset that was quite apparent with the cyanobacterial examples. The carmabin A consensus node clustered tightly with four other nodes (Figures 2 and 3A). The carmabin A node was found in one Moorea sp. sample. This node strongly clustered with m/z 705.1 and 645.0, found in the same cyanobacterial sample; m/z 705.1 was also found in a collection of Schizothrix sp. After examination of the MS/MS spectra and comparison to the seed NP, these compounds were dereplicated as carmabin B and dragomabin, respectively. Thus, one identical match in the network resulted in the dereplication of two additional NPs.
In the case of carmaphycin, the network contained a node for carmaphycin B from a collection of Schizothrix sp. when both A and B were used as seeds. Moreover, there were nodes for previously uncharacterized carmaphycin analogs of m/z 499.9 and 511.0. Inspection of the MS/MS spectra revealed an intact b ion for both analogs suggesting the valine and lipid chain were intact. For m/z 499.9, the mass difference and corresponding y ion suggested the presence of a non-oxidized methionine residue, while the modification for m/z 511.0 is uncertain and would require a full structure elucidation via NMR to identify the location and modified moiety.
Tumonoic acid I was dereplicated from a mixed Schizothrix sp. and Lyngbya sp. collection by retention time comparison with a verified standard in addition to examination of the MS/MS spectra. Novel tumonoic acid analogs were present in the collection as well as the seed sample. EICs for the seed suggested that the analogs were present in low concentration, as their UV signal/s was/were not detected in the chromatogram. This result highlights the exceptional sensitivity of mass spectrometry and molecular networking which thus allows for the identification of even very low abundance NPs.
The molecular networking approach depends on the existence of related fragmentation patterns from natural products. The limitations of this approach reflect the limitations inherent to mass spectrometry, ranging from a limited number of fragment ions and the ability to ionize molecules to the inability or difficulty to determine stereochemistry and regiochemistry. As molecular weight decreases, the number of possible fragments from a molecule decreases, resulting in similar MS/MS spectra for lower molecular weight molecules. Molecular networking, as implemented in this work, does not include a spectrum quality filter or score, nor is there an all-encompassing data conversion program to account for differences in vendor-specific MS/MS data. Hence, spectra with a high signal to noise ratio, or spectra with single intense ions are included in molecular networks, typically in the condensed clusters. Careful neighborhood analysis in the condensed clusters still reveals related molecules.
Additional tools and information that mass spectrometry provides can also be incorporated, but has not been done at this time. For example, the mass defect analysis of the parent masses between two nodes can be utilized for analog identification when matched to known modifications. If both nodes are unknown, the mass defect analysis can be propagated to other connected nodes until a known node is reached. Then confirmation of the putatively assigned structures relies on manual annotation of MS/MS spectra in addition to orthogonal analytical methods. Despite these mass spectrometry caveats, molecular networking is relevant to NP dereplication and has wide utility. Any mass spectrometry ionization platform is compatible with molecular networking at multiple stages of the workflow (Figure 5), as long as MS/MS spectra are acquired with similar methods of fragmentation43 (thermal activation, such as collision-induced dissociation (CID),44 higher energy collision dissociation (HCD),45 and infrared multiphoton dissociation (IRMPD);46 non-endergonic fragmentation, such as electron transfer dissociation (ETD)47 and electron capture dissociation (ECD);48 chemical ionization (CI) induced fragmentation49), polarity (positive versus negative mode), and collision energies. Advances in ionization methods in mass spectrometry, including ambient ionization, remove the time and labor for sample work-up,50,51 allowing for implementation of molecular networking at early stages of natural product discovery.17,18,37 A variety of ionization sources, such as ESI, nanoDESI, and direct infusion nanoESI, were used to generate the MS/MS spectra that were networked together in this study. The utility of molecular networking extends to low molecular weight molecules, such as less than m/z 400 as exemplified by the phenazines and quinolones produced by Pseudomonas aeruginosa (Figures 4A and B). These NPs have been implicated in virulence and competitive fitness.52 For example, methoxyphenazine and N-methylphenazine appeared to fragment differently from phenazine when manually inspected (Figure S10, Supporting Information). Their nodes were still found in the same region of the network, indicating an underlying fragmentation similarity between these compounds (Figure 4B). Although we do not know the limit of MS/MS spectra that can be included in a network, we hypothesize that including more MS/MS data in a network will improve the quality of the networking.
Figure 5.
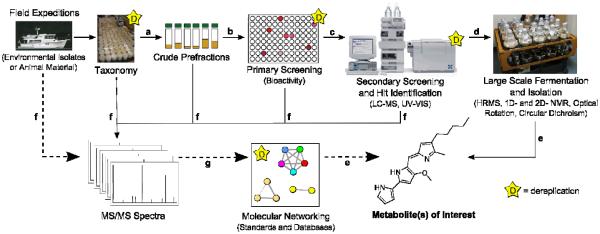
Molecular networking can be easily implemented in traditional natural product workflows.
Molecular networking was used to dereplicate abyssomicins B and H, two members of a newer class of polyketide antibiotics. There was no node for abyssomicin J; the proposed structure of abyssomicin J consists of a dimer of abyssomicin K connected by a thioether. Abyssomicins C, D, and L nodes were present as seed nodes only. Abyssomicin C is one of a handful of new potential antibiotics with activity against gram-positive bacteria such as methicillin-resistant Staphylococcus aureus (MRSA) and vancomycin-resistant S. aureus (VRSA) through inhibition of p-aminobenzoate (pABA) biosynthesis.34 Thus, identification of analogs via molecular networking may lead to more candidate antibiotics.
The incorporation of seed spectra is not necessary for molecular networking to be useful. In the cyanobacterial network, there were no seed spectra for the lyngbyabellins or apratoxins, yet these two well-known compound families formed two distinct clusters and were identified. Detection of new analogs in these compound families will be helpful for developing an understanding of structure-activity relationships (SAR).
Molecular networking can be easily integrated into existing NP workflows to provide useful guidance in the discovery of new bioactive substances. To highlight one example, fractionated extracts of cultivated Dietzia sp. FI-1026, originally isolated from fish intestines,53 were previously screened against 15 bacterial strains via BioMAP analysis.8 The BioMAP profile clustered to valinomycin and cytological profiling using HeLa cells showed cell death (Supporting Information). The MS/MS spectra of these extracts were included in the bacterial network and clustered with surfactin and B. subtilis (Figure 4D and E). The presence of FI-1026 nodes in both the singly charged and doubly charged surfactin clusters increased confidence that the bioactive component of the FI-1026 samples was surfactin. Because this is a well-studied molecule, it was likely introduced as a contaminant during the preparation of the sample. Hence, the fractions from this particular experiment were eliminated from further analysis.
At a cosine score cutoff of 0.65, the bacterial and database network (Figure 4) contained 1,948 total nodes, of which 296 (15.2%) were database MS/MS nodes or overlapping nodes with a database MS/MS spectrum. Most of these database nodes were less than m/z 400 and were located in the condensed cluster, the portion of the network concentrated with nodes and edges. A majority of these nodes 276 (14.2%) were nodes with MS/MS spectra from databases only, three were nodes (0.15%) for consensus between a database and standard, and 17 (0.87%) were nodes for consensus between a database and a bacterial sample. Of the 17 consensus nodes of interest, none were able to be dereplicated, highlighting the need for an integrated use of relevant MS/MS libraries, databases, and de novo structure elucidations.
Developing relevant MS/MS libraries for microorganisms will significantly benefit NP drug discovery efforts by improving the results of the dereplication strategy presented herein. In the next few years, we aim to create an open access database of MS/MS spectra of known molecules, with data repository and search functionality for public use. Once data are collected and deposited, there will be less need for others to repeat data collection for that sample, saving time and resources. As this collection grows, the database will become more useful, and may transform first pass natural product analysis in a fashion similar to that of gene annotations in GenBank.54,55
There are many conceivable creative applications of molecular networking, such as taxonomic dereplication of mixed samples in parallel to metagenomics studies,56 inclusion of genealogy to successfully dereplicate molecules, SAR and biosynthetic pathway prediction studies, and the creation of an all-encompassing database for metabolomics studies of host-pathogen systems as diagnostic tools for human health.
In conclusion, molecular MS/MS networking is an alternative approach that can be used for dereplication. The workflow can be incorporated at any stage of a natural product discovery program. Additionally, it is compatible with workflows currently in use in many natural product laboratories that use MS to characterize their samples by acquiring MS/MS at the same time. This will be useful to capture a wide range of structural classes and analogs even when the retention times are very different or if different ionization platforms are used; the only requirement is to obtain MS/MS. Molecular networking should find utility in efficiently dereplicating mixtures and pure compounds alike, especially for finding related analogs in our efforts to gain insight into the functional roles of these fascinating specialized metabolites.
Experimental Section
Bacteria
Bacteria (Pseudomonas aeruginosa PAO1 and PA14, Serratia marcescens sp. ES129, Verrucosispora sp. MS100128 and SRM7) were sampled directly from colonies grown on agar media via nanoDESI using a modified Prosolia Omnispray DESI source coupled to a 6.42 T Thermo LTQ-FT-ICR mass spectrometer.18,41 Additional bacteria (Bacillus subtilis 3610 and PY79 and Dietzia sp. FI-1026) were extracted then directly infused into the mass spectrometer using a Triversa nanomate-electrospray ionization source (Advion Biosystems) coupled to a 6.42 T Thermo LTQ-FT-ICR mass spectrometer. Strain-specific growth conditions are described in the Supporting Information. For nanomate, samples were diluted in 50:50 MeOH:H2O and then directly infused using a back pressure of 0.35-0.5 psi and a spray voltage of 1.3-1.45 kV. FT-MS and ion trap MS/MS spectra were acquired using Tune Plus software version 1.0 and Xcalibur software version 1.4 SR1. The instrument was tuned on m/z 816, the 15+ charge state of cytochrome C. The instrument scan cycle consisted of one 10 min segment, during which a profile FT scan with a resolution of 25,000 was cycled with four data-dependent scans in the ion trap. The data-dependent scan iteratively cycled through the top four most intense ions from the FT scan, after which they were placed on an exclusion list for 600 s. Purified compounds, hydroxyphenazine, methoxyphenazine, N-methylphenazine, PQS (pseudomonas quinolone signal), pyocyanin, abyssomicins B, C, D, H, J, and L, proximicin B, and commercially available surfactin from B. subtilis (Sigma S3523), were also directly infused into the mass spectrometer. MS/MS data were collected in a data dependent manner, during which profile mode FT-MS scans cycled with five MS/MS scans in the ion trap. The five most abundant peaks were fragmented and then added to an exclusion list. Data were acquired for 10 min.
Cyanobacteria
Moorea bouilloni PNG05-198 (GenBank collection number FJ041298, containing apratoxins A and B as well as lyngbyabellin A) and a mixture of Lyngbya sp. and Schizothrix sp. (containing tumonoic acid I) were collected from Papua New Guinea, while a red filamentous cyanobacterium (containing barbamide), a red Moorea sp. (containing carmabin A), and a brown Schizothrix (containing carmaphycin B) were collected from Panamá. Specific collection information is described in the Supporting Information. Each of the five cyanobacterial collections was extracted with 2:1 CH2Cl2/MeOH, fractionated into nine sub-fractions using silica gel Vacuum Liquid Chromatography (VLC) (hexane, EtOAc, MeOH). VLC fractions were analyzed via LC-MS/MS on a Thermo Finnigan Surveyor Autosampler-Plus/LC-Pump-Plus/PDA-Plus system coupled to a Thermo Finnigan LCQ Advantage Max mass spectrometer fitted with a Phenomenex Kinetex C-18 100 Å 100 × 4.60 mm column, using a flow rate of 700 μL/min and a linear gradient from 50% B (A: 0.1% HCO2H in water, B: CH3CN) to 100% B over 25 min. The divert valve was set to waste for the first 2.5 min. ESI conditions were set with the capillary temperature at 325 °C, source voltage at 5 kV, and a sheath gas flow rate of 69 L/min. There were four scan events: positive MS, window from m/z 300-2000, then three data dependent MS/MS scans of the first, second, and third most intense ions from the first scan event. MS/MS settings of 35% normalized collision energy, default charge of 1, minimum intensity of 105 counts, isolation width of m/z 2, dynamic exclusion count of 5, repeat duration of 1 min, exclusion list size of 25, and an exclusion duration of 3 min.
In alternative preparation, cyanobacterial extracts were first separated by VLC to create nine fractions of distinct polarity, which were then analyzed by LC-MS/MS to generate the molecular network. Using the same instrument and the same column with a flow rate of 700 μL/min and a linear gradient from 40% to 100% B over 20 min, MS data from three scan events were acquired: first scan negative MS, window from m/z 80-2000; second scan positive MS, window from m/z 100-2000; and third scan MS/MS data dependent most intense from second scan, using the same ESI and MS/MS settings but without dynamic exclusion. Characterized NPs (carmaphycins A and B, barbamide, carmabin A, tumonoic acid I), either purified or synthesized, and an injection consisting only of solvent, were also analyzed via LC-MS/MS. The retention times and MS/MS spectra for the standards were manually verified against the MarinLit database15 and previously published data, respectively.21-24,26
Molecular Networking
The data was converted to mzXML format, a text-based format used to represent mass spectrometry data describing the scan number, precursor m/z, and the m/z and intensity of each ion observed in MS/MS, using ReadW from Thermo or msconvert, part of the ProteoWizard package.57 The bacterial network also included selected MS/MS data of ions below m/z 2000 from HMDB,58 LipidMaps,59 MassBank,60 NIST61 and other databases including in house data in mgf format 62, a tab delimited text-based representation of the mass spectrometry data. Once all the data were in a text format (mzXML or mgf), the data were subjected to Spectral Networks, which includes MS-Clustering,63 followed by generating text files with attributes using MATLAB which were imported into Cytoscape 3.8.2 for visualization as a network.18
Computationally, the spectra are converted into unit vectors in n-dimensional space and pairs of vectors are compared with a dot product calculation, which by definition includes the cosine of the angle between the two vectors, herein referred to as the cosine similarity score. The cosine similarity score (dot product) assigned to each pair of vectors ranges from 0 to 1, where 1 represents identical spectra. To reduce the complexity of the resultant networks, identical MS/MS spectra are combined into consensus spectra, the comparison is conducted between pairs of spectra that have at least six ions that match, cosine scores below 0.5 are discarded, and two nodes are required to be in the top 10 cosine scores (K parameter) in both directions for an edge to connect them in Cytoscape.
The MS-Clustering algorithm63 combines identical spectra into consensus spectra by comparing only pairs of vectors from spectra with similar parent masses, within 0.5 Da, and assigning cosine similarity scores to each pair. The pairs with a cosine score higher than 0.95 were combined into consensus spectra. Then Spectral Networks compared all possible vector-pairs from consensus MS/MS spectra.18,64,65 The algorithm parameters include: mass tolerance for fragment peaks (0.3 Da), parent mass tolerance (1.0 Da), the minimum percentage of overlapping masses between two spectra (set at 45%), the minimum number of matched peaks per spectral alignment (6), the minimum percentage of matched peaks in a spectral alignment (40%), and a minimum cosine score of 0.5. The higher the cosine score between two spectra, the more similar the MS/MS spectra, and by extension, the more similar the corresponding molecules. Subsequent MATLAB scripts reported data with cosine scores of and above the user-defined cosine threshold, herein chosen to be 0.65. The data were then imported into Cytoscape and displayed as a network of nodes and edges.19 To further simplify the network, the background nodes from solvent and the database nodes that were not directly connected to a sample node via an edge were removed from the network. Remaining nodes within the network were organized with the FM3 layout plug-in,20 node colors were mapped based on the source files of the MS/MS, and the edge thickness attribute was defined to reflect cosine similarity scores with thicker lines indicating higher similarity. Sub-networks were generated in Cytoscape from isolated portions of the larger network in order to improve visibility of node connectivity.
Supplementary Material
ACKNOWLEDGMENT
This work was supported in part by GM097509 (PCD), AI095125 (PCD). The cyanobacterial work was supported by NIH CA100851, TW006634 and NS053398 (WG). L.M. Sanchez is a San Diego IRACDA Fellow (NIH grant GM 68524). R. de Felicio is grateful to FAPESP (Sao Paulo, Brazil) for financial support (Proc. BEPE 2012/00246-7). A. Wodke and N. Bruns are grateful to HZI Grad School (Braunschweig, Germany) for financial support. X. Liu is supported in part by the National Natural Science Foundation of China (81102369, 31125002), the Ministry of Science and Technology of China (2013ZX10005004), and the European Union’s Seventh Framework Programme (FP7/2007-2013) under grant agreement no. 31284. We thank K. Pogliano and T. Fleming for the provision of B. subtilis and environmental strains and V.V. Phelan for scientific discussions.
Footnotes
Supporting Information. Cyanobacterial collection and bacterial strain information. MS/MS spectra annotation of seed standards and analogs. This material is available free of charge via the Internet at http://pubs.acs.org.
Author Contributions
The manuscript was written with contributions of all authors. All authors have given approval to the final version of the manuscript.
REFERENCES
- 1.Davies J, Ryan KS. ACS Chem. Biol. 2012;7:252–259. doi: 10.1021/cb200337h. [DOI] [PubMed] [Google Scholar]
- 2.Newman DJ, Cragg GM. J. Nat. Prod. 2012;75:311–335. doi: 10.1021/np200906s. [DOI] [PMC free article] [PubMed] [Google Scholar]
- 3.Gerwick WH, Moore BS. Chem. Biol. 2012;19:85–98. doi: 10.1016/j.chembiol.2011.12.014. [DOI] [PMC free article] [PubMed] [Google Scholar]
- 4.Johansen KT, Wubshet SG, Nyberg NT, Jaroszewski JW. J. Nat. Prod. 2011;74:2454–2461. doi: 10.1021/np200780m. [DOI] [PubMed] [Google Scholar]
- 5.Mansson M, Phipps RK, Gram L, Munro MHG, Larsen TO, Nielsen KF. J. Nat.Prod. 2010;73:1126–1132. doi: 10.1021/np100151y. [DOI] [PubMed] [Google Scholar]
- 6.Wubshet SG, Johansen KT, Nyberg NT, Jaroszewski JW. J. Nat.Prod. 2012;75:876–882. doi: 10.1021/np200915c. [DOI] [PubMed] [Google Scholar]
- 7.Perlman ZE, Slack MD, Feng Y, Mitchison TJ, Wu LF, Altschuler SJ. Science. 2004;306:1194–8. doi: 10.1126/science.1100709. [DOI] [PubMed] [Google Scholar]
- 8.Wong WR, Oliver AG, Linington RG. Chem. Biol. 2012;19:1483–1495. doi: 10.1016/j.chembiol.2012.09.014. [DOI] [PMC free article] [PubMed] [Google Scholar]
- 9.Gu Z-M, Wang L-Q, Wu J. Nat. Prod. J. 2011;1:135–145. [Google Scholar]
- 10.Hou Y, Braun DR, Michel CR, Klassen JL, Adnani N, Wyche TP, Bugni TS. Anal. Chem. 2012;84:4277–4283. doi: 10.1021/ac202623g. [DOI] [PMC free article] [PubMed] [Google Scholar]
- 11.Nielsen KF, Maansson M, Rank C, Frisvad JC, Larsen TO. J. Nat. Prod. 2011;74:2338–2348. doi: 10.1021/np200254t. [DOI] [PubMed] [Google Scholar]
- 12.Kasper PT, Rojas-Cherto M, Mistrik R, Reijmers T, Hankemeier T, Vreeken RJ. Rapid Commun. Mass Sp. 2012;26:2275–2286. doi: 10.1002/rcm.6340. [DOI] [PMC free article] [PubMed] [Google Scholar]
- 13.Stafsnes MH, Dybwad M, Brunsvik A, Bruheim P. Anton. Leeuw. Int. J. G. 2013;103:603–615. doi: 10.1007/s10482-012-9844-6. [DOI] [PubMed] [Google Scholar]
- 14.Laatsch H. Antibase, A Data Base for Rapid Dereplication and Strcuture Determination of Microbial Natural Products. Wiley-VCH; Weinheim, Germany: 2013. [Google Scholar]
- 15.2013 In MarinLit; Department of Chemistry, University of Canterbury: http://www.chem.canterbury.ac.nz/marinlit/marinlit.shtml.
- 16.2013 In Dictionary of Natural Products; Chapman & Hall Chemical Database. [Google Scholar]
- 17.Nguyen DD, Wu CH, Moree WJ, Lamsa A, Medema MH, Zhao X, Gavilan RG, Aparicio M, Atencio L, Jackson C, Ballesteros J, Sanchez J, Watrous JD, Phelan VV, van de Wiel C, Kersten RD, Mehnaz S, De Mot R, Shank EA, Charusanti P, Nagarajan H, Duggan BM, Moore BS, Bandeira N, Palsson BO, Pogliano K, Gutierrez M, Dorrestein PC. Proc. Natl. Acad. Sci. USA. 2013;110:e2611–20. doi: 10.1073/pnas.1303471110. [DOI] [PMC free article] [PubMed] [Google Scholar]
- 18.Watrous J, Roach P, Alexandrov T, Heath BS, Yang JY, Kersten RD, van der Voort M, Pogliano K, Gross H, Raaijmakers JM, Moore BS, Laskin J, Bandeira N, Dorrestein PC. Proc. Natl. Acad. Sci. USA. 2012;109:e1743–e1752. doi: 10.1073/pnas.1203689109. [DOI] [PMC free article] [PubMed] [Google Scholar]
- 19.Smoot ME, Ono K, Ruscheinski J, Wang PL, Ideker T. Bioinformatics. 2011;27:431–432. doi: 10.1093/bioinformatics/btq675. [DOI] [PMC free article] [PubMed] [Google Scholar]
- 20.2013 In http://apps.cytoscape.org/apps/fm3.
- 21.Hooper GJ, Orjala J, Schatzman RC, Gerwick WH. J. Nat. Prod. 1998;61:529–533. doi: 10.1021/np970443p. [DOI] [PubMed] [Google Scholar]
- 22.Clark BR, Engene N, Teasdale ME, Rowley DC, Matainaho T, Valeriote FA, Gerwick WH. J. Nat. Prod. 2008;71:1530–1537. doi: 10.1021/np800088a. [DOI] [PMC free article] [PubMed] [Google Scholar]
- 23.Orjala J, Gerwick WH. J. Nat. Prod. 1996;59:427–430. doi: 10.1021/np960085a. [DOI] [PubMed] [Google Scholar]
- 24.Pereira AR, Kale AJ, Fenley AT, Byrum T, Debonsi HM, Gilson MK, Valeriote FA, Moore BS, Gerwick WH. ChemBioChem. 2012;13:810–817. doi: 10.1002/cbic.201200007. [DOI] [PMC free article] [PubMed] [Google Scholar]
- 25.McPhail KL, Correa J, Linington RG, Gonzalez J, Ortega-Barria E, Capson TL, Gerwick WH. J. Nat. Prod. 2007;70:984–988. doi: 10.1021/np0700772. [DOI] [PMC free article] [PubMed] [Google Scholar]
- 26.Kim EJ, Lee JH, Choi H, Pereira AR, Ban YH, Yoo YJ, Kim E, Park JW, Sherman DH, Gerwick WH, Yoon YJ. Org. Lett. 2012;14:5824–5827. doi: 10.1021/ol302575h. [DOI] [PMC free article] [PubMed] [Google Scholar]
- 27.Sitachitta N, Marquez BL, Williamson RT, Rossi J, Roberts MA, Gerwick WH, Nguyen VA, Willis CL. Tetrahedron. 2000;56:9103–9113. [Google Scholar]
- 28.Luesch H, Yoshida WY, Moore RE, Paul VJ, Mooberry SL. J. Nat. Prod. 2000;63:611–615. doi: 10.1021/np990543q. [DOI] [PubMed] [Google Scholar]
- 29.Luesch H, Yoshida WY, Moore RE, Paul VJ, Corbett TH. J. Am. Chem. Soc. 2001;123:5418–5423. doi: 10.1021/ja010453j. [DOI] [PubMed] [Google Scholar]
- 30.Luesch H, Yoshida WY, Moore RE, Paul V. J. C. P. s. Bioorg. Med. Chem. 2002;10:1973–1978. doi: 10.1016/s0968-0896(02)00014-7. [DOI] [PubMed] [Google Scholar]
- 31.Gutierrez M, Suyama TL, Engene N, Wingerd JS, Matainaho T, Gerwick WH. J. Nat.Prod. 2008;71:1099–1103. doi: 10.1021/np800121a. [DOI] [PubMed] [Google Scholar]
- 32.Matthew S, Schupp PJ, Luesch H. J. Nat. Prod. 2008;71:1113–1116. doi: 10.1021/np700717s. [DOI] [PubMed] [Google Scholar]
- 33.Tidgewell K, Engene N, Byrum T, Media J, Doi T, Valeriote FA, Gerwick WH. ChemBioChem. 2010;11:1458–1466. doi: 10.1002/cbic.201000070. [DOI] [PMC free article] [PubMed] [Google Scholar]
- 34.Bister B, Bischoff D, Strobele M, Riedlinger J, Reicke A, Wolter F, Bull AT, Zahner H, Fiedler HP, Sussmuth RD. Angew. Chem. Int. Ed. 2004;43:2574–2576. doi: 10.1002/anie.200353160. [DOI] [PubMed] [Google Scholar]
- 35.Keller S, Nicholson G, Drahl C, Sorensen E, Fiedler H-P, Suessmuth RD. J. Antibiot. 2007;60:391–394. doi: 10.1038/ja.2007.54. [DOI] [PubMed] [Google Scholar]
- 36.Wang Q, Song F, Xiao X, Huang P, Li L, Monte A, Abdel-Mageed WM, Wang J, Guo H, He W, Xie F, Dai H, Liu M, Chen C, Xu H, Liu M, Piggott AM, Liu X, Capon RJ, Zhang L. Angew. Chem. Int. Ed. 2013;52:1231–1234. doi: 10.1002/anie.201208801. [DOI] [PMC free article] [PubMed] [Google Scholar]
- 37.Moree WJ, Phelan VV, Wu CH, Bandeira N, Cornett DS, Duggan BM, Dorrestein PC. Proc. Natl. Acad. Sci. USA. 2012;109:13811–13816. doi: 10.1073/pnas.1206855109. [DOI] [PMC free article] [PubMed] [Google Scholar]
- 38.Rath CM, Alexandrov T, Higginbottom SK, Song J, Milla ME, Fischbach MA, Sonnenburg JL, Dorrestein PC. Anal. Chem. 2012;84:9259–9267. doi: 10.1021/ac302039u. [DOI] [PMC free article] [PubMed] [Google Scholar]
- 39.Arima K, Kakinuma A, Tamura G. Biochem. Biophys. Res. Commun. 1968;31:488. doi: 10.1016/0006-291x(68)90503-2. [DOI] [PubMed] [Google Scholar]
- 40.Fiedler H-P, Bruntner C, Riedlinger J, Bull AT, Knutsen G, Goodfellow M, Jones A, Maldonado L, Pathom-aree W, Beil W, Schneider K, Keller S, Sussmuth RD. J. Antibiot. 2008;61:158–163. doi: 10.1038/ja.2008.125. [DOI] [PubMed] [Google Scholar]
- 41.Rath CM, Yang JY, Alexandrov T, Dorrestein PC. J. Am. Soc. Mass Spectrom. 2013;24:1167–1176. doi: 10.1007/s13361-013-0608-y. [DOI] [PMC free article] [PubMed] [Google Scholar]
- 42.Chen K, Rannulu NS, Cai Y, Lane P, Liebl AL, Rees BB, Corre C, Challis GL, Cole RB. J. Am. Soc. Mass Spectrom. 2008;19:1856–1866. doi: 10.1016/j.jasms.2008.08.002. [DOI] [PubMed] [Google Scholar]
- 43.Sleno L, Volmer DA. J. Mass Spectrom. 2004;39:1091–1112. doi: 10.1002/jms.703. [DOI] [PubMed] [Google Scholar]
- 44.McReynolds JH, Anbar M. Anal. Chem. 1977;49:1832–6. doi: 10.1021/ac50020a048. [DOI] [PubMed] [Google Scholar]
- 45.Pachuta RR, Cooks RG, Cassady JM, Cong P, McCloud TG, Chang C-J. J. Nat. Prod. 1986;49:412–423. doi: 10.1021/np50045a005. [DOI] [PubMed] [Google Scholar]
- 46.Little DP, Speir JP, Senko MW, O’Connor PB, McLafferty FW. Anal. Chem. 1994;66:2809–15. doi: 10.1021/ac00090a004. [DOI] [PubMed] [Google Scholar]
- 47.Syka JE, Coon JJ, Schroeder MJ, Shabanowitz J, Hunt DF. Proc. Natl. Acad. Sci. USA. 2004;101:9528–33. doi: 10.1073/pnas.0402700101. [DOI] [PMC free article] [PubMed] [Google Scholar]
- 48.Zubarev RA, Kelleher NL, McLafferty FW. J. Am. Chem. Soc. 1998;120:3265–66. [Google Scholar]
- 49.Munson MSB, Field FH. J. Am. Chem. Soc. 1966;88:2621–2630. [Google Scholar]
- 50.Huang MZ, Cheng SC, Cho YT, Shiea J. Anal. Chim. Acta. 2011;702:1–15. doi: 10.1016/j.aca.2011.06.017. [DOI] [PubMed] [Google Scholar]
- 51.Zhang T, Zhou W, Jin W, Zhou J. Handberg, E., Zhu Z, Chen H, Jin Q. J. Mass Spectrom. 2013;48:669–76. doi: 10.1002/jms.3212. [DOI] [PubMed] [Google Scholar]
- 52.Pesci EC, Milbank JBJ, Pearson JP, McKnight S, Kende AS, Greenberg EP, Iglewski BH. Proc. Natl. Acad. Sci. USA. 1999;96:11229–11234. doi: 10.1073/pnas.96.20.11229. [DOI] [PMC free article] [PubMed] [Google Scholar]
- 53.Sanchez LM, Wong WR, Riener RM, Schulze CJ, Linington RG. Plos One. 2012;7:e35398. doi: 10.1371/journal.pone.0035398. [DOI] [PMC free article] [PubMed] [Google Scholar]
- 54.Benson DA, Cavanaugh M, Clark K, Karsch-Mizrachi I, Lipman DJ, Ostell J, Sayers EW. Nucleic Acids Res. 2013;41:D36–D42. doi: 10.1093/nar/gks1195. [DOI] [PMC free article] [PubMed] [Google Scholar]
- 55.Hooft JJ, Vos RH, Ridder L, Vervoort J, Bino R. Metabolomics. 2013 ASAP. [Google Scholar]
- 56.Hakvaag S, Fjaervik E, Josefsen KD, Ian E, Ellingsen TE, Zotchev SB. Mar. Drugs. 2008;6:620–635. doi: 10.3390/md6040620. [DOI] [PMC free article] [PubMed] [Google Scholar]
- 57.2013 http://proteowizard.sourceforge.net/#, Ed.; ProteoWizard Software Foundation.
- 58.Wishart DS, Jewison T, Guo AC, Wilson M, Knox C, Liu YF, Djoumbou Y, Mandal R, Aziat F, Dong E, Bouatra S, Sinelnikov I, Arndt D, Xia JG, Liu P, Yallou F, Bjorndahl T, Perez-Pineiro R, Eisner R, Allen F, Neveu V, Greiner R, Scalbert A. Nucleic Acids Res. 2013;41:D801–D807. doi: 10.1093/nar/gks1065. [DOI] [PMC free article] [PubMed] [Google Scholar]
- 59.Sud M, Fahy E, Cotter D, Brown A, Dennis EA, Glass CK, Merrill AH, Murphy RC, Raetz CRH, Russell DW, Subramaniam S. Nucleic Acids Res. 2007;35:D527–D532. doi: 10.1093/nar/gkl838. [DOI] [PMC free article] [PubMed] [Google Scholar]
- 60.Horai H, Arita M, Kanaya S, Nihei Y, Ikeda T, Suwa K, Ojima Y, Tanaka K, Tanaka S, Aoshima K, Oda Y, Kakazu Y, Kusano M, Tohge T, Matsuda F, Sawada Y, Hirai MY, Nakanishi H, Ikeda K, Akimoto N, Maoka T, Takahashi H, Ara T, Sakurai N, Suzuki H, Shibata D, Neumann S, Iida T, Funatsu K, Matsuura F, Soga T, Taguchi R, Saito K, Nishioka T. J. Mass Spectrom. 2010;45:703–714. doi: 10.1002/jms.1777. [DOI] [PubMed] [Google Scholar]
- 61.2012 In http://www.nist.gov/index.html; The National Institute of Standards and Technology (NIST)
- 62.Smith CA, O'Maille G, Want EJ, Qin C, Trauger SA, Brandon TR, Custodio DE, Abagyan R, Siuzdak G. Ther. Drug Monit. 2005;27:747–751. doi: 10.1097/01.ftd.0000179845.53213.39. [DOI] [PubMed] [Google Scholar]
- 63.Frank AM, Savitski MM, Nielsen ML, Zubarev RA, Pevzner PA. J. Proteome Res. 2007;6:114–123. doi: 10.1021/pr060271u. [DOI] [PMC free article] [PubMed] [Google Scholar]
- 64.Bandeira N. Biotechniques. 2007;42:687. doi: 10.2144/000112487. [DOI] [PubMed] [Google Scholar]
- 65.Bandeira N, Tsur D, Frank A, Pevzner P. Proc. Natl. Acad. Sci.USA. 2007;10:6140–5. doi: 10.1073/pnas.0701130104. [DOI] [PMC free article] [PubMed] [Google Scholar]
Associated Data
This section collects any data citations, data availability statements, or supplementary materials included in this article.