

Abstract
Calcium (Ca2+) waves generating oscillatory Ca2+ signals are widely observed in biological cells. Experimental studies have shown that under certain conditions, initiation of Ca2+ waves is random in space and time, while under other conditions, waves occur repetitively from preferred locations (pacemaker sites) from which they entrain the whole cell. In this study, we use computer simulations to investigate the self-organization of Ca2+ sparks into pacemaker sites generating Ca2+ oscillations. In both ventricular myocyte experiments and computer simulations of a heterogeneous Ca2+ release unit (CRU) network model, we show that Ca2+ waves occur randomly in space and time when the Ca2+ level is low, but as the Ca2+ level increases, waves occur repetitively from the same sites. Our analysis indicates that this transition to entrainment can be attributed to the fact that random Ca2+ sparks self-organize into Ca2+ oscillations differently at low and high Ca2+ levels. At low Ca2+, the whole cell Ca2+ oscillation frequency of the coupled CRU system is much slower than that of an isolated single CRU. Compared to a single CRU, the distribution of interspike intervals (ISIs) of the coupled CRU network exhibits a greater variation, and its ISI distribution is asymmetric with respect to the peak, exhibiting a fat tail. At high Ca2+, however, the coupled CRU network has a faster frequency and lesser ISI variation compared to an individual CRU. The ISI distribution of the coupled network no longer exhibits a fat tail and is well-approximated by a Gaussian distribution. This same Ca2+ oscillation behaviour can also be achieved by varying the number of ryanodine receptors per CRU or the distance between CRUs. Using these results, we develop a theory for the entrainment of random oscillators which provides a unified explanation for the experimental observations underlying the emergence of pacemaker sites and Ca2+ oscillations.
Key points
Calcium (Ca2+) is fundamental to biological cell function, and Ca2+ waves generating oscillatory Ca2+ signals are widely observed in many cell types.
Some experimental studies have shown that Ca2+ waves initiate from random locations within the cell, while other studies have shown that waves occur repetitively from preferred locations (pacemaker sites).
In both ventricular myocyte experiments and computer simulations of a heterogeneous model of coupled Ca2+ release units (CRUs), we show that Ca2+ waves occur randomly in space and time when the Ca2+ level is low, but as the Ca2+ level increases, waves occur repetitively from the same sites.
Ca2+ waves are self-organized dynamics of the CRU network, and the wave frequency strongly depends on CRU coupling.
Using these results, we develop a theory for the entrainment of random oscillators, which provides a unified explanation for the experimental and computational observations.
Introduction
Calcium (Ca2+) signalling is fundamental to biological function (Berridge et al. 2000). In the heart, Ca2+ plays crucial roles in pacemaker function underlying the normal heart rhythm (Lakatta et al. 2010) and excitation–contraction coupling (Bers, 2002), while dysfunction in intracellular Ca2+ signalling can promote heart failure (Anderson et al. 2011) and cardiac arrhythmias (ter Keurs & Boyden, 2007). Experimental studies have demonstrated a universal hierarchy of Ca2+ signalling dynamics in cardiac myocytes as well as in many other cell types (Marchant et al. 1999; Berridge et al. 2000; Marchant & Parker, 2001; Cheng & Lederer, 2008; Nivala et al. 2012b), ranging from Ca2+ quarks, sparks, and macrosparks to abortive and finally full waves. This hierarchy can be demonstrated by altering certain parameters, such as extracellular Ca2+ concentration (Capogrossi & Lakatta, 1985; Capogrossi et al. 1986; Cheng et al. 1996) or inositol 1,4,5-trisphoshate (IP3) concentration (Marchant et al. 1999; Marchant & Parker, 2001) in the cell. Specifically, at low Ca2+ or IP3 concentrations, cells predominantly exhibit random single Ca2+ sparks with only small fluctuations in the average cytosolic Ca2+ of the whole cell. As the Ca2+ or IP3 concentration increases, spark clusters and waves occur, which result in spikes of the whole-cell Ca2+ concentration, with randomly irregular interspike intervals (ISIs). As the Ca2+ or IP3 concentration increases further, the Ca2+ waves and whole-cell Ca2+ spikes become more periodic in time.
Computer modelling studies using stochastic simulations of Ca2+ release unit (CRU) networks coupled via Ca2+-induced Ca2+ release (CICR; Falcke, 2003; Shuai & Jung, 2003; Izu et al. 2006; Skupin et al. 2010; Nivala et al. 2012b) have shown that the initiation of a Ca2+ wave is not due to a single spark but requires the formation of a locally self-organized cluster of nearby sparks large enough to propagate non-decrementally by CICR. Recently, we showed that the theory of criticality governs the transition from sparks to waves (Nivala et al. 2012b), similar to a second-order phase transition in thermodynamic systems (Stanley, 1999). In other words, as the interaction between CRUs via CICR becomes stronger, the spark cluster-size distribution changes from an exponential distribution to a power-law distribution, characteristic of criticality. Long-range correlations, which occur during criticality, facilitate the formation and propagation of Ca2+ waves. Theoretically, when the distribution of CRUs is uniform inside a cell, the wave initiation sites should occur randomly and uniformly in space, as demonstrated recently in simulations of a homogeneous CRU network (Nivala et al. 2012b). This pattern has been observed in many experimental studies (Cheng et al. 1996; Wier et al. 1997; Marchant & Parker, 2001; Wasserstrom et al. 2010). However, in other experimental studies, waves have also been observed to originate repetitively from the same locations in a cell (Rooney et al. 1990; Kasai et al. 1993; Thorn et al. 1993; Simpson et al. 1997). The latter is believed to be caused by heterogeneities in the CRU network, such as localized higher concentrations of ryanodine receptors (RyRs) or IP3 receptors in so-called ‘pacemaker’ regions of a cell. In our own experiments in ventricular myocytes (data shown in Fig. 3 of our previous publication (Nivala et al. 2012b) and Fig. 1), we have observed both patterns occurring in the same cell: at Ca2+ levels near the spark-to-wave transition, waves occur irregularly and originate randomly from different sites, while at higher Ca2+ levels, waves become periodic and tend to originate from preferred locations, acting as pacemaker regions which entrain the whole cell. The question arises, therefore, how can both patterns occur in the same cell? That is, why, at low Ca2+ levels, do Ca2+ waves arise randomly and irregularly from multiple sites, while at high Ca2+ levels, specific pacemaker regions emerge as the predominant source of Ca2+ waves generating more periodic Ca2+ oscillations? Here we show that this behaviour is a natural consequence of self-organization and random entrainment in a heterogeneous system.
Figure 3. Ca2+ excitation dynamics in coupled CRU networks at low Ca2+ ([Ca2+]o= 3.1 mm) and high Ca2+ ([Ca2+]o= 10 mm).
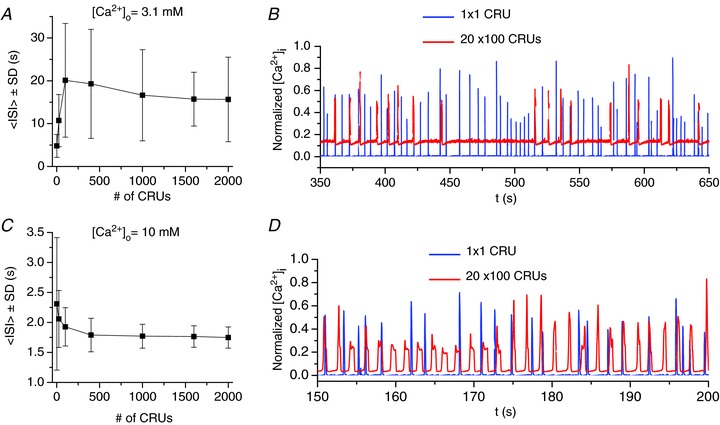
A, average ISI and standard deviation (<ISI> ± SD) versus the number of CRUs, corresponding to 1 × 1, 5 × 5, 10 × 10, 20 × 20, 50 × 20, 80 × 20, 100 × 20 CRUs. B, normalized cytosolic Ca2+ concentration versus time for a single CRU and a 100 × 20 CRU network. C and D, same as the conditions as A and B but with [Ca2+]o= 10 mm. Note: many of these distributions are far from Gaussian (see Fig. 7E); therefore, <ISI> and SD do not provide a complete description and are only used here to indicate the general trend.
Figure 1. Ca2+ wave initiation sites in permeabilized mouse ventricular myocytes.
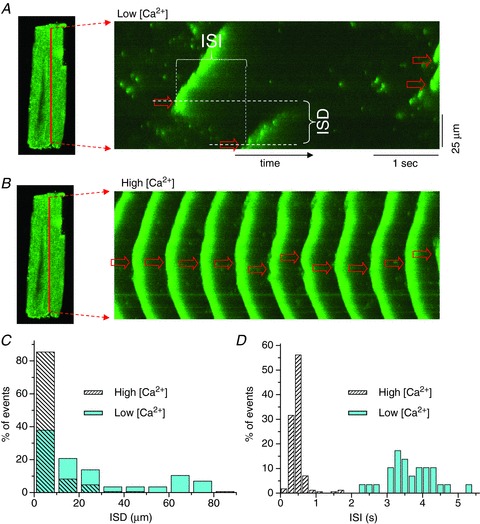
A, a linescan (Fluo-4 fluorescence intensity of a line in the cell versus time, as indicated in the left panel) from a myocyte for 100 nm free Ca2+ in the solution. The measurements of ISD and ISI are indicated by dashed white lines. B, a linescan from the same cell for 1000 nm free Ca2+ in the solution. Arrows indicate the wave initiation sites. C, summary data for the wave initiation site for low (100 nm) and high (1000 nm) Ca2+. Shown is the distribution of the distance between the initiation sites of two consecutive waves (as illustrated in A), called ISD. D, summary data for the inter wave interval (i.e. ISI) from the same recordings as in C. Due to the limitation of the recording length of the linescan, many long ISIs were missed (an ISI > 2.5 s in a 5 s recording or an ISI > 5 s in a 10 s recording could be missed), indicating that the ISI distribution should be even broader than is shown.
Methods
Cardiac myocyte experiments
The experimental protocol in this study was approved by the UCLA Animal Research Committee and performed in accordance with the NIH Guide for the Care and Use of Laboratory Animals.
Ventricular myocyte isolations were performed as previously described (Nivala et al. 2012b). Briefly, male C57Bl/6 mice of 68 weeks of age were injected intraperitoneally with 800 ml heparin (5000 U/ml) 20–30 min before anesthetization and euthanization with isoflurane (Phoenix Pharmaceuticals). Hearts were quickly excised by thoracotomy and retrogradely perfused on a Langendorff apparatus maintained at 37°C. The enzyme digestion step consisted of perfusing Tyrode's solution containing 1 mg/ml collagenase (Type II, 300 U/mg; Worthington) and 2.8 mg/ml protease (Type XIV, ≥ 3.5 U/mg; Sigma) for 13–15 min. Myocytes were dissociated from digested ventricles by gentle mechanical dissociation and used within 46 h. Myocyte membranes were permeabilized for 30–60 s with saponin (0.005% w/v) in nominally Ca2+-free internal solution at room temperature, as previously described in detail (Nivala et al. 2012b). To facilitate diffusive Ca2+-mediated coupling among CRUs and induce Ca2+ signalling events, free Ca2+ was incrementally raised in saponin-free internal solution buffered with 0.25 mm EGTA and 0.03 mm Fluo-4 fluorescent Ca2+ dye (Invitrogen), using WebMaxC Extended software (http://maxchelator.stanford.edu) to calculate free [Ca2+]. Ca2+ imaging was performed using laser confocal microscopy (Zeiss PASCAL 5 system) as described previously (Nivala et al. 2012b). Fluorescence intensity space–time recordings were acquired in the linescan mode (100 μm line−1, 1.92 ms line−1, 2604 or 5208 lines per recording corresponding to 5 or 10 s long recordings, respectively).
Experimental data analysis
Experimental linescan recordings were analysed using ImageJ software, and statistical analyses were performed using custom Python code (courtesy of Dr. Guillaume Calmettes). The inter-wave initiation site distances (ISDs) and ISIs (see Fig. 1A) were measured only from consecutive Ca2+ waves that each propagated at least 30 μm. Since the ISD and ISI distributions did not meet conditions for normality, the median was selected as the least biased descriptor for all distributions. Ca2+ wave periodicity was described using ISI variance (σ|Med|) modified for non-normal distributions and defined as (Σ|ISI – ISImedian|)/(N– 1). In this formula, the median was used in place of the mean as a more appropriate descriptor of non-normal distributions. The absolute value function was used in place of the squaring function, which tends to bias the standard variance towards larger deviations from the mean. Smaller values of σ|Med| reflect greater periodicity. To measure the effect size of intracellular Ca2+ levels on ISD and ISI, we used the difference in medians between the low and high Ca2+ conditions for each respective interval measure (e.g. median ISIHighCa– median ISILowCa). To measure the effect size of intracellular Ca2+ levels on wave periodicity, we used the difference in σ|Med| between low and high Ca2+ conditions (i.e. σ|Med|HighCa–σ|Med|LowCa). Negative effect sizes indicate smaller value measures at high Ca2+ relative to the measures at low Ca2+ levels. Confidence intervals (CIs) around observed statistical measures (i.e. median, σ|Med|, and effect sizes) were generated using computational bootstrap methods (Efron & Tibshirani, 1991; Manly, 1997; Calmettes et al. 2012), which account for smaller and unequal sample sizes and non-normal distributions. Briefly, the statistical measure of interest was calculated from an individual pseudo data sample set generated by randomly resampling, with replacement, values from an actual data sample set (e.g. ISDHighCa). This process was repeated 100,000 times to generate a distribution of 100,000 estimates of the variability of the statistical measure due to sampling variations. A 99% CI around an observed statistic was determined as the range of values above the 2500th and below the 97,500th value of the distribution of estimates. Statistical significance at the P < 0.01 level was established by determining whether effect sizes of zero (i.e. no difference between low and high Ca2+ conditions) for a statistical measure fell outside of the 99% CI.
Computational models and methods
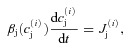
The basic computational units are CRUs which are coupled via Ca2+ diffusion in myoplasm and sarcoplasmic reticulum (SR) to form a three-dimensional (3-D) cell model (containing 100 × 20 × 10 CRUs). The CRU model was presented in our previous studies (Rovetti et al. 2010; Nivala et al. 2012a,b). Briefly, each CRU contains: a junctional SR (jSR) which is diffusively connected to the network SR (NSR), and a dyadic space (DS), which is diffusively connected to the myoplasm (Myo) space. Extracellular Ca2+ enters the DS via a leak conductance and the voltage-gated L-type Ca2+ channels (LCCs), which were simulated stochastically by a Markov model (Mahajan et al. 2008). Ca2+ is released from the jSR through its associated cluster of RyRs to the DS. The RyRs were simulated stochastically using a Markov model (Stern et al. 1999) in which activation and inactivation of RyRs are regulated by Ca2+ in the DS. Each CRU contains 10 LCCs and 100 RyRs. Ca2+ is either extruded from the cell via the Na+–Ca2+ exchanger or taken back up into the NSR via the SERCA pump. The governing differential equations for the Ca2+ concentration in different spaces are:
| (1) |
| (2) |
| (3) |
 |
(4) |
where cm(x,y,z,t) and cs(x,y,z,t) are the local Ca2+ concentrations in the Myo and the NSR, respectively, and  and
and  are the Ca2+ concentrations in the ith DS and jSR, respectively. βm, βs, βd, and βj are Ca2+ buffering constants, which are instantaneous functions of the Ca2+ concentrations in the corresponding spaces, following Wagner & Keizer (1994). Jm, Js,
  and
and  are the net Ca2+ fluxes for each space. Dm and Ds are the Ca2+ diffusion constants in the Myo and the NSR, respectively. To increase the total cellular Ca2+ load, we increased the extracellular Ca2+ concentration ([Ca2+]o). Note that due to Ca2+ spark and wave activity, the SR Ca2+ load does not necessarily always increase with [Ca2+]o, but the diastolic cytosolic Ca2+ level and total cellular Ca2+ load does.
The majority of the simulations in the study were performed in quasi-two-dimensional (2-D) models, in which we coupled the CRUs in 2-D arrays of different sizes. The purposes are twofold: to speed up the simulation for statistics and to allow systematic analyses by comparing behaviours of a single uncoupled CRU with those of coupled CRUs. Since the CRUs in our model are identical, reducing the 3-D model to a quasi-2-D model has relatively small quantitative effects (e.g. shifting the wave threshold to a lower [Ca2+]o value) while preserving qualitative aspects of the system.
In numerical simulations, the NSR and Myo domains are discretized into 3-D spatial grids using a 0.2 × 0.2 × 0.2 μm3 spatial resolution. The equations are simulated using an operator splitting method by advancing first the diffusion step and then the flux steps using a first-order forward Euler method with a time step of 0.01 ms. The stochastic transitions of LCCs and RyRs are simulated using the Gillespie's stochastic simulation algorithm (Gillespie, 1977), modified to handle time-dependent rates. All computations are performed on an Intel Xeon 2.53 GHz processor using Graphical Processing Unit (GPU) parallel computing with an NVIDIA Tesla C2050. The details of the computational methods were presented previously (Nivala et al. 2012a).
Results
Ca2+ waves transition from random multiple initiation sites to preferred sites as Ca2+ increases in ventricular myocytes
Permeabilized mouse ventricular myocytes were superfused with the fluorescent Ca2+ indicator Fluo-4 and imaged with confocal microscopy (see Methods). Figure 1A and B compare linescans (space–time plots) of the cytoplasmic Ca2+ fluorescence at low (100 nm) and high (1000 nm) free Ca2+ concentration in the bathing solution. At the low Ca2+ concentration, waves were irregular and initiation sites varied randomly, while at the high Ca2+ concentration in the same myocyte, waves were more periodic and originated more consistently from the same location. Figure 1C shows summary data from multiple cells for the distance between the initiation sites of two consecutive waves, called the inter-wave initiation site distance (ISD). In the case of high Ca2+, more than 80% of the successive wave initiation sites fell in the same 10 μm wide bin, whereas the distribution was much broader for the low Ca2+ case. We also calculated the ISI between waves from the same recordings as used for obtaining Fig. 1C. The ISI was also much more narrowly distributed in the case of high Ca2+ than in the case of low Ca2+ (Fig. 1D). These differences were statistically significant. For the low Ca2+ condition, ISDs (n= 29 wave intervals from 22 recordings in 11 cells) exhibited a broad distribution skewed towards larger values (ISDMedian= 14.44 μm; 99% CI (3.82 μm, 29.96 μm)). For the high Ca2+ condition (n= 171 wave intervals from 16 recordings in 7 cells), ISDs exhibited a much narrower distribution with less skew and a substantially larger proportion of values (ISDMedian= 2.76 μm, 99% CI (1.86 μm, 4.82 μm); Fig. 1C). The two distributions were statistically significantly different (effect size: ΔISDMedian=−11.68 μm; 99% CI (−28.06 μm, −1.18 μm); P < 0.01). These results indicate multiple sites of wave initiation when Ca2+ is low, but smaller excursions mostly limited to a single or few preferred sites when Ca2+ is high. Corresponding ISIs (Fig. 1D) exhibited a broad distribution (ISIMedian= 3.55 s; 99% CI (3.23 s, 4.13 s)) under the low Ca2+ condition, whereas ISIs exhibited a much narrower distribution and a substantial shift towards smaller values (ISIMedian= 0.47 s; 99% CI (0.42 s, 0.50 s)) in the high Ca2+ condition. The two distributions also were statistically significantly different (effect size: ΔISIMedian=−3.08 s; 99% CI (−3.64 s, −2.79 s)). Thus, Ca2+ waves initiate more irregularly at longer intervals when Ca2+ is low but become more periodic and frequent when Ca2+ is high.
The degree of periodicity was analysed by comparing the average deviation from the median ISI (σ|Med|, see Methods) at low versus high Ca2+. σ|Med| decreased from 0.54 s (99% CI (0.34 s, 0.74 s)) at low Ca2+ to 0.12 s (99% CI (0.09 s, 0.16 s)) at high Ca2+, which was statistically significant (P < 0.01; effect Size: Δσ|Med|=−0.41 s; 99% CI (−0.60 s, −0.21 s)).
Ca2+ waves transition from random multiple initiation sites to preferred sites as Ca2+ increases in computational models incorporating heterogeneity
Unlike the data in Fig. 1, we found previously that in a simulated homogeneous CRU network, wave initiation sites were distributed randomly at both low and high Ca2+, even though the ISI decreased and became more periodic at high Ca2+ (Nivala et al. 2012b). However, in a real myocyte, the CRU network contains heterogeneities (Soeller et al. 2007; Baddeley et al. 2009), both in the size and composition of individual CRUs and in their spatial distribution relative to each other and various intracellular organelles. To test if a simplified heterogeneity in the CRU network could qualitatively account for the experimental observation that Ca2+ wave initiation sites become less random as free Ca2+ in the bath solution increases (Fig. 1), we introduced a heterogeneous RyR cluster distribution into our 3-D spatially distributed Ca2+ cycling model by increasing the number of RyRs per CRU from 100 to 110 in all of the CRUs located in the left 20% of the total cell length (i.e. the 20 × 20 × 10 leftmost CRUs), and observed wave behaviour at various [Ca2+]o. Figures 2A and B show linescans of free cytoplasmic Ca2+ concentration at two different [Ca2+]o in the myocyte model (see Supplemental Movies for spatiotemporal dynamics). At a low [Ca2+]o, just beyond the transition to full wave behaviour, waves occurred sporadically at random locations. At the higher [Ca2+]o, however, waves became more periodic and originated consistently from the heterogeneity at the left end of the cell, which acted as a pacemaker site entraining whole-cell oscillations. This agrees with the experimental observations in Fig. 1.
Figure 2. Ca2+ wave initiation sites in a 3-D cell model.
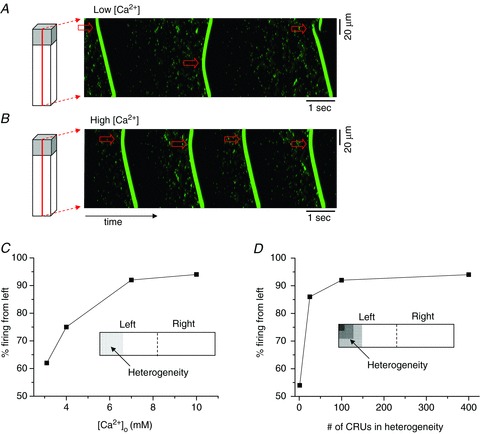
A, [Ca2+]o= 3.1 mm; B, [Ca2+]o= 10 mm. Arrows indicate the wave initiation sites. A heterogeneous region (20 × 20 × 10 CRUs) was included in the left of the network by increasing the number of RyRs from 100 to 110. C, percentage of waves that initiated from the left half of the 100 × 20 CRU network model versus extracellular Ca2+ concentration [Ca2+]o. A heterogeneous region was included in the left 20 × 20 CRUs (see inset) by increasing the number of RyRs from 100 to 110. D, percentage of the waves that initiated from the left half of the 100 × 20 CRU network model versus the size of the heterogeneous region. The percentages in C and D are only approximate due to limited run time (roughly 100 total waves).
To examine this process in a more systematic fashion and to facilitate the collection of wave initiation statistics, we performed additional analyses using a quasi-2-D version of our spatially distributed Ca2+ cycling model, since the full 3-D model was computationally too demanding. The 2-D heterogeneous model consisted of 100 × 20 CRUs, in which the left 20 × 20 CRUs contained 110 RyRs per CRU, and the remaining 80 × 20 CRUs contained 100 RyRs per CRU. Although this heterogeneity was admittedly not physiologically realistic, it served the purpose of creating a large region of the cell with different sensitivity to Ca2+. We then studied how the heterogeneity influenced the wave behaviour over a wide range of [Ca2+]o. Specifically, we measured the extent to which the heterogeneity entrained the whole-cell oscillations by recording the percentage of waves initiated on the left versus the right half of the cell for roughly 100 waves, with any deviation from a 50/50 left/right distribution indicating an effect due to heterogeneity. At a low [Ca2+]o just beyond the transition into the wave regime, the left/right initiation distribution was roughly 60/40, indicating that the heterogeneous region only modestly influenced the wave site generation process (Fig. 2C). At increasingly higher [Ca2+]o, the left/right distribution shifted to an increasingly more left dominant pattern, indicating that the degree of entrainment by the identical heterogeneity depends on the Ca2+ level of the cell. We also examined the effect of changing the size of the heterogeneity at a fixed [Ca2+]o (Fig. 2D) and observed that for the given conditions, there was a critical size of heterogeneity necessary in order for entrainment to occur. For example, for [Ca2+]o= 10 mm, the entrainment rate increased dramatically to >85% when the size of the heterogeneity reached 5 × 5 CRUs.
Ca2+ oscillations as an emergent behaviour of coupled CRUs
To understand how the heterogeneity becomes a progressively more effective pacemaker region entraining Ca2+ waves as the Ca2+ level increases (Fig. 2), we first studied how Ca2+ oscillations emerge in coupled CRU arrays under different conditions. We used the quasi-2-D CRU network model and carried out simulations by varying the sizes of the networks (e.g. 1 × 1 CRU, 2 × 2 CRUs, 3 × 3 CRUs, …) to study the spiking properties (e.g. the ISI distribution, its average (<ISI>) and the standard deviation (SD) of the whole system.
Figure 3A shows the <ISI> and SD versus the number of coupled CRUs for [Ca2+]o= 3.1 mm. For a single isolated CRU, the <ISI> was about 5 s with a SD of 2.5 s. As the number of coupled CRUs increased, both the <ISI> and SD increased. For example, in a 20 × 20 CRU array, the <ISI> was around 20 s with a SD of 13 s. As the number of coupled CRUs increased further, the two quantities saturated at large array sizes. Figure 3B shows the averaged whole-system cytosolic Ca2+ concentrations ([Ca2+]i) versus time for a single uncoupled CRU and a 2-D array of 100 × 20 coupled CRUs. Two important features should be noted. The spark interval in a single uncoupled CRU was much shorter than the Ca2+ wave oscillation interval (ISI) in a coupled system. This same phenomenon was demonstrated in recent experiments in cultured human neuroblastoma SH-SY5Y cells by Thurley et al. (2011), who showed that the inter-puff intervals were much shorter than the ISIs at the whole-cell level. Another important feature is that the whole system exhibits a much larger random fluctuation than a single unit. This also shows how single channel noise can cause large macroscopic variations at the cellular scale. This random nature of Ca2+ oscillations at the whole-cell level has been shown and analysed in studies by Skupin et al. (2008) in different cell types and investigated in simulations (Skupin et al. 2010).
However, at high [Ca2+]o, the behaviours are different. Figure 3C shows the <ISI> and SD for [Ca2+]o= 10 mm. For a single uncoupled CRU, the <ISI> was shorter than at low Ca2+, averaging about 2.3 s with a SD of 1.1 s. Both the <ISI> and SD decreased as the number of CRUs increased and tended to saturate as the system size became large. Figure 3D shows the cytosolic Ca2+ concentrations versus time for a single CRU and an array of 100 × 20 coupled CRUs. Contrary to the low Ca2+ case, CRU coupling reduced randomness and accelerated the frequency of the Ca2+ wave oscillations. In other words, the Ca2+ wave oscillation frequency of the coupled system was faster and more periodic than that of the Ca2+ spark frequency of a single uncoupled element. This type of frequency enhancement has also been shown theoretically in coupled random FitzHugh-Nagumo oscillators (Chiang et al. 2011) and used to explain the frequency enhancement observed in cultured cardiac monolayers (Chen et al. 2009a).
Figure 4 summarizes the <ISI> and SD versus[Ca2+]o for a single CRU, an array of 20 × 20 CRUs, and an array of 100 × 20 CRUs, illustrating the transition from frequency suppression to frequency enhancement as [Ca2+]o increased. As [Ca2+]o increased from 3.1 mm to 10 mm, the <ISI> of the single CRU decreased from 5 s to about 2.5 s, and the SD from 2.3 s to 1.1 s, almost linearly. In the coupled networks, the <ISI> decreased exponentially from around 20 s to below 2 s, and so did the SD. The network switched from frequency suppression to frequency enhancement at around [Ca2+]o= 6 mm, i.e. for [Ca2+]o<6 mm, the frequency was lower in the coupled networks than that of a single uncoupled CRU, but for [Ca2+]o>6 mm, the frequency was higher in the coupled networks.
Figure 4. <ISI> ± SD versus[Ca2+]o for a single CRU (red), a 20 × 20 CRU network (green), and a 100 × 20 CRU network (blue).
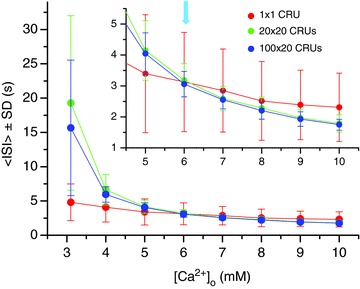
The inset is a blow-up for <ISI> ± SD from [Ca2+]o= 4.5 to 10 mm. The arrow in the inset indicates the change from frequency suppression to frequency enhancement, at which the <ISI> of a coupled network is shorter than that from a single uncoupled CRU.
Besides altering the Ca2+ level, this same behaviour was reproduced by changing other parameters. Figure 5 shows results obtained by changing the number of RyRs per CRU. For the low [Ca2+]o, the <ISI> decreased almost linearly from 8 s to 4.5 s in the single uncoupled CRU as the number of RyRs per CRU increased from 20 to 120, accompanied by a similar linear decay in SD (Fig. 5A). In an array of 20 × 20 CRUs (Fig. 5B), no waves were observed if the number of RyRs per CRU was smaller than 70, and the <ISI> and SD decayed very non-linearly with the RyR number per CRU, from 90 s to 13 s, as the RyR number per CRU increased from 75 to 120. For the high [Ca2+]o, the <ISI> decreased almost linearly from 3 s to 2 s as the RyR number per CRU increased from 20 to 120 (Fig. 5C). In an array of 20 × 20 CRUs (Fig. 5D), the <ISI> was longer and SD larger than those of the single CRU when the RyR number per CRU was less than 50, but the <ISI> was shorter and SD smaller than those of the single CRU when the RyR number per CRU was greater than 50.
Figure 5. Effects of the number of RyRs per CRU on Ca2+ excitation dynamics in a single CRU and a 20 × 20 CRU network.
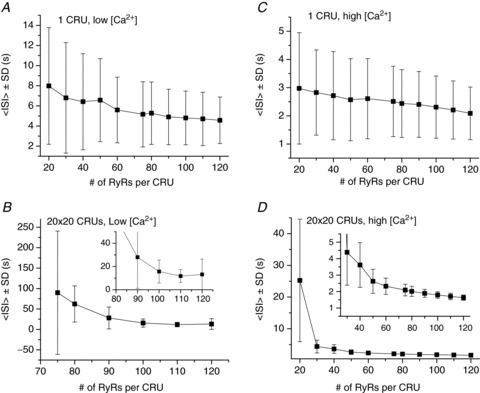
A, <ISI> ± SD versus RyR number for a single CRU at low Ca2+ ([Ca2+]o= 3.1 mm). B, <ISI> ± SD versus RyR number for a 20 × 20 CRU at low Ca2+ ([Ca2+]o= 3.1 mm). C, <ISI> ± SD versus RyR number for a single CRU at high Ca2+ ([Ca2+]o= 10 mm). D, <ISI> ± SD versus RyR number for a 20 × 20 CRU at high Ca2+ ([Ca2+]o= 10 mm). The insets in C and D are blow-ups for large RyR numbers.
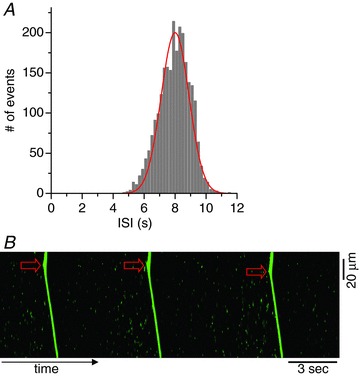
We also compared the ISI histograms for both low and high [Ca2+]o using very long simulations. Panels A–C of Fig. 6 show the results for high [Ca2+]o. In Fig. 6A and B, the ISI distribution of a single CRU (Fig. 6A) is non-Gaussian, resembled by a gamma distribution, whereas the ISI distribution for a 20 × 20 CRU network (Fig. 6B) was well-described by a Gaussian distribution. The range of ISI in the CRU network was much narrower than that for the single CRU. The return map of ISI for the CRU network (Fig. 6C) showed no structure, indicating that the consecutive firings were independent. Panels D–F of Fig. 6 show the results for the low [Ca2+]o. The ISI of the single CRU (Fig. 6D) was random and ranged from 0.3 to 14 s. The ISI of the CRU network (Fig. 6E), however, peaked at a value 10 times longer than that of the single CRU and had a fat tail. The return map (Fig. 6F) again showed no structure. The fat-tailed distribution in the low Ca2+ case resulted from runs of firings interspersed with occasional long pauses (see Fig. 3B). Note that at both low and high Ca2+, the variation in firing frequency of the single uncoupled CRU did not differ substantially, whereas their variation in the coupled network did. This indicates that these differences in firing properties emerged as a result of coupling between CRUs and dynamical organization, rather than the intrinsic properties of the single CRU per se.
Figure 6. ISI histograms and return maps for low and high Ca2+.
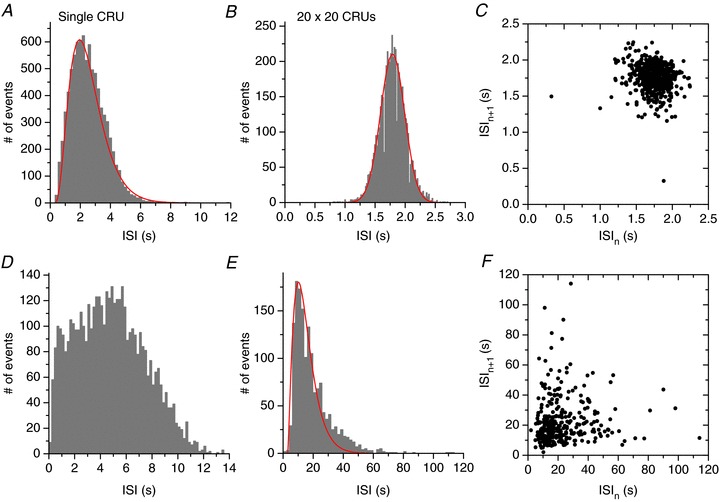
A, ISI histogram for high Ca2+ ([Ca2+]o= 10 mm) for a single CRU. The red curve is a reference distribution which is a gamma distribution function: h(x) = 0.0000135(x− 0.3)2.75
e−(x−0.3)/0.8 for x > 0.3 s. B, ISI histogram for high Ca2+ ([Ca2+]o= 10 mm) for a 20 × 20 CRU network. The red curve is a Gaussian distribution function: 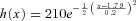 (x is in units of seconds). C, return map plotting ISIn+1
versus ISIn for the high Ca2+ case in B. D, ISI histogram for low Ca2+ ([Ca2+]o= 3.1 mm) for a single CRU. E, ISI histogram for low Ca2+ ([Ca2+]o= 3.1 mm) for a 20 × 20 CRU network. Red curve is a gamma distribution function: h(x) = 0.00132(x− 3)1.5
e−(x−3)/4.8 for x > 3 s. The fat tail cannot be captured by the gamma function. F, return map plotting ISIn+1
versus ISIn for the low Ca2+ case in E.
(x is in units of seconds). C, return map plotting ISIn+1
versus ISIn for the high Ca2+ case in B. D, ISI histogram for low Ca2+ ([Ca2+]o= 3.1 mm) for a single CRU. E, ISI histogram for low Ca2+ ([Ca2+]o= 3.1 mm) for a 20 × 20 CRU network. Red curve is a gamma distribution function: h(x) = 0.00132(x− 3)1.5
e−(x−3)/4.8 for x > 3 s. The fat tail cannot be captured by the gamma function. F, return map plotting ISIn+1
versus ISIn for the low Ca2+ case in E.
Random entrainment in heterogeneous CRU networks
Unlike a system of two deterministic coupled oscillators with resettable phases where the fastest oscillator always entrains the slowest one (Guevara & Glass, 1982; Zeng et al. 1991), entrainment in a random system is probabilistic and depends critically on the degree of overlap between the individual ISI distributions. To distinguish the latter case from a deterministic oscillator, classically known as a limit cycle, we adopt the term ‘random oscillator.’ As shown above, groups of CRUs, which do not limit cycles themselves, can self-organize into random oscillators, allowing us to recast our heterogeneous CRU network in a simplified manner as a system of two coupled random oscillators by imagining the heterogeneity (e.g. the 20 × 20 CRUs with the higher RyR density) as one random oscillator, and the rest of the CRU network as a second random oscillator. As we show below, the differences between ISI distributions of the two random oscillators at low and high [Ca2+]o account for the increasing degree of entrainment by the heterogeneity as Ca2+ increases.
Consider a system of two coupled random oscillators, and denote one random oscillator by F (for fast) and the other random oscillator by S (for slow), with ISI probability distributions pF(x) and pS(x), respectively (Fig. 7A). Assume that when one fires, it entrains the other with no delay. Then the probability of S entraining F is:
Figure 7. Theoretical analyses for random entrainment.
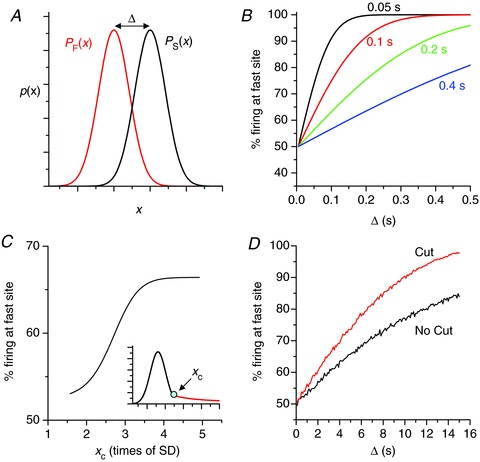
A, illustration of the distribution setup used in B. B, percentage of firing originating from the fast site versusΔ for different standard deviations (labelled) for Gaussian distribution:  (x is in units of seconds), obtained using eqns 5 and 6. μF= 2 s. C, percentage of firing originating from the fast site versus xc (as indicated in the inset) for asymmetric distribution. Δ= 1.5 s. The Gaussian distribution function is:
  and the fat tail is: h(x) =C2(x−x0)−1(x is in units of seconds). D, percentage of firing originating from the fast site versus the shift Δ from simulations using data from the histogram in Fig. 6E. Specifically, we assume that the two firing sites have the same ISI histogram as in Fig. 6E, one with a shift of Δ. In the case of fat-tail cutting (red curve), the ISIs greater than 25 s were dropped.
| (5) |
Specifically, eqn (5) can be obtained as follows. The probability that F will fire at time y after the previous firing is pF(y). However, any firing from S earlier than y will entrain site F. Therefore, the conditional probability that a predicted firing of F at time y does not occur is 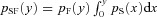 . Summing up all possible firing intervals in site F, one obtains eqn (5). Similarly, the probability of F entraining S is:
| (6) |
These two equations form the basis of our theory of random entrainment.
One can show that if F and S are Gaussian-distributed with means μF and μS, and SDs σF and σS, respectively, then the probability that a random number chosen from distribution F is greater than one chosen from S is also Gaussian-distributed with mean μF–μS and SD  , with pFS equal to the area under the curve in the left-half plane. Using this formulation, one can show that F entrains S only as μF–μS surpasses
  . Figure 8B shows the percentage of firing from F versus the shift Δ (=μF–μS) for different SDs (σ), showing that the entrainment increases with Δ and decreases with σ. The results are intuitive, i.e. for larger Δ or smaller σ, the two distributions overlap less, and thus the fast one can better entrain the slow one. This simple result may be sufficient to explain the observations in experiments and in our simulations that Ca2+ waves tended to originate from roughly the same location at high Ca2+ but occurred randomly in space and time at low Ca2+. That is, the SD at low Ca2+ is much larger than that at high Ca2+. Even though the difference in firing frequency is also larger, the very large SD at low Ca2+ causes the fast region to fail to entrain the slow region.
Figure 8. Effects of decreased CRU spacing on ISI and entrainment at low Ca2+ ([Ca2+]o= 3.1 mm).
A, ISI histogram from a 20 × 20 CRU network with CRU spacing 0.8 μm. The red curve is a Gaussian distribution function: 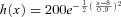 (x is in units of seconds). B, Ca2+ wave initiation sites in a 100 × 20 CRU network cell model. Arrows indicate the wave initiation sites. A heterogeneous region (25 × 25 CRUs) with CRU spacing decreased from 1.0 μm to 0.8 μm was included in the left of the network.
In addition to the broadness of the distribution, the fat tail of the ISI distribution at low Ca2+ levels may also contribute to the reduction of entrainment. The long ISIs in the fat tail allow short firings to occur from the slow site and entrain the fast site, reducing the efficacy of the fast site entraining the slow site. To study this effect, we truncated the Gaussian distribution at the right side and added a fat tail (in the form C(x−x0)−1). Figure 7C shows the percentage of firing from the fast site versus the joint point (xc) of the combined distributions, showing that adding the tail reduces the entrainment. We also performed computer simulations using the ISI data for the computer simulation of a CRU network shown in Fig. 6E, showing that cutting the fat tail enhances entrainment (Fig. 7D).
Discussion
The transition from Ca2+ sparks to Ca2+ waves and oscillations has been the subject of many experimental (Cheng et al. 1996; Parker et al. 1996; Bootman et al. 1997; Wier et al. 1997; Callamaras et al. 1998; Marchant et al. 1999; Marchant & Parker, 2001) and simulation (Falcke, 2003; Izu et al. 2006; Skupin & Falcke, 2009; Skupin et al. 2010; Nivala et al. 2012b) studies. In our previous study (Nivala et al. 2012b), we showed that, in the transition from sparks to waves, spark clusters self-organize due to CICR. This process exhibits a power-law distribution, which is a hallmark of criticality, a dynamical phenomenon widely studied in statistical physics (Stanley, 1999) and in many natural systems (Bak, 1997). In this study, we used computer simulation to further study the dynamics underlying the transition from sparks to waves and global cell-wide oscillations by comparing the Ca2+ release dynamics in a single CRU to that in coupled CRU networks with or without subcellular heterogeneities. Our simulation results and theoretical analyses provide mechanistic insights into a variety of experimental observations relating to the origin of Ca2+ waves underlying Ca2+ oscillations and pacemaking by Ca2+ clocks in biological cells.
Dynamical organization in spark-to-wave transitions and oscillations
A Ca2+ spark may cause a neighbouring CRU to fire via Ca2+ diffusion and CICR, which may then cause its neighbours to fire, and so on. If this chain process is persistent, a Ca2+ wave forms and propagates. This is commonly observed in experiments and is considered as the mechanism by which Ca2+ sparks initiate Ca2+ waves (Cheng et al. 1996; Wier et al. 1997; Keizer & Smith, 1998; Keizer et al. 1998). However, the persistence of the chain of spark-induced sparks may not be sustainable due to the random latency of CRU firing and the recovery of neighbouring CRUs from spontaneous firings. In fact, the vast majority of sparks in a cell do not initiate Ca2+ waves (Cheng et al. 1996; Wier et al. 1997). Our previous study (Nivala et al. 2012b) showed that the spark-to-wave transition is similar to a second-order phase transition in statistical physics. At very low Ca2+ levels, Ca2+ sparks occur randomly and sparsely, and thus, no macroscopic Ca2+ events occur. As Ca2+ increases, Ca2+ sparks form clusters with the cluster size distribution exhibiting a power-law, inducing large fluctuations in the local Ca2+ concentration, which eventually trigger macroscopic Ca2+ waves. As Ca2+ increases further, CRUs fire in a more synchronous manner, and the global Ca2+ signal becomes more periodic. This provides a formal theoretical basis for the spark-to-wave transitions and long-range correlations observed in intracellular Ca2+ signalling.
In this study, our computer simulations show that the spiking behaviour of groups of CRUs cannot be decomposed into the individual dynamics of the CRUs themselves. When the interaction between CRUs is weak (e.g. at low Ca2+ levels or low RyR or IP3 receptor density), the frequency of global firing in a CRU network is much slower than that of a single CRU. This indicates that the organization process for wave initiation dominates over the time dynamics of single CRU firings (sparks), implying that a dynamic time scale for sparks to self-organize into global events has emerged from the CRU network. In other words, the time scale to form a cluster of sufficient size to initiate a Ca2+ wave is very long compared to the sparking rate of individual CRUs, so that a CRU is more likely to be activated as a primary spark and only occasionally as a secondary spark triggered by a Ca2+ wave. This directly agrees with the experimental observations in cultured human neuroblastoma SH-SY5Y cells by Thurley et al. (2011)). As shown by our statistics (Fig. 6E), this dynamic time scale exhibits a fat-tailed distribution, a hallmark of self-organization and criticality.
At high Ca2+ levels, on the other hand, the global firing frequency is faster than the individual firing frequency of a single uncoupled CRU. Since at high Ca2+, RyRs are more sensitive, a firing CRU has a high probability of recruiting its neighbours to fire, accelerating the global firing frequency. In this case, the dynamic time scale is limited by RyR recovery time and SR refilling time. In other words, the time scale to form a cluster of sufficient size to initiate a Ca2+ wave becomes shorter than the sparking rate of an isolated uncoupled CRU, such that most CRUs are activated as secondary sparks by the Ca2+ wave before they fire spontaneously as primary sparks. This acceleration of firing in coupled CRU networks at high [Ca2+]o is similar to the frequency enhancement shown in coupled random FitzHugh-Nagumo oscillators (Chiang et al. 2011) in which the frequency of the coupled oscillators is faster than the uncoupled ones. Note that altering [Ca2+]o or RyR density alters the firing frequency of the single CRU, mostly in a linear manner, but the effect on the global firing frequency is much larger and non-linear, indicating that the interaction (or coupling) between the CRUs plays an important role. The coupling effect can be directly demonstrated in computer simulations by changing the distance between CRUs, i.e. the closer the CRUs, the stronger the coupling. Figure 8A shows an ISI histogram from a 20 × 20 CRU network for low Ca2+ ([Ca2+]o= 3.1 mm), in which the CRU spacing was changed from 1 μm to 0.8 μm. The <ISI> became much shorter (from ∼20 s to ∼8 s), and the SD much smaller (from ∼13 s to ∼1 s). The distribution lost its fat tail and resembled a Gaussian distribution. The effect of CRU spacing on Ca2+ wave formation was studied previously in computer simulations by Izu et al. (2006)), with similar results.
Roles of subcellular heterogeneities
In uniform models such as the CRU network simulated in our previous study (Nivala et al. 2012b), Ca2+ waves organized randomly in space. However, real cells are not uniform and heterogeneities exist, for example, in the number of RyRs (or IP3 receptors) per CRU, distances between neighbouring CRUs, and discontinuities caused by other intracellular organelles and membrane invaginations (Soeller et al. 2007; Baddeley et al. 2009). In heterogeneous deterministically excitable systems, the fastest firing site (even if it is only slightly faster than the others) always entrains the whole system, unless conduction breaks occur between firing sites (Xie et al. 2001b; Qu & Weiss, 2005). In heterogeneous randomly excitable systems, however, the randomness of the firings allows entrainment to be intermittent. As shown in our theoretical analysis, the rate of entrainment depends not only on the difference in firing rates, but also on the broadness and the shape of the ISI distribution. In our simulations, the ISI distribution is much narrower at high Ca2+ than at low Ca2+, making entrainment much more efficient at high Ca2+, explaining our experimental observations. Furthermore, the fat-tailed ISI morphology that results from a system being near criticality significantly contributes to the failure of entrainment at low Ca2+.
In heterogeneous excitable systems, the spatial scale of heterogeneity plays an important role for the wave behaviours (Xie et al. 2001a). As shown in Fig. 2D, the entrainment depends on the size of the heterogeneity. In fact, if we increase the number of RyRs from 100 to 110 in 20% of CRUs whose spatial location is chosen randomly from a uniform distribution, then entrainment is lost, and wave dynamics are similar to a homogeneous system. We also used a Gaussian distribution of RyR cluster size (with an average 100 RyRs and standard deviation 10) in our simulation and failed to observe the formation of stable pacemaker sites at high Ca2+. Instead, we still observed pacemaker sites occurring randomly in space as in the homogeneous system. Therefore, the spatial scale or correlation of RyR cluster size heterogeneity is important for the formation of stable pacemaker sites. Since, to our knowledge, the spatial correlation of RyR cluster size in cardiac myocytes has yet to be characterized experimentally, we chose to use a very simple yet extreme form of heterogeneity to study the effects of heterogeneities in CRU networks in the present study. Even though our heterogeneous CRU network model is not physiologically realistic, this extreme case is useful because it demonstrates that even with such an extreme heterogeneity, the effects of the heterogeneity are minimal at low Ca2+ and are only unmasked at high Ca2+. We believe that the general mechanisms of random entrainment will still hold in more realistic heterogeneous systems. In addition, real cells most likely contain multiple heterogeneities, and our theory of random entrainment is easily generalized to more than two coupled random oscillators. In such cases, the degree to which each pacemaker region entrains cellular oscillations depends on the relative overlap of multiple ISI distributions, and multiple pacemaker sites can co-exist.
It should be noted that the scenario in which entrainment occurs at high Ca2+ but fails at low Ca2+ is only relative. If the system is highly heterogeneous such that the heterogeneous region has a much narrower distribution and faster frequency than other regions, entrainment can still occur at low Ca2+. This is demonstrated in a simulation shown in Fig. 8, in which we made the CRU spacing shorter (from CRU spacing 1 μm to 0.8 μm) at low Ca2+ and found that almost all firings originated from the heterogeneous region. In this case, entrainment occurs because the ISI is shorter and much less variable than for control CRU spacing.
It is also important to note that individual CRUs in a heterogeneous region do not oscillate periodically as limit cycles when uncoupled. Periodic pacemaking is still a self-organized phenomenon of a group of randomly firing CRUs. As shown in our simulations, when the coupled CRU network exhibits a strong periodicity, the frequency is faster and much less variable than a single CRU. Thus, the periodicity of the pacemaker site depends strongly and directly on the coupling between CRUs.
Implications for Ca2+ cycling dynamics in the heart
Intracellular Ca2+ cycling in cardiac systems is not only required for excitation–contraction coupling but also plays important roles in generating both the normal heart rhythm under physiological conditions (Lakatta et al. 2010) and life-threatening arrhythmias under pathophysiological conditions of Ca2+ overload (ter Keurs & Boyden, 2007). Results from this and our previous study (Nivala et al. 2012b) may provide new mechanistic insights into these dynamics.
For example, heart rate variability during sinus rhythm has been shown to exhibit power-law (fractal) behaviours (Kobayashi & Musha, 1982; Ivanov et al. 1996). This feature is often attributed to autonomic tone, but cardiac preparations which lack autonomic innervation, such as cultured neonatal cardiac monolayers (Kucera et al. 2000; Ponard et al. 2007), also exhibited a power-law distribution of beating intervals. Although simulations suggested that a Poisson distribution of ion channel protein turnover fluctuations could give rise to power-law behaviour of heart rate variability in this setting, our findings may provide an alternative mechanism related to Ca2+ cycling, which is now recognized, together with voltage-dependent oscillations, to play a fundamental role in sino-atrial nodal pacemaking (Vinogradova & Lakatta, 2009; Vinogradova et al. 2010). Prior to the action potential upstroke, the occurrence of local Ca2+ releases increases inward Na+–Ca2+ exchanger current to facilitate diastolic depolarization. The local Ca2+ releases occur more or less randomly in space and time, and their periods, which vary from beat to beat, correlate linearly with the cycle lengths of sino-atrial nodal cell oscillations. The local Ca2+ releases are not random single sparks but rather self-organized spark clusters, as also demonstrated in a recent modelling study (Maltsev et al. 2011). It is intriguing to speculate that during the transition from Ca2+ sparks to whole-cell oscillations, the power-law spark clustering and fat-tailed ISI distribution occur via criticality, potentially contributing to the power-law behaviour in heart rate variability. This is a promising area for future sino-atrial nodal cell and cell network modelling.
Under pathophysiological conditions in atrial and ventricular myocytes and in Purkinje cells, Ca2+ waves activate Ca2+-sensitive inward currents such as Na+–Ca2+ exchanger to cause delayed after-depolarizations (DADs), which are arrhythmogenic (ter Keurs & Boyden, 2007). In multicellular tissue, however, a Ca2+ wave from a single myocyte cannot generate enough inward current to cause a DAD since its resting voltage is clamped by the neighbouring myocytes without Ca2+ waves (Fujiwara et al. 2008). To overcome this source–sink mismatch, Ca2+ waves have to occur synchronously in tens to thousands for a DAD to occur (Xie et al. 2010). Our results may help to explain how this happens, since as Ca2+ increases, the <ISI> and SD of Ca2+ waves both decrease markedly (Fig. 2). In coupled myocytes with similar Ca2+ cycling properties, this would naturally lead to a synchronization of the timing of Ca2+ waves in neighbouring myocytes as the Ca2+ load increased, as observed in multicellular tissue when Ca2+ loading has been varied by rapid pacing (Fujiwara et al. 2008; Wasserstrom et al. 2010). In failing hearts or genetic models of catecholaminergic polymorphic ventricular tachycardia, RyRs are more sensitive to Ca2+ and thus leakier. Even though SR Ca2+ load is lower, the increase in RyR sensitivity may enhance CRU coupling, which facilitates Ca2+ wave formation and DADs. Moreover, in failing myocytes, the CRU spacing becomes shorter (Chen-Izu et al. 2007) and facilitates wave formation. Heterogeneity may also be enhanced in failing myocytes due to T-tubule disruption and disorganization to promote Ca2+ waves.
An important question is what determines the timing of the occurrence of Ca2+ waves in cardiac myocytes. Sobie et al. (2006) and Ramay et al. (2011) showed that the time constant of recovery of Ca2+ spark amplitude is ∼100 ms, and the intervals between consecutive sparks are on the order of a couple of hundred milliseconds. The recovery time constant is determined by SR refilling and RyR sensitivity. Brochet et al. (2005) have shown that the local SR refilling time is less than 100 ms. Therefore, if the occurrence of Ca2+ waves was determined by the refractory period and SR refilling time, Ca2+ waves should occur at intervals on the order of a couple of hundred milliseconds. However, Ca2+ waves occur at intervals of seconds or even longer, which are much longer than the SR refilling time and the recovery time of the CRU, indicating that the occurrence of Ca2+ waves is not solely determined by CRU refractoriness and SR refilling. In a recent experimental study, Belevych et al. (2012) demonstrated that Ca2+ waves occur in a certain time period, which they call the ‘idle period,’ after the RyRs are recovered from inactivation and the SR is refilled. Our study shows that Ca2+ waves are emergent properties of the CRU network, which depends not only on the properties of the individual CRUs, but also strongly on the coupling between CRUs. The idle period identified by Belevych et al. is thus the time for sparks to self-organize into waves, i.e. the idle period is the self-organization period for a critical size of spark clusters to form and initiate a wave.
Limitations
The Ca2+ cycling model in this study was developed based on the ventricular myocyte and may be too specific to extrapolate the details of Ca2+ cycling dynamics in other types of cells in which the CRUs consist of IP3 receptor clusters (Falcke, 2003; Shuai & Jung, 2003). Conversely, the detailed subcellular structure of ventricular myocytes and regulation of CRUs are much more complex than the simple heterogeneities modelled in this study (Soeller & Cannell, 1999; Soeller et al. 2007; Baddeley et al. 2009; Hake et al. 2012). The CRUs are identical in our models, but in real cells, even in ventricular myocytes, they are not. For example, CRUs close to the cell surface exhibit different sarcolemma ion channels than those deep inside the cell. These may cause additional interesting dynamics. In addition, different RyR models (Jafri et al. 1998; Stern et al. 1999; Sobie et al. 2002; Restrepo et al. 2008; Chen et al. 2009b) may give rise to different whole-cell Ca2+ cycling dynamics, which need to be further investigated in modelling studies.
The computational simulations were done using a model of a myocyte with an intact sarcolemma in which Ca2+ content in the cell was changed by altering [Ca2+]o. Experimentally, however, it is difficult to control the Ca2+ level in an intact cell by changing [Ca2+]o. Therefore, the experiments were performed on permeabilized cells, allowing intracellular Ca2+ to be directly controlled, after verifying that similar results were obtained in the model when the sarcolemma was removed to simulate a permeabilized cell. We feel justified in this approach since it was not the purpose of the present study to obtain strict quantitative agreement between the experiments and the modelling but rather to develop a general dynamical theory for pacemaker generation in cardiac myocytes.
Despite these limitations, our present study provides novel mechanistic insights into how the microscopic random events of intracellular Ca2+ cycling (Ca2+ sparks) integrate into global events like Ca2+ waves and oscillations in cardiac myocytes and in other cell types, as well as general insights into the collective dynamics of coupled random excitable elements.
Acknowledgments
We thank Alan Garfinkel, Hrayr Karagueuzian, Riccardo Olcese, and the members of the UCLA arrhythmia group for helpful comments, Rahil D. Patel for cell preparation, and Guillaume Calmettes for help in statistical analysis.
Glossary
- Ca2+
calcium
- CI
confidence interval
- CICR
calcium-induced calcium release
- CRU
calcium release unit
- DAD
delayed after-depolarization
- DS
dyadic space
- IP3
inositol 1,4,5-trisphoshate
- ISD
inter-wave initiation site distance
- ISI
interspike interval
- jSR
junctional sarcoplasmic reticulum
- NSR
network sarcoplasmic reticulum
- Myo
myoplasm
- LCC
L-type calcium channel
- RyR
ryanodine receptor
- SD
standard deviation
- SR
sarcoplasmic reticulum. 2-D, two-dimensional
- 3-D
three-dimensional
Additional information
Competing interests
None.
Author contributions
All authors contributed to the research design, data analysis, manuscript drafting and revision; M.N. and M.N. carried out the computer programming and simulations; C.K. did the myocyte experiments and statistical analysis; M.N. and Z.Q. developed the theory; Z.Q. conceived the overall research. All authors have read and approved the final version of the manuscript.
Funding
This work was supported by National Institute of Health grant P01 HL078931; American Heart Association, Western States Affiliate, Postdoctoral Fellowship Award 10POST3210024 (M.N.), Predoctoral Fellowship Award 10PRE3030052 (C.K.); the Laubisch and Kawata Endowments; and the UCLA Cardiovascular Development Fund (M.N.).
References
- Anderson ME, Brown JH, Bers DM. CaMKII in myocardial hypertrophy and heart failure. J Mol Cell Cardiol. 2011;51:468–473. doi: 10.1016/j.yjmcc.2011.01.012. [DOI] [PMC free article] [PubMed] [Google Scholar]
- Baddeley D, Jayasinghe ID, Lam L, Rossberger S, Cannell MB, Soeller C. Optical single-channel resolution imaging of the ryanodine receptor distribution in rat cardiac myocytes. Proc Natl Acad Sci U S A. 2009;106:22275–22280. doi: 10.1073/pnas.0908971106. [DOI] [PMC free article] [PubMed] [Google Scholar]
- Bak P. How Nature Works: The Science of Self-Organized Criticality. New York: Oxford University Press; 1997. [Google Scholar]
- Belevych AE, Terentyev D, Terentyeva R, Ho HT, Gyorke I, Bonilla IM, Carnes CA, Billman GE, Gyorke S. Shortened Ca2+ signalling refractoriness underlies cellular arrhythmogenesis in a postinfarction model of sudden cardiac death. Circ Res. 2012;110:569–577. doi: 10.1161/CIRCRESAHA.111.260455. [DOI] [PMC free article] [PubMed] [Google Scholar]
- Berridge MJ, Lipp P, Bootman MD. The versatility and universality of calcium signalling. Nat Rev Mol Cell Biol. 2000;1:11–21. doi: 10.1038/35036035. [DOI] [PubMed] [Google Scholar]
- Bers DM. Cardiac excitation–contraction coupling. Nature. 2002;415:198–205. doi: 10.1038/415198a. [DOI] [PubMed] [Google Scholar]
- Bootman MD, Berridge MJ, Lipp P. Cooking with calcium: the recipes for composing global signals from elementary events. Cell. 1997;91:367–373. doi: 10.1016/s0092-8674(00)80420-1. [DOI] [PubMed] [Google Scholar]
- Brochet DX, Yang D, Di Maio A, Lederer WJ, Franzini-Armstrong C, Cheng H. Ca2+ blinks: rapid nanoscopic store calcium signalling. Proc Natl Acad Sci U S A. 2005;102:3099–3104. doi: 10.1073/pnas.0500059102. [DOI] [PMC free article] [PubMed] [Google Scholar]
- Callamaras N, Marchant JS, Sun XP, Parker I. Activation and co-ordination of InsP3-mediated elementary Ca2+ events during global Ca2+ signals in Xenopus oocytes. J Physiol. 1998;509:81–91. doi: 10.1111/j.1469-7793.1998.081bo.x. [DOI] [PMC free article] [PubMed] [Google Scholar]
- Calmettes G, Drummond GB, Vowler SL. Making do with what we have: use your bootstraps. J Physiol. 2012;590:3403–3406. doi: 10.1113/jphysiol.2012.239376. [DOI] [PMC free article] [PubMed] [Google Scholar]
- Capogrossi MC, Kort AA, Spurgeon HA, Lakatta EG. Single adult rabbit and rat cardiac myocytes retain the Ca2+- and species-dependent systolic and diastolic contractile properties of intact muscle. J Gen Physiol. 1986;88:589–613. doi: 10.1085/jgp.88.5.589. [DOI] [PMC free article] [PubMed] [Google Scholar]
- Capogrossi MC, Lakatta EG. Frequency modulation and synchronization of spontaneous oscillations in cardiac cells. Am J Physiol Heart Circ Physiol. 1985;248:H412–H418. doi: 10.1152/ajpheart.1985.248.3.H412. [DOI] [PubMed] [Google Scholar]
- Chen W, Cheng SC, Avalos E, Drugova O, Osipov G, Lai P-Y, Chan CK. Synchronization in growing heterogeneous media. EPL (Europhysics Letters) 2009a;86:18001. [Google Scholar]
- Chen W, Wasserstrom JA, Shiferaw Y. Role of coupled gating between cardiac ryanodine receptors in the genesis of triggered arrhythmias. Am J Physiol Heart Circ Physiol. 2009b;297:H171–H180. doi: 10.1152/ajpheart.00098.2009. [DOI] [PubMed] [Google Scholar]
- Cheng H, Lederer MR, Lederer WJ, Cannell MB. Calcium sparks and [Ca2+]i waves in cardiac myocytes. Am J Physiol Cell Physiol. 1996;270:C148–C159. doi: 10.1152/ajpcell.1996.270.1.C148. [DOI] [PubMed] [Google Scholar]
- Cheng H, Lederer WJ. Calcium sparks. Physiol Rev. 2008;88:1491–1545. doi: 10.1152/physrev.00030.2007. [DOI] [PubMed] [Google Scholar]
- Chen-Izu Y, Ward CW, Stark W, Jr, Banyasz T, Sumandea MP, Balke CW, Izu LT, Wehrens XH. Phosphorylation of RyR2 and shortening of RyR2 cluster spacing in spontaneously hypertensive rat with heart failure. Am J Physiol Heart Circ Physiol. 2007;293:H2409–H2417. doi: 10.1152/ajpheart.00562.2007. [DOI] [PubMed] [Google Scholar]
- Chiang WY, Lai PY, Chan CK. Frequency enhancement in coupled noisy excitable elements. Phys Rev Lett. 2011;106:254102. doi: 10.1103/PhysRevLett.106.254102. [DOI] [PubMed] [Google Scholar]
- Efron B, Tibshirani R. Statistical data analysis in the computer age. Science. 1991;253:390–395. doi: 10.1126/science.253.5018.390. [DOI] [PubMed] [Google Scholar]
- Falcke M. On the role of stochastic channel behaviour in intracellular Ca2+ dynamics. Biophys J. 2003;84:42–56. doi: 10.1016/S0006-3495(03)74831-0. [DOI] [PMC free article] [PubMed] [Google Scholar]
- Fujiwara K, Tanaka H, Mani H, Nakagami T, Takamatsu T. Burst emergence of intracellular Ca2+ waves evokes arrhythmogenic oscillatory depolarization via the Na+–Ca2+ exchanger: simultaneous confocal recording of membrane potential and intracellular Ca2+ in the heart. Circ Res. 2008;103:509–518. doi: 10.1161/CIRCRESAHA.108.176677. [DOI] [PubMed] [Google Scholar]
- Gillespie DT( Exact stochastic simulation of coupled chemical reactions. J Phys Chem. 1977;81:2340–2361. [Google Scholar]
- Guevara MR, Glass L. Phase locking, period doubling bifurcations and chaos in a mathematical model of a periodically driven oscillator: a theory for the entrainment of biological oscillators and the generation of cardiac dysrhythmias. J Math Biol. 1982;14:1–23. doi: 10.1007/BF02154750. [DOI] [PubMed] [Google Scholar]
- Hake J, Edwards AG, Yu Z, Kekenes-Huskey PM, Michailova AP, McCammon JA, Holst MJ, Hoshijima M, McCulloch AD. Modeling cardiac calcium sparks in a three-dimensional reconstruction of a calcium release unit. J Physiol. 2012;590:4403–4422. doi: 10.1113/jphysiol.2012.227926. [DOI] [PMC free article] [PubMed] [Google Scholar]
- Ivanov PC, Rosenblum MG, Peng CK, Mietus J, Havlin S, Stanley HE, Goldberger AL. Scaling behaviour of heartbeat intervals obtained by wavelet-based time series analysis. Nature. 1996;383:323–327. doi: 10.1038/383323a0. [DOI] [PubMed] [Google Scholar]
- Izu LT, Means SA, Shadid JN, Chen-Izu Y, Balke CW. Interplay of ryanodine receptor distribution and calcium dynamics. Biophys J. 2006;91:95–112. doi: 10.1529/biophysj.105.077214. [DOI] [PMC free article] [PubMed] [Google Scholar]
- Jafri MS, Rice JJ, Winslow RL. Cardiac Ca2+ dynamics: the roles of ryanodine receptor adaptation and sarcoplasmic reticulum load. Biophys J. 1998;74:1149–1168. doi: 10.1016/S0006-3495(98)77832-4. [DOI] [PMC free article] [PubMed] [Google Scholar]
- Kasai H, Li YX, Miyashita Y. Subcellular distribution of Ca2+ release channels underlying Ca2+ waves and oscillations in exocrine pancreas. Cell. 1993;74:669–677. doi: 10.1016/0092-8674(93)90514-q. [DOI] [PubMed] [Google Scholar]
- Keizer J, Smith GD. Spark-to-wave transition: saltatory transmission of calcium waves in cardiac myocytes. Biophys Chem. 1998;72:87–100. doi: 10.1016/s0301-4622(98)00125-2. [DOI] [PubMed] [Google Scholar]
- Keizer J, Smith GD, Ponce-Dawson S, Pearson JE. Saltatory propagation of Ca2+ waves by Ca2+ sparks. Biophys J. 1998;75:595–600. doi: 10.1016/S0006-3495(98)77550-2. [DOI] [PMC free article] [PubMed] [Google Scholar]
- Kobayashi M, Musha T. 1/f fluctuation of heartbeat period. IEEE Trans Biomed Eng. 1982;29:456–457. doi: 10.1109/TBME.1982.324972. [DOI] [PubMed] [Google Scholar]
- Kucera JP, Heuschkel MO, Renaud P, Rohr S. Power-law behavior of beat-rate variability in monolayer cultures of neonatal rat ventricular myocytes. Circ Res. 2000;86:1140–1145. doi: 10.1161/01.res.86.11.1140. [DOI] [PubMed] [Google Scholar]
- Lakatta EG, Maltsev VA, Vinogradova TM. A coupled system of intracellular Ca2+ clocks and surface membrane voltage clocks controls the timekeeping mechanism of the heart's pacemaker. Circ Res. 2010;106:659–673. doi: 10.1161/CIRCRESAHA.109.206078. [DOI] [PMC free article] [PubMed] [Google Scholar]
- Mahajan A, Shiferaw Y, Sato D, Baher A, Olcese R, Xie L-H, Yang M-J, Chen P-S, Restrepo JG, Karma A, Garfinkel A, Qu Z, Weiss JN. A rabbit ventricular action potential model replicating cardiac dynamics at rapid heart rates. Biophys J. 2008;94:392–410. doi: 10.1529/biophysj.106.98160. [DOI] [PMC free article] [PubMed] [Google Scholar]
- Maltsev AV, Maltsev VA, Mikheev M, Maltseva LA, Sirenko SG, Lakatta EG, Stern MD. Synchronization of stochastic Ca2+ release units creates a rhythmic Ca2+ clock in cardiac pacemaker cells. Biophys J. 2011;100:271–283. doi: 10.1016/j.bpj.2010.11.081. [DOI] [PMC free article] [PubMed] [Google Scholar]
- Manly BFJ. Randomization, bootstrap and Monte Carlo methods in biology. Boca Raton, FL, USA: CRC Press; 1997. [Google Scholar]
- Marchant J, Callamaras N, Parker I. Initiation of IP3-mediated Ca2+ waves in Xenopus oocytes. EMBO J. 1999;18:5285–5299. doi: 10.1093/emboj/18.19.5285. [DOI] [PMC free article] [PubMed] [Google Scholar]
- Marchant JS, Parker I. Role of elementary Ca2+ puffs in generating repetitive Ca2+ oscillations. EMBO J. 2001;20:65–76. doi: 10.1093/emboj/20.1.65. [DOI] [PMC free article] [PubMed] [Google Scholar]
- Nivala M, de Lange E, Rovetti R, Qu Z. Computational modelling and numerical methods for spatiotemporal calcium cycling in ventricular myocytes. Front Physiol. 2012a;3:114. doi: 10.3389/fphys.2012.00114. [DOI] [PMC free article] [PubMed] [Google Scholar]
- Nivala M, Ko CY, Nivala M, Weiss JN, Qu Z. Criticality in intracellular calcium signalling in cardiac myocytes. Biophys J. 2012b;102:2433–2442. doi: 10.1016/j.bpj.2012.05.001. [DOI] [PMC free article] [PubMed] [Google Scholar]
- Parker I, Choi J, Yao Y. Elementary events of InsP3-induced Ca2+ liberation in Xenopus oocytes: hot spots, puffs and blips. Cell Calcium. 1996;20:105–121. doi: 10.1016/s0143-4160(96)90100-1. [DOI] [PubMed] [Google Scholar]
- Ponard JG, Kondratyev AA, Kucera JP. Mechanisms of intrinsic beating variability in cardiac cell cultures and model pacemaker networks. Biophys J. 2007;92:3734–3752. doi: 10.1529/biophysj.106.091892. [DOI] [PMC free article] [PubMed] [Google Scholar]
- Qu Z, Weiss JN. Effects of Na+ and K+ channel blockade on vulnerability to and termination of fibrillation in simulated normal cardiac tissue. Am J Physiol Heart Circ Physiol. 2005;289:H1692–H1701. doi: 10.1152/ajpheart.00241.2005. [DOI] [PubMed] [Google Scholar]
- Ramay HR, Liu OZ, Sobie EA. Recovery of cardiac calcium release is controlled by sarcoplasmic reticulum refilling and ryanodine receptor sensitivity. Cardiovasc Res. 2011;91:598–605. doi: 10.1093/cvr/cvr143. [DOI] [PMC free article] [PubMed] [Google Scholar]
- Restrepo JG, Weiss JN, Karma A. Calsequestrin-mediated mechanism for cellular calcium transient alternans. Biophys J. 2008;95:3767–3789. doi: 10.1529/biophysj.108.130419. [DOI] [PMC free article] [PubMed] [Google Scholar]
- Rooney TA, Sass EJ, Thomas AP. Agonist-induced cytosolic calcium oscillations originate from a specific locus in single hepatocytes. J Biol Chem. 1990;265:10792–10796. [PubMed] [Google Scholar]
- Rovetti R, Cui X, Garfinkel A, Weiss JN, Qu Z. Spark-induced sparks as a mechanism of intracellular calcium alternans in cardiac myocytes. Circ Res. 2010;106:1582–1591. doi: 10.1161/CIRCRESAHA.109.213975. [DOI] [PMC free article] [PubMed] [Google Scholar]
- Shuai JW, Jung P. Optimal ion channel clustering for intracellular calcium signalling. Proc Natl Acad Sci U S A. 2003;100:506–510. doi: 10.1073/pnas.0236032100. [DOI] [PMC free article] [PubMed] [Google Scholar]
- Simpson PB, Mehotra S, Lange GD, Russell JT. High density distribution of endoplasmic reticulum proteins and mitochondria at specialized Ca2+ release sites in oligodendrocyte processes. J Biol Chem. 1997;272:22654–22661. doi: 10.1074/jbc.272.36.22654. [DOI] [PubMed] [Google Scholar]
- Skupin A, Falcke M. From puffs to global Ca2+ signals: how molecular properties shape global signals. Chaos. 2009;19:037111. doi: 10.1063/1.3184537. [DOI] [PubMed] [Google Scholar]
- Skupin A, Kettenmann H, Falcke M. Calcium signals driven by single channel noise. PLoS Comput Biol. 2010;6:e1000870. doi: 10.1371/journal.pcbi.1000870. [DOI] [PMC free article] [PubMed] [Google Scholar]
- Skupin A, Kettenmann H, Winkler U, Wartenberg M, Sauer H, Tovey SC, Taylor CW, Falcke M. How does intracellular Ca2+ oscillate: by chance or by the clock. Biophys J. 2008;94:2404–2411. doi: 10.1529/biophysj.107.119495. [DOI] [PMC free article] [PubMed] [Google Scholar]
- Sobie EA, Dilly KW, dos Santos Cruz J, Lederer WJ, Jafri MS. Termination of cardiac Ca2+ sparks: an investigative mathematical model of calcium-induced calcium release. Biophys J. 2002;83:59–78. doi: 10.1016/s0006-3495(02)75149-7. [DOI] [PMC free article] [PubMed] [Google Scholar]
- Sobie EA, Song LS, Lederer WJ. Restitution of Ca2+ release and vulnerability to arrhythmias. J Cardiovasc Electrophysiol. 2006;17(Suppl. 1):S64–S70. doi: 10.1111/j.1540-8167.2006.00385.x. [DOI] [PMC free article] [PubMed] [Google Scholar]
- Soeller C, Cannell MB. Examination of the transverse tubular system in living cardiac rat myocytes by 2-photon microscopy and digital image–processing techniques. Circ Res. 1999;84:266–275. doi: 10.1161/01.res.84.3.266. [DOI] [PubMed] [Google Scholar]
- Soeller C, Crossman D, Gilbert R, Cannell MB. Analysis of ryanodine receptor clusters in rat and human cardiac myocytes. Proc Natl Acad Sci U S A. 2007;104:14958–14963. doi: 10.1073/pnas.0703016104. [DOI] [PMC free article] [PubMed] [Google Scholar]
- Stanley HE. Scaling, universality, and renormalization: Three pillars of modern critical phenomena. Rev Mod Phys. 1999;71:S358–366. [Google Scholar]
- Stern MD, Song LS, Cheng H, Sham JS, Yang HT, Boheler KR, Rios E. Local control models of cardiac excitation-contraction coupling. A possible role for allosteric interactions between ryanodine receptors. J Gen Physiol. 1999;113:469–489. doi: 10.1085/jgp.113.3.469. [DOI] [PMC free article] [PubMed] [Google Scholar]
- ter Keurs HEDJ, Boyden PA. Calcium and Arrhythmogenesis. Physiol Rev. 2007;87:457–506. doi: 10.1152/physrev.00011.2006. [DOI] [PMC free article] [PubMed] [Google Scholar]
- Thorn P, Lawrie AM, Smith PM, Gallacher DV, Petersen OH. Local and global cytosolic Ca2+ oscillations in exocrine cells evoked by agonists and inositol trisphosphate. Cell. 1993;74:661–668. doi: 10.1016/0092-8674(93)90513-p. [DOI] [PubMed] [Google Scholar]
- Thurley K, Smith IF, Tovey SC, Taylor CW, Parker I, Falcke M. Timescales of IP3-evoked Ca2+ spikes emerge from Ca2+ puffs only at the cellular level. Biophys J. 2011;101:2638–2644. doi: 10.1016/j.bpj.2011.10.030. [DOI] [PMC free article] [PubMed] [Google Scholar]
- Vinogradova TM, Brochet DX, Sirenko S, Li Y, Spurgeon H, Lakatta EG. Sarcoplasmic reticulum Ca2+ pumping kinetics regulates timing of local Ca2+ releases and spontaneous beating rate of rabbit sinoatrial node pacemaker cells. Circ Res. 2010;107:767–775. doi: 10.1161/CIRCRESAHA.110.220517. [DOI] [PMC free article] [PubMed] [Google Scholar]
- Vinogradova TM, Lakatta EG. Regulation of basal and reserve cardiac pacemaker function by interactions of cAMP-mediated PKA-dependent Ca2+ cycling with surface membrane channels. J Mol Cell Cardiol. 2009;47:456–474. doi: 10.1016/j.yjmcc.2009.06.014. [DOI] [PMC free article] [PubMed] [Google Scholar]
- Wagner J, Keizer J. Effects of rapid buffers on Ca2+ diffusion and Ca2+ oscillations. Biophys J. 1994;67:447–456. doi: 10.1016/S0006-3495(94)80500-4. [DOI] [PMC free article] [PubMed] [Google Scholar]
- Wasserstrom JA, Shiferaw Y, Chen W, Ramakrishna S, Patel H, Kelly JE, O’Toole MJ, Pappas A, Chirayil N, Bassi N, Akintilo L, Wu M, Arora R, Aistrup GL. Variability in timing of spontaneous calcium release in the intact rat heart is determined by the time course of sarcoplasmic reticulum calcium load. Circ Res. 2010;107:1117–1126. doi: 10.1161/CIRCRESAHA.110.229294. [DOI] [PMC free article] [PubMed] [Google Scholar]
- Wier WG, ter Keurs HE, Marban E, Gao WD, Balke CW. Ca2+‘sparks’ and waves in intact ventricular muscle resolved by confocal imaging. Circ Res. 1997;81:462–469. doi: 10.1161/01.res.81.4.462. [DOI] [PubMed] [Google Scholar]
- Xie F, Qu Z, Garfinkel A, Weiss JN. Electrophysiological heterogeneity and stability of reentry in simulated cardiac tissue. Am J Physiol Heart Circ Physiol. 2001a;280:H535–H545. doi: 10.1152/ajpheart.2001.280.2.H535. [DOI] [PubMed] [Google Scholar]
- Xie F, Qu Z, Weiss JN, Garfinkel A. Coexistence of multiple spiral waves with independent frequencies in a heterogeneous excitable medium. Phys Rev E Stat Nonlin Soft Matter Phys. 2001b;63:031905. doi: 10.1103/PhysRevE.63.031905. [DOI] [PubMed] [Google Scholar]
- Xie Y, Sato D, Garfinkel A, Qu Z, Weiss JN. So little source, so much sink: requirements for afterdepolarizations to propagate in tissue. Biophys J. 2010;99:1408–1415. doi: 10.1016/j.bpj.2010.06.042. [DOI] [PMC free article] [PubMed] [Google Scholar]
- Zeng WZ, Glass L, Shrier A. Evolution of rhythms during periodic stimulation of embryonic chick heart cell aggregates. Circ Res. 1991;69:1022–1033. doi: 10.1161/01.res.69.4.1022. [DOI] [PubMed] [Google Scholar]