

Abstract
Recently, contradictory findings have been reported concerning the function of irisin and its precursor gene, skeletal muscle FNDC5, in energy homeostasis, and the associated regulatory role of exercise and PGC-1α. We therefore evaluated whether muscle FNDC5 mRNA and serum irisin are exercise responsive and whether PGC-1α expression is associated with FNDC5 expression. The male subjects in the study performed single exercises: (1) 1 h low-intensity aerobic exercise (AE) (middle-aged, n= 17), (2) a heavy-intensity resistance exercise (RE) bout (young n= 10, older n= 11) (27 vs. 62 years), (3) long-term 21 weeks endurance exercise (EE) training alone (twice a week, middle-aged, n= 9), or (4) combined EE and RE training (both twice a week, middle-aged, n= 9). Skeletal muscle mRNA expression was analysed by quantitative PCR and serum irisin by ELISA. No significant changes were observed in skeletal muscle PGC-1α, FNDC5 and serum irisin after AE, EE training or combined EE + RE training. However, a single RE bout increased PGC-1α by 4-fold in young and by 2-fold in older men, while FNDC5 mRNA only increased in young men post-RE, by 1.4-fold. Changes in PGC-1α or serum irisin were not consistently accompanied by changes in FNDC5. In conclusion, for the most part, neither longer-term nor single exercise markedly increases skeletal muscle FNDC5 expression or serum irisin. Therefore their changes in response to exercise are probably random and not consistent excluding the confirmation of any definitive link between exercise and FNDC5 expression and irisin release in humans. Moreover, irisin and FNDC5 were not associated with glucose tolerance and being overweight, or with metabolic disturbances, respectively. Finally, factor(s) other than PGC-1α and transcription may regulate FNDC5 expression.
Key points
Contradictory findings have been reported concerning the function of irisin and its precursor gene, skeletal muscle FNDC5, in energy homeostasis and metabolic health, and the associated regulatory role of exercise and PGC-1α.
We analysed the effects of different short- and long-term exercise regimens on muscle FNDC5 and PGC-1α, and serum irisin, and studied the associations of irisin and FNDC5 with health parameters.
FNDC5 and serum irisin did not change after acute aerobic, long-term endurance training or endurance training combined with resistance exercise (RE) training, or associate with metabolic disturbances. A single RE bout increased FNDC5 mRNA in young, but not older men (27 vs. 62 years). Changes in PGC-1α or serum irisin were not consistently accompanied by changes in FNDC5.
Our data suggest that the effects of exercise on FNDC5 and irisin are not consistent, and that their role in health is questionable. Moreover, the regulatory mechanisms should be studied further.
Introduction
Skeletal muscle is increasingly being recognized as an endocrine organ that releases a variety of signalling molecules called myokines, which regulate several physiological processes. Recently, Boström et al. (2012) showed that a novel myokine, irisin (named after the Greek goddess Iris), a proteolytic derivative of the muscle integral membrane protein fibronectin type III domain containing 5 (FNDC5), is released into the bloodstream after endurance training in mice and humans. According to their study, irisin is up-regulated by exercise-responsive peroxisome proliferator-activated receptor-γ coactivator-1α (PGC-1α) to activate thermogenic programmes in white adipose tissue suggesting that it could be therapeutic for obesity and type 2 diabetes. Since then it has been questioned whether FNDC5 and irisin are generally linked to physical exercise and what irisin's role is in metabolic homeostasis (Sharma et al. 2012; Timmons et al. 2012; Roberts et al. 2013).
Timmons et al. (2012) showed that muscle FNDC5 mRNA expression is increased only in a minority of (older) endurance-trained subjects and that exercise-induced improvements in insulin sensitivity are not associated with FNDC5 gene expression (Timmons et al. 2012). Subsequently, it has been demonstrated that skeletal muscle FNDC5 mRNA and irisin are actually elevated in obese rats without improvement in insulin sensitivity (Sharma et al. 2012; Roberts et al. 2013). Huh et al. (2012) reported that skeletal muscle FNDC5 mRNA and serum irisin decreased after a surgically induced weight loss and thus were not directly involved with beneficial effects to health (Huh et al. 2012). However, the latter study detected slightly increased serum irisin levels in young subjects after acute (but not chronic) sprint exercise (Huh et al. 2012). Yet, the latest reports showed that skeletal muscle FNDC5 expression and circulating irisin levels were decreased in obese patients and associated with insulin sensitivity, and that adipose tissue might secrete irisin in response to exercise (Moreno-Navarrete et al. 2013; Roca-Rivada et al. 2013). Altogether, these contradictory results question whether FNDC5 and irisin link physical activity to energy metabolic homeostasis or whether the effects of exercise on this signalling system are age dependent and/or exercise-type and -duration specific rather than general.
Methods
Ethical approval
The samples used in this study are derived from earlier studies that were all approved by the local Ethics Committee of the University of Jyväskylä, Finland and conducted in accordance with the Declaration of Helsinki. A written informed consent was obtained from all the subjects.
Study subjects and exercise protocols
All study subjects were previously untrained healthy men except those used in the microarray data analysis (see below). The following four exercise protocols are included in this report.
(1) An acute low-intensity aerobic exercise (AE) was performed with bicycle ergometry for 1 h at a low intensity of 50% maximum rate of O2 uptake ( ) in middle-aged men (n= 17, age 53 ± 4 years, weight 84 ± 12 kg and body mass index (BMI) 27 ± 4; means ± SD; unpublished study design).
(2) A single resistance exercise (RE) bout in young (n= 10, age 27 ± 3 years, weight 74 ± 9 kg and BMI 23 ± 2) and older (n= 11, age 62 ± 5 years, weight 80 ± 5 kg and BMI 25 ± 2) men of 5 sets of 10 repetitions in leg press until failure. The RE bout study protocols are described in Hulmi et al. (2008, 2009a).
(3) Heavy-intensity endurance exercise (EE; n= 9, age 57 ± 7 years, weight 73 ± 7 kg and BMI 24 ± 2) twice a week and combined EE and RE training (n= 9, age 62 ± 5 years, weight 79 ± 13 kg and BMI 25 ± 3) 2 + 2 times per week for 21 weeks in middle-aged men. The study protocols for EE and combined EE and RE training are described in Ahtiainen et al. (2009). Briefly, the intensity of endurance training was progressively increased and based on the aerobic and anaerobic thresholds. The training was carried out on a bicycle ergometer and heart rate monitoring was used to control the intensity of the exercise. During the first 7 week training period, the subjects trained for 30 min per session under the level of their aerobic threshold. Moreover, a few sessions included cycling above the aerobic threshold in order to become accustomed to a higher intensity. During the second 7 week training period a 45 min session once a week was divided into four loading intervals: 15 min under the level of aerobic threshold, 10 min between the aerobic–anaerobic thresholds, 5 min above the anaerobic threshold, and 15 min again under the aerobic threshold. The other of the two weekly training sessions was 60 min under the aerobic threshold. The focus of training during the third 7 week period was to improve cycling speed and maximal endurance in a 60 min session: 30 min under the aerobic threshold during the whole session altogether, 2 × 10 min between the aerobic–anaerobic thresholds, and 2 × 5 min above the anaerobic threshold. Every other training session included 90 min of cycling at a steady pace under the aerobic threshold. The strength training in the combined EE and RE included leg press, knee extension, bench press, triceps pushdown, lateral pull-down, sit-up and elbow flexion). The 21 week training period consisted of three specific training periods of 7 weeks in duration. Both overall intensity and volume of training increased progressively throughout the training period following the units of a training programme. The total training sessions averaged from 60 to 90 min in length including warming up and cooling down.
(4) The study subjects that performed a heavy-exercise bout (5 × 10 repetitions of bilateral knee extensions with a load of 10 repetition maximum (10 RM)) were early-middle-aged men (n= 14, age 34 ± 7 years, weight 85 ± 8 kg and BMI 26 ± 2).
The study subjects (Table 1) used to analyse the microarray data were derived from a larger study which was aimed at investigating body composition and its determinants (‘Investigation of the role of adiposity-related low-grade inflammation on interactions between adipose tissue, muscle, and bone, the AMB-study’ supported by the Academy of Finland SKID-KID program 2010–2013). The study was conducted at the University of Jyväskylä in 2008–2010 in accordance with the Declaration of Helsinki and was approved by the ethical committee of the Central Finland Health Care district.
Table 1.
General characteristics of the subjects used in the microarray data analysis
| Variable | Healthy (n= 21) | MetS (n= 14) | Lean (n= 14) | Obese (n= 21) |
|---|---|---|---|---|
| Age (years) | 37 ± 15 | 49 ± 13 | 40 ± 15 | 43 ± 15 |
| Weight (kg) | 66 ± 11 | 88 ± 13 | 61 ± 9 | 83 ± 9 |
| BMI (kg m−2) | 23 ± 3 | 30 ± 4 | 21 ± 2 | 29 ± 3 |
| Fat (%) | 30.3 ± 8.2 | 37.5 ± 7.4 | 25.2 ± 5.4 | 38.2 ± 5.4 |
| WC (cm) | 80 ± 9 | 101 ± 10 | 77 ± 8 | 96 ± 10 |
| Systolic BP (mmHg) | 122 ± 10 | 143 ± 7 | 123 ± 9 | 134 ± 9 |
| Diastolic BP (mmHg) | 73 ± 8 | 86 ± 9 | 73 ± 9 | 96 ± 9 |
| Triglycerides (mmol l−1) | 1.40 ± 0.40 | 1.60 ± 0.38 | 1.40 ± 0.37 | 1.76 ± 0.41 |
| HDL (mmol l−1) | 1.39 ± 0.38 | 0.97 ± 0.46 | 1.19 ± 0.41 | 1.01 ± 0.41 |
Data are given as mean ± SD. MetS, metabolic syndrome; BP, blood pressure; BMI, body mass index; WC, waist circumference; HDL, high density lipoprotein.
Adipose tissue biopsies and microarray analysis
Altogether 35 subjects provided tissue samples that were taken after an overnight fast between 7 and 9 am under local anaesthesia (lidocaine) after skin cooling and disinfection. A needle biopsy (14 G needle, 2.1 mm × 60 mm) of subcutaneous abdominal adipose tissue was taken at the level of the navel. The samples were cleaned of any visible connective tissue and blood. Biopsies were frozen in liquid nitrogen after withdrawing from the needle and stored at −80°C until used for RNA isolation. Total RNA from the adipose tissue biopsies was extracted with an optimized protocol using FastPrep systems (MP Biomedicals, France) and RNeasy Lipid Tissue Mini Kit (Qiagen, Germantown, MD, USA).
The quality of the isolated total RNA was studied using the 2100 Bioanalyzer (Agilent, Santa Clara, CA, USA) and the Experion Automated Electrophoresis Station (BioRad, Hercules, CA, USA). For the microarray analysis, the total RNA was amplified and processed using the GeneChip 3′IVT Express Kit (Affymetrix, Santa Clara, CA, USA) and hybridized on Affymetrix Human Genome U219 Array Plates. Affymetrix GeneChip Command Console (AGCC) 3.1 was used to control the GeneTitan hybridization process and in summarizing probe cell intensity data. After-hybridization quality was checked with AGCC and Affymetrix Expression Console 1.1.
The gene values of the expression measurements were analysed by using the Robust Multiarray Averaging (RMA) algorithm, as implemented in R package affy from Bioconductor. The differentially expressed genes were detected with the Limma R package utilizing linear modelling and empirical Bayes methods. Raw P values were adjusted using the Benjamini and Hochberg multiple adjustment method. Genes with an adjusted P value below 0.05 were considered to be differentially expressed.
Skeletal muscle biopsies, RNA extraction and RT-PCR
Vastus lateralis biopsies were taken under the effect of lidocaine before and at 3 h post-exercise (except for single RE bout groups for which the sample collection times were before, at 1 h and at 48 h). Total RNA was extracted using Trizol-reagent (Invitrogen, Carlsbad, CA, USA) and a FastPrep Instrument (Bio101 Systems, USA). Three micrograms of total RNA was reverse transcribed according to the manufacturer's instructions using a High Capacity cDNA Synthesis Kit (Applied Biosystems, Foster City, CA, USA).
Quantitative PCR
FNDC5 mRNA was quantified using TaqMan primers and probes (Assay ID Hs00401006_m1) and ABI 7300 Real-Time quantitative PCR System (Applied Biosystems). PGC-1α and the glyceraldehyde 3-phosphate dehydrogenase gene (GAPDH) were quantified using in-house-designed primers, iQ SYBR Supermix and CFX96 Real-Time PCR Detection System (BioRad). Primer sequences and annealing temperatures were as follows: PGC-1α Fwd: 5′CACTTACAAGCCAAACCAACAACT′3, Temp. 59°C; PGC-1α Rev.: 5′CAATAGTCTTGTTCTCAAATGGGGA′3, Temp. 59°C; GAPDH Fwd: 5′CCACCCATGGCAAATTCC′3, Temp. 60°C; GAPDH Rev.: 5′TGGGATTTCCATTGATGACAA′3, Temp. 60°C. Each sample was analysed in duplicate and the PCR cycle parameters were as follows: +95°C for 10 min, 40 cycles at +95°C for 10 s, at +59 or +60°C (PGC-1α and GAPDH, respectively) for 30 s and at +72°C for 30 s, followed by 5 s at +65°C. Relative expression levels for FNDC5 and PGC-1α were calculated with the ΔΔCt method and normalized to the expression of GAPDH.
Blood sample collection, ELISA and measurement of biochemical parameters
Blood samples were collected before and at 3 h post-exercise in the same way as for the abovementioned studies. Serum irisin levels were measured using a commercial enzyme immunoassay (EIA) kit (Irisin/FNDC-5 (16–127) (Human, Mouse, Rat), Phoenix Pharmaceuticals, Inc., Burlingame, CA, USA) according to the manufacturer's instructions. The absorbance at 450 nm was measured using Wallac Victor3 1420 Multilabel Counter plate reader (Perkin Elmer, Waltham, MA, USA).
Plasma glucose, serum triglycerides, total cholesterol and high density lipoprotein (HDL) were analysed using using the KONELAB 20XTi analyser (Thermo Fisher Scientific Inc., Waltham, MA, USA). Insulin was determined by immunofluorescence using the IMMULITE Analyser (Diagnostic Products Corp., Los Angeles, CA, USA). The homeostasis model assessment of insulin resistance (HOMA-IR) index was calculated as (Fasting insulin concentration × Fasting glucose concentration)/22.5.
Results
The effects of exercise on serum irisin and skeletal muscle FNDC5 and PGC-1α
Quantitative PCR of skeletal muscle (vastus lateralis) biopsies and serum ELISA analysis show that in healthy, previously untrained men no significant changes are observed in skeletal muscle PGC-1α, FNDC5 and serum irisin after 1 h low-intensity AE (middle-aged men n= 17), 21 week heavy-intensity EE training (middle-aged men n= 9) or 21 week heavy-intensity EE training combined with RE training (middle-aged men n= 9; Fig. 1). Large intra- and inter-individual variations in PGC-1α, FNDC5 and serum irisin in response to EE and RE training were observed (Fig. 1A–C). Moreover, the changes in muscle PGC-1α mRNA expression or serum irisin were not consistently accompanied by corresponding changes in FNDC5 (Figs 1D and E, and 2E and F).
Figure 1.
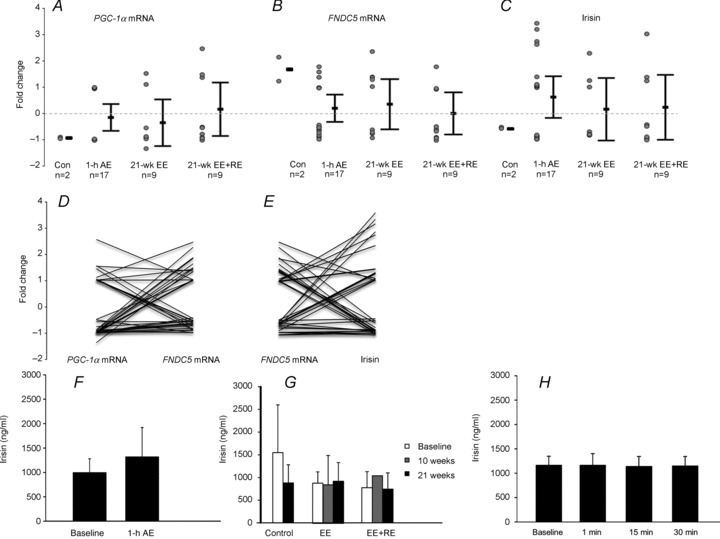
Changes of PGC-1α (A), FNDC5 mRNA expression (B) and serum irisin (C) in middle-aged, non-diabetic and previously untrained men after a 1 h low-intensity (50% ) aerobic exercise (AE) performed with bicycle ergometry (n= 17); 21 weeks endurance training (EE, n= 9); combined endurance + resistance training (EE + RE, n= 9), and in age-matched non-exercised controls (Con, n= 2). In A, B and C the error bars represent mean values and the whiskers are 95% confidence intervals. The circles represent individual values. D, individual responses to exercise. Each line represents one individual and links the change of PGC-1α to the change of FNDC5 mRNA after exercise. E, individual responses to exercise. Each line represents one individual and links the change of FNDC5 mRNA to the change of serum irisin after exercise. (Data are pooled from panels A and B.) F, serum irisin concentrations (ng ml−1) before and after AE. G, serum irisin concentrations (ng ml−1) before and after EE and combined EE + RE. H, serum irisin concentrations after 1, 15 and 30 min of a heavy-exercise bout.
Figure 2.
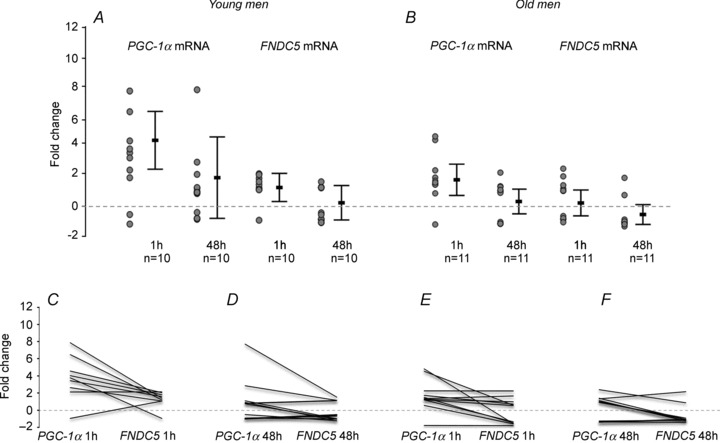
Skeletal muscle mRNA fold changes of PGC-1α and FNDC5 after 1 h and 48 h of a single resistance exercise bout (5 × 10 RM leg press) in young (A, n= 10) and older (B, n= 11) men. In A and B the error bars represent mean values and the whiskers are 95% confidence intervals. The circles represent individual values. C–F, individual responses to exercise in young (C and D) and older (E and F) men. Each line represents one individual and links the change of PGC-1α to the change of FNDC5 mRNA.
To study whether the blood sampling time may have affected the results (acute blood sampling vs. 3 h post-exercise), we performed a heavy exercise bout (5 × 10 repetitions of bilateral knee extensions with a load of 10 RM) for 14 males with simultaneous blood sampling at 1, 15 and 30 min, and measured serum irisin. Compared to baseline levels no differences in serum irisin levels were found at any time point (Fig. 1H).
Of the different exercise regimens a single RE bout, however, significantly increased PGC-1α by 4-fold in young and by 2-fold in older men (young men n= 10, older men n= 11), while FNDC5 mRNA increased by 1.4-fold (95% confidence interval (CI) 0.3–2.2) post-RE only in young men (Fig. 2).
Irisin, FNDC5, glucose metabolism and health
We further determined whether the serum irisin levels were associated with selected blood parameters at baseline in the subjects of aerobic exercise (n= 17). Irisin was not associated with glucose, insulin or HOMA-IR (Table 2).
Table 2.
Correlation of serum irisin levels with HOMA-IR, plasma glucose and serum insulin measured with oral glucose tolerance test (n= 17)
| Parameter | r (irisin) | P value |
|---|---|---|
| HOMA-IR | 0.030 | 0.910 |
| Plasma glucose concentration (mmol l−1) | ||
| 0 h | −0.109 | 0.678 |
| 1 h | −0.042 | 0.873 |
| 2 h | −0.098 | 0.708 |
| Serum insulin (μIU ml−1) | ||
| 0 h | 0.076 | 0.773 |
| 1 h | −0.051 | 0.846 |
| 2 h | −0.112 | 0.667 |
To assess whether FNDC5 expression was associated with being overweight or metabolic disturbances, we analysed our existing microarray data comparing lean (n= 14) and obese (n= 21) subjects, as well as metabolically healthy subjects (n= 21) with those classified to have metabolic syndrome (n= 14) (Table 1). Despite the 741 and 1402 differentially expressed adipose tissue genes in obese subjects and subjects with metabolic syndrome, respectively (data not shown), no differences in FNDC5 expression were found in adipose tissue or skeletal muscle.
Discussion
After the initial excitement about the therapeutic implications of irisin following its discovery (Boström et al. 2012) several publications have questioned the expression of the irisin precursor FNDC5 and the regulatory role of exercise therein. Contrary to the preliminary finding of Boström et al. (2012) an endurance exercise bout or longer-term endurance training alone or combined with resistance training did not increase FNDC5 mRNA expression in skeletal muscle or irisin release in our study population. This was not due to a lack of response in muscle since RE, as expected, increased muscle strength, mTOR signalling and muscle fibre size (Hulmi et al. 2009b), EE training increased aerobic capacity (Ahtiainen et al. 2009; Karavirta et al. 2010) and the expression of exercise-responsive sirtuin 1 and cytochrome c proteins, and the phosphorylation of pyruvate dehydroxygenase kinase 4 (Ahtiainen et al., unpublished observations), and AE increased exercise-responsive AMP-activated protein kinase (AMPK) phosphorylation and sirtuin 1 expression (Pekkala et al., unpublished observations).
Importantly, the changes in PGC-1α mRNA expression were not consistently accompanied by corresponding changes in FNDC5, suggesting that factor(s) other than PGC-1α may be involved in the regulation of FNDC5 expression. Of note, PGC-1α is one of the important regulators of energy metabolism (Rodgers et al. 2005, 2008). Therefore, various upstream mechanisms, including those that are exercise-inducible, may influence PGC-1α and FNDC5 mRNA expression. Accordingly, Timmons et al. (2012) detected no correlation between PGC-1α and FNDC5 and thus concluded that of the exercise-regulated genes probably the other approximately 1000 genes regulated by different types of exercise warrant more attention than just FNDC5 alone when the beneficial effects of exercise on health are under investigation (Timmons et al. 2012). In addition, surprisingly, in our study the changes in FNDC5 expression were not consistently accompanied by changes in serum irisin suggesting that in addition to transcriptional regulation other processes may be involved in irisin release from the muscle.
The large intra- and inter-individual variation in FNDC5 and irisin in response to different types of exercise indicates that exercise may not increase FNDC5 mRNA in skeletal muscle or circulating irisin level in most people. According to our results and those of Timmons et al. (2012) it seems that the effects of exercise on serum irisin and skeletal muscle FNDC5 are not consistent, and it is already clear from an increasing body of evidence that the beneficial effects of exercise on health also occur independently of irisin. In addition, sample collection time might influence the outcome. The sampling time and exercise protocol used by Boström et al. (2012) is not comprehensively described. They detected an increase in serum irisin after 8 weeks EE (Boström et al. 2012) whereas Huh et al. (2012) found an increase only after the first week and not long term (Huh et al. 2012). However, we did not find differences in serum irisin levels using acute sampling times (1, 15 and 30 min after exercise). Thus, it remains unclear which kind of exercise protocol, intensity or duration, if any, would be optimal to increase circulating serum irisin levels in the general population.
The metabolic role of irisin, according to Boström et al. (2012), is characterized by increased energy expenditure and glucose homeostasis. Therefore it would be logical that irisin and FNDC5 increase in response to aerobic or endurance exercise that are generally characterized by increased oxidative capacity and mitochondrial functions. However, we did not find an increase in irisin or FNDC5 despite the increase in other metabolically or oxidatively important markers after exercise (see above). Resistance training alone with a large number of repetitions per muscle group (e.g. 10 repetitions used per set in the present study) can also lead to enhanced muscle endurance and muscle growth. We found increased FNDC5 mRNA after RE together with PGC-1α suggesting that irisin may be associated with enhanced strength endurance due to this mode of resistance training with many repetitions per set. It is also possible that the anabolic effects (muscle growth) of RE are associated with increased FNDC5 expression since Huh et al. (2012) also showed that irisin was mostly associated with muscle mass.
Irisin has been shown to improve glucose tolerance and insulin sensitivity in mice (Boström et al. 2012) and to correlate with glucose in humans (Huh et al. 2012). However, we did not find any correlation between serum irisin and glucose, insulin and HOMA-IR or glucose tolerance in middle-aged men. Moreover, related to its function in health and disease, unlike Moreno-Navarrete et al. (2013) we did not find decreased expression of FNDC5 associated with obesity and metabolic syndrome either in adipose tissue or skeletal muscle. Our results suggest that the role of irisin and FNDC5 in metabolic health may not be so straightforward and applicable to all clinical populations.
Finally, another important fact that might explain the inconsistent results is the serum irisin analysis technique itself. Boström et al. measured serum irisin using Western blot and quantified unglycosylated irisin instead of glycosylated irisin (Boström et al. 2012) even though many potential glycosylation sites of FNDC5 are retained in the secreted irisin. A lack of glycosylation prevents proper protein folding and retention in endoplasmic reticulum (ER; Vagin et al. 2009; Roth et al. 2010). Nevertheless, mis-folded glycoproteins may still be secreted exhibiting altered functions (such as failure in receptor binding), a situation which is highly likely in ER stress commonly observed during exercise. While we used ELISA that detects the native conformation of irisin, Western blot of unglycosylated irisin probably reflects an unfolded polypeptide and therefore it is uncertain what proportion of the irisin measured in this way is functional.
In conclusion, our study suggests that in healthy, lean people: (1) exercise may not generally increase FNDC5 expression in skeletal muscle, (2) factor(s) other than PGC-1α and transcriptional regulation may be involved in FNDC5 expression and irisin release, and (3) the changes in serum irisin and skeletal muscle FNDC5 in response to exercise are probably random, and there is little evidence to confirm any definitive link between exercise and FNDC5 expression and irisin release in humans.
Acknowledgments
We thank Dr Omid Rasool, Dr Riitta Lahesmaa, Mrs Lingjia Kong and Dr Reija Autio for the processing of microarray samples and data. We also thank Mr Risto Puurtinen, Mrs Kaisa-Leena Tulla, Mrs Aila Ollikainen, Mrs Meeri Kröger and Mr Erkki Helkala for the excellent technical assistance.
Glossary
- AE
aerobic exercise
- EE
endurance exercise
- FNDC5
fibronectin type III domain containing 5
- HOMA-IR
homeostasis model assessment of insulin resistance
- PGC-1α
peroxisome proliferator-activated receptor-γ coactivator
- RE
resistance exercise
- RM
repetition maximum
Additional information
Competing interests
None declared.
Author contributions
All experiments were performed at the University of Jyväskylä in Finland except serum analysis, which was done at the University of Oulu in Finland. S.P., J.J.H., J.P.A., M.A., K.H. and S.C. designed the experiments. S.P., M.H. and K.A.M. performed the laboratory analyses and P.K.W. the statistical analyses. M.A. and K.N. were the study physicians. E.P., H.K., M.A., K.-H.H. and S.C. were involved in the interpretation of the results and revised the paper. S.P. wrote the paper. P.K.W., J.J.H., J.P.A., M.A., K.H. and S.C. revised the paper. All authors approved the final version of the manuscript.
Funding
This work was financially supported by the Finnish Ministry of Education, The Central Finland Health Care District, Jyväskylä, Finland, Academy of Finland, Finnish Diabetes Research Foundation, and EVO (Northern Ostrobothnia Hospital District Research Grant).
References
- Ahtiainen JP, Hulmi JJ, Kraemer WJ, Lehti M, Pakarinen A, Mero AA, Karavirta L, Sillanpaa E, Selanne H, Alen M, Komulainen J, Kovanen V, Nyman K, Hakkinen K. Strength [corrected], endurance or combined training elicit diverse skeletal muscle myosin heavy chain isoform proportion but unaltered androgen receptor concentration in older men. Int J Sports Med. 2009;30:879–887. doi: 10.1055/s-0029-1238290. [DOI] [PubMed] [Google Scholar]
- Boström P, Wu J, Jedrychowski MP, Korde A, Ye L, Lo JC, Rasbach KA, Boström EA, Choi JH, Long JZ, Kajimura S, Zingaretti MC, Vind BF, Tu H, Cinti S, Højlund K, Gygi SP, Spiegelman BM. A PGC1-α-dependent myokine that drives brown-fat-like development of white fat and thermogenesis. Nature. 2012;481:463–468. doi: 10.1038/nature10777. [DOI] [PMC free article] [PubMed] [Google Scholar]
- Huh JY, Panagiotou G, Mougios V, Brinkoetter M, Vamvini MT, Schneider BE, Mantzoros CS. FNDC5 and irisin in humans: I. Predictors of circulating concentrations in serum and plasma and II. mRNA expression and circulating concentrations in response to weight loss and exercise. Metabolism. 2012;61:1725–1738. doi: 10.1016/j.metabol.2012.09.002. [DOI] [PMC free article] [PubMed] [Google Scholar]
- Hulmi JJ, Kovanen V, Lisko I, Selanne H, Mero AA. The effects of whey protein on myostatin and cell cycle-related gene expression responses to a single heavy resistance exercise bout in trained older men. Eur J Appl Physiol. 2008;102:205–213. doi: 10.1007/s00421-007-0579-4. [DOI] [PubMed] [Google Scholar]
- Hulmi JJ, Kovanen V, Selänne H, Kraemer WJ, Häkkinen K, Mero AA. Acute and long-term effects of resistance exercise with or without protein ingestion on muscle hypertrophy and gene expression. Amino Acids. 2009a;37:297–308. doi: 10.1007/s00726-008-0150-6. [DOI] [PubMed] [Google Scholar]
- Hulmi JJ, Tannerstedt J, Selänne H, Kainulainen H, Kovanen V, Mero AA. Resistance exercise with whey protein ingestion affects mTOR signaling pathway and myostatin in men. J Appl Physiol. 2009b;106:1720–1729. doi: 10.1152/japplphysiol.00087.2009. [DOI] [PubMed] [Google Scholar]
- Karavirta L, Häkkinen A, Sillanpää E, García-López D, Kauhanen A, Haapasaari A, Alen M, Pakarinen A, Kraemer WJ, Izquierdo M, Gorostiaga E, Häkkinen K. Effects of combined endurance and strength training on muscle strength, power and hypertrophy in 40–67-year-old men. Scand J Med Sci Sports. 2010;21:402–411. doi: 10.1111/j.1600-0838.2009.01059.x. [DOI] [PubMed] [Google Scholar]
- Moreno-Navarrete JM, Ortega F, Serrano M, Guerra E, Pardo G, Tinahones F, Ricart W, Manuel-Fernández-Real J. Irisin is expressed and produced by human muscle and adipose tissue in association with obesity and insulin resistance. J Clin Endocrinol Metab. 2013;98:E769–778. doi: 10.1210/jc.2012-2749. [DOI] [PubMed] [Google Scholar]
- Roberts MD, Bayless DS, Company JM, Jenkins NT, Padilla J, Childs TE, Martin JS, Dalbo VJ, Booth FW, Rector RS, Laughlin MH. Elevated skeletal muscle irisin precursor FNDC5 mRNA in obese OLETF rats. Metabolism. 2013;62:1052–1056. doi: 10.1016/j.metabol.2013.02.002. [DOI] [PMC free article] [PubMed] [Google Scholar]
- Roca-Rivada A, Castelao C, Senin LL, Landrove MO, Baltar J, Crujeiras AB, Seoane LM, Casanueva FF, Pardo M. FNDC5/irisin is not only a myokine but also an adipokine. PLoS One. 2013;8:e60563. doi: 10.1371/journal.pone.0060563. [DOI] [PMC free article] [PubMed] [Google Scholar]
- Rodgers JT, Lerin C, Gerhart-Hines Z, Puigserver P. Metabolic adaptations through the PGC-1α and SIRT1 pathways. FEBS Lett. 2008;582:46–53. doi: 10.1016/j.febslet.2007.11.034. [DOI] [PMC free article] [PubMed] [Google Scholar]
- Rodgers JT, Lerin C, Haas W, Gygi SP, Spiegelman BM, Puigserver P. Nutrient control of glucose homeostasis through a complex of PGC-1α and SIRT1. Nature. 2005;434:113–118. doi: 10.1038/nature03354. [DOI] [PubMed] [Google Scholar]
- Roth J, Zuber C, Park S, Jang I, Lee Y, Kysela KG, Le Fourn V, Santimaria R, Guhl B, Cho JW. Protein N-glycosylation, protein folding, and protein quality control. Mol Cells. 2010;30:497–506. doi: 10.1007/s10059-010-0159-z. [DOI] [PubMed] [Google Scholar]
- Sharma N, Castorena CM, Cartee GD. Greater insulin sensitivity in calorie restricted rats occurs with unaltered circulating levels of several important myokines and cytokines. Nutr Metab (Lond) 2012;9:90. doi: 10.1186/1743-7075-9-90. [DOI] [PMC free article] [PubMed] [Google Scholar]
- Timmons JA, Baar K, Davidsen PK, Atherton PJ. Is irisin a human exercise gene. Nature. 2012;488:E9–10. doi: 10.1038/nature11364. discussion E10–11. [DOI] [PubMed] [Google Scholar]
- Vagin O, Kraut JA, Sachs G. Role of N-glycosylation in trafficking of apical membrane proteins in epithelia. Am J Physiol Renal Physiol. 2009;296:F459–F469. doi: 10.1152/ajprenal.90340.2008. [DOI] [PMC free article] [PubMed] [Google Scholar]