Abstract
Molecular dynamics (MD) simulations of cellulose microfibrils are pertinent to the paper, textile, and biofuels industries for their unique capacity to characterize dynamic behavior and atomic-level interactions with solvent molecules and cellulase enzymes. While high-resolution crystallographic data have established a solid basis for computational analysis of cellulose, previous work has demonstrated a tendency for modeled microfibrils to diverge from the linear experimental structure and adopt a twisted conformation. Here, we investigate the dependence of this twisting behavior on computational approximations and establish the theoretical basis for its occurrence. We examine the role of solvent, the effect of nonbonded force field parameters [partial charges and van der Waals (vdW) contributions], and the use of explicitly modeled oxygen lone pairs in both the solute and solvent. Findings suggest that microfibril twisting is favored by vdW interactions, and counteracted by both intrachain hydrogen bonds and solvent effects at the microfibril surface.
Keywords: cellulose, microfibril twist, molecular dynamics, GLYCAM
INTRODUCTION
Naturally occurring cellulose, termed cellulose I, is the most abundant of all biomolecular polymers. Composed of repeating β(1-4)-d-glucosyl residues, it manifests as a crystalline array of parallel chains associated into layers via hydrogen-bonding between equatorial hydroxyl and hydroxymethyl groups. This primary structural unit, known as a microfibril, can be thousands of residues in length, whereas the cross-sectional thickness of a given microfibril, defined by the number of constituent polysaccharide chains, is entirely dependent upon the cellulosic source. The specific cellulose synthase complex employed for biosynthesis is thought to determine not only the number of chains but also microfibril shape and packing arrangement.1 While cellulose I occurs as two distinct, yet coexistent crystal phases, Iα and Iβ, that differ only in the relative alignment of the polysaccharide layers, plant-based cellulose microfibrils are believed to exist primarily as the Iβ phase.
Of longstanding importance to the paper and textile industries, cellulose has recently garnered significant interest from the biofuels sector as a potential source for the environmentally sustainable production of ethanol. Computational analysis of microfibril interactions with solvent molecules and cellulase enzymes could guide the design of novel paper manufacturing processes and fabric treatments, as well as shed light on efficient mechanisms for cellulose degradation relevant to ethanol production. High-resolution crystal structures of both the Iα and Iβ polymorphs have established a solid experimental basis for theoretical studies,2,3 yet molecular dynamics (MD) simulations generally produce results that disagree to varying extents with the crystallographic data.4-12
Matthews et al. first reported the tendency for cellulose microfibrils to rapidly (<200 ps) diverge from the crystallographic coordinates and adopt a right-handed twist during MD simulation using the CHARMM CSFF force field.4 Shortly thereafter, Yui et al. reported similar behavior of microfibrils in simulations performed with the GLYCAM06 force field.5,6 Since then, further studies employing GLYCAM06, a range of other atomistic carbohydrate force fields including OPLS, CHARMM C35, and GROMOS 45a4, as well as several specifically adapted coarse-grain force fields, have likewise produced twisted structures.7-11 In addition, simulations with the MARTINI coarse-grain force field have been shown to produce microfibrils with either a right- or left-handed twist depending on the number of constituent cellulose chains, or have otherwise been intentionally parameterized to prevent twisting in finite models.12,13
In defense of the tendency for simulated microfibrils to diverge from the crystallographic coordinates and adopt a twisted conformation, it should be noted that such twisting has also been observed under some experimental conditions. Hanley et al. reported visual evidence for twisting in individual microfibrils with cross-sectional thicknesses of 20–50 nm based on over 100 measurements with transmission electron microscopy (TEM), atomic force microscopy (AFM), and tapping mode AFM (TM-AFM).14 These analyses revealed the presence of a periodic right-handed twist occurring in short segments along the microfibrils. The authors proposed that the segmented nature of twisting was likely an artifact of sample preparation and that when the microfibrils were suspended in aqueous solution, prior to being dried down onto substrates for study, they would have exhibited smooth, uniform twisting over their lengths.
Given the experimental evidence to support a twisted microfibril conformation in water, it might be anticipated that these systems would adopt twisted structures under typical biomolecular simulation conditions. Even so, recent work reported by Matthews et al. has served to further complicate interpretation of simulation data. The authors demonstrated that cellulose Iβ microfibrils studied at elevated temperature (500 K) using the CHARMM C35 and GLYCAM06 force fields develop an inter-layer hydrogen bond network, resulting from widespread reorientation of hydroxymethyl groups, and subsequently untwist to a linear structure representing the high-temperature intermediate (I-HT) for phase transformation between cellulose Iα and Iβ.7 While the I-HT structure appears to agree with high-temperature experimental data and thus suggests appropriate behavior under these conditions, the results of a later study showed that microfibrils simulated at room temperature (300 K) with the same force fields also untwist to the I-HT form on a near-microsecond timescale.9 Because of insufficient conformational sampling, it remains unclear whether this behavior represents structural convergence in the simulation, or whether the twisted and linear states would occur in some equilibrium.
While the results of MD simulations may reasonably reproduce some experimental data, both the initial twisted and eventual I-HT structures they predict at ambient temperature exhibit significant deviations from the crystallographic coordinates for cellulose Iβ. These structural changes raise questions regarding the driving forces responsible for deviations, as well as draw into question the suitability of classical force fields for application to cellulose. To shed light on the structural and dynamic complexities observed in these simulations, the present work probes the initial onset of microfibril twisting by evaluating the effect of microfibril model dimensions, the role of solvent and effect of solvent model, the effect of charge set and application of explicitly modeled oxygen lone pairs, and the overall role of non-bonded interactions. Altogether, the results of this study should serve to enhance the general understanding of cellulose microfibril behavior in water, as well as suggest how best to apply MD simulations for the study of cellulose in broader contexts.
COMPUTATIONAL METHODS
Initial Structures
All initial structures were generated in Mercury 2.015 based on the coordinates for cellulose Iβ reported by Nishiyama et al.,2 with exposed crystallographic faces corresponding to the 11̄0 and 110 planes (Figure 1a). A microfibril of 81 total chains (9 per face), each consisting of 20 glucosyl residues [degree of polymerization (DP) 20] was taken as the representative model for this study, as discussed further in the text.
FIGURE 1.
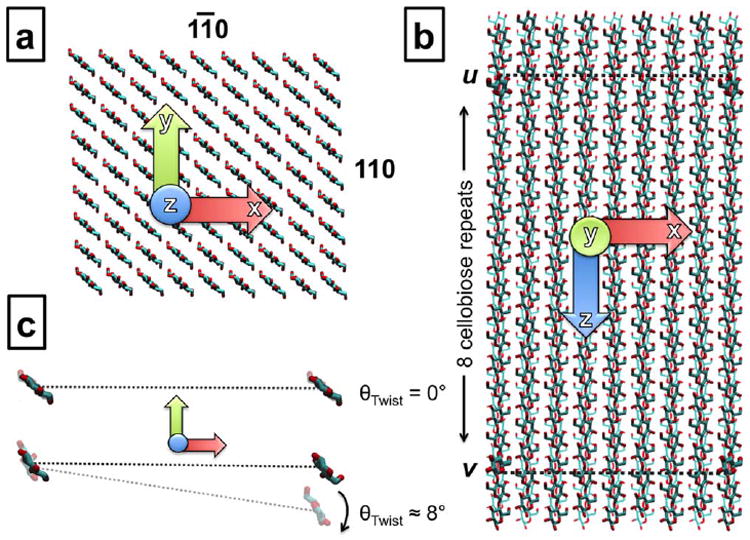
(a) Model microfibrils are oriented along the z-axis with the exposed crystallographic faces corresponding to the 11̄0 and 110 planes on the y- and x-axes, respectively. (b) Vectors ν and u are designated across the 11̄0 plane, perpendicular to the z-axis. (c) Prior to twisting, vectors ν and u are parallel and the angle between them, θTwist, is zero. Upon twisting, the two vectors diverge, resulting in a θTwist of ~8° per cellobiose unit for the 81-chain, DP 20 model.
Charge Calculations
Charges were either employed as developed for the monosaccharide β-D-glucose (Glcβ) in GLYCAM06,16 or recomputed for the methyl glycoside of the trisaccharide Glcβ(1-4)Glcβ(1-4)Glcβ generated from the coordinates for cellulose Iβ2 (Figures 2 and 3). Any water molecules included in the charge derivation were constrained to have charges corresponding to the TIP3P explicit solvent model.17 Quantum mechanical (QM) molecular electrostatic potentials (MEPs) were computed with Gaussian0318 at the HF/6-31G* level of theory to maintain consistency with the GLYCAM06 charge development protocol.16,19 The MEPs were sampled at grid points according to the CHELPG scheme.20 Partial atomic charges were obtained via fitting a classical electrostatic potential (ESP) to the QM MEPs using the restrained ESP (RESP) method.21,22 Alternate charges for the nonreducing terminal residue in each cellulose chain (GLYCAM residue 0GB) were taken from the nonreducing glucosyl unit of the trisaccharide model, while charges for the repeating internal residue (4GB) were taken from the center glucosyl unit.
FIGURE 2.
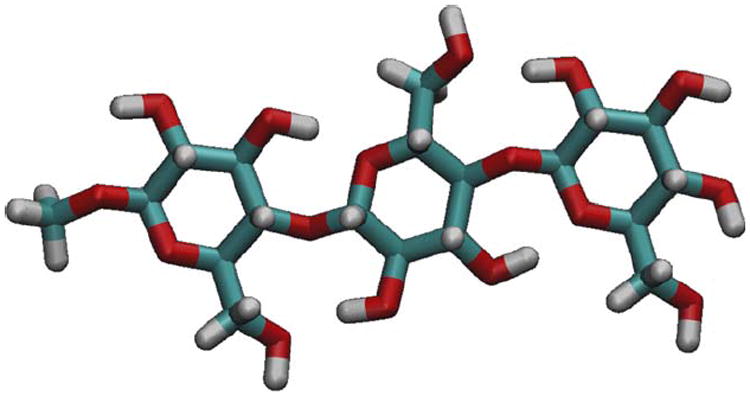
A trisaccharide fragment of cellulose Iβ was employed for derivation of charges to account for internal polarization of the cellulose polymer. This is referred to as the chain-polarized charge model.
FIGURE 3.
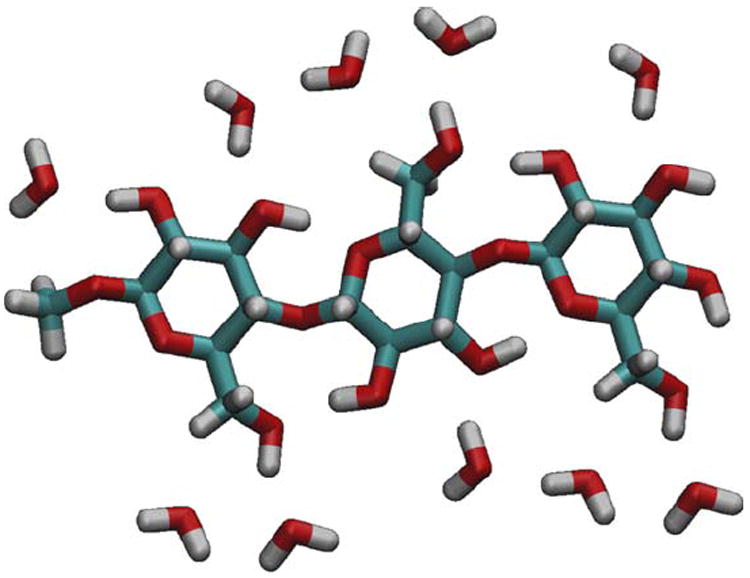
The chain-polarized charge model was augmented with 10 water molecules to represent contacting hydroxyl groups from neighboring polysaccharide chains according to the crystallographic coordinates.2 This accounts for polarization arising from both the polymeric and crystalline aspects of cellulose structure, and is referred to as the crystal-polarized charge model.
MD Simulations
MD simulations were performed with the GPU implementation of pmemd, pmemd.cuda_SPDP,23,24 from AMBER12,22 using the GLYCAM0616 (version h) force field for carbohydrates and the TIP3P17 water model, unless otherwise indicated.
Model microfibrils were solvated with a 1.2 nm water buffer, which was subjected to energy minimization (12,500 steps steepest descent, 12,500 steps conjugate gradient). Full systems were then subjected to further energy minimization (12,500 steps steepest descent, 12,500 steps conjugate gradient), followed by heating from 0–300 K over 25 ps. Production simulations were performed at constant pressure (NPT) with a pressure relaxation time of 1 ps. A Berendsen-type thermostat with a time coupling constant of 1 ps was invoked for temperature regulation. All covalent bonds involving hydrogen atoms were constrained using the SHAKE25 algorithm, allowing a simulation time step of 2 fs. Scaling factors for 1–4 nonbonded interactions were set to unity,26 and a nonbonded interaction cutoff of 0.8 nm was employed. Long-range electrostatics were computed with the particle mesh Ewald (PME) method.45 Systems were equilibrated for 1 ns prior to data collection, with the exception of an extended-length (DP 106) model, which was equilibrated for 2 ns. The timescale for production simulations was 10 ns unless otherwise noted.
Quantifying Microfibril Twist
To quantitatively assess twisting behavior, a metric to characterize the angle of twist (θTwist) along the microfibril axis was defined. Two vectors were designated on the 11̄0 face of the microfibril, perpendicular to the axis, between the C1 (ν) and O4 (u) atoms of the n – 2 glucosyl residues of the outermost cellulose chains of the face (Figure 1b). Antepenultimate (n – 2) residues were chosen to avoid artifacts from any disorder in the terminal residues that might arise during simulation. These vectors are parallel in the crystallographic structure (θTwist = 0°), but diverge by θTwist as the microfibril twists (Figure 1c). The value of θTwist is readily calculated from the dot product of the two vectors, ν and u [Eq. (1)].
| (1) |
To allow for comparisons between microfibrils of varying dimension, all calculated values of θTwist were normalized by the number of cellobiose repeats encompassed by the vectors. Normalization to cellobiose repeats instead of DP facilitated comparison to values reported per cellobiose unit in previous studies.4 Values of θTwist were time-averaged over simulation trajectories to give <θTwist>. Error estimates reported for values of <θTwist> represent standard deviation of the mean (SDM) and were calculated by averaging results from the two statistical inefficiency methods detailed by Foley et al.27
RESULTS AND DISCUSSION
Model Microfibril
Previous simulation studies of finite microfibril models report bulk twisting along the axis in which outer chains circumscribe inner chains in a concentric fashion,4-12 suggesting a direct relationship between cross-sectional thickness and the magnitude of <θTwist> observed. Larger models composed of greater numbers of chains should be expected to exhibit smaller values of <θTwist>, and simulation results for a series of microfibrils ranging from 9 to 289 constituent chains follow this trend (Figure 4). These values represent the characteristic magnitudes of <θTwist> observed for microfibrils of given thicknesses according to the GLYCAM06 force field under typical simulation conditions.
FIGURE 4.
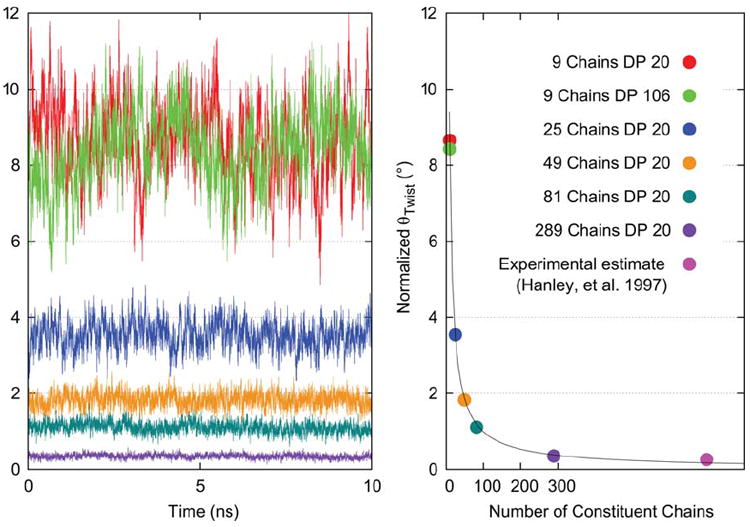
Calculated values of θTwist plotted over time and averaged over 10 ns simulation trajectories for models ranging from 9 to 289 constituent chains. Values are per cellobiose unit.
The largest model studied here (289 chains) measures ~11.1 nm across the 11̄0 face, ~9.6 nm across the 110 face, and displays a <θTwist> of 0.35° per cellobiose (Figure 4). According to TEM, AFM, and TM-AFM studies by Hanley et al.,14 a smooth, uniform twisting could be extrapolated to have a 1400 nm repeat length. This corresponds to 360° of twist per 2800 glucosyl units, or 0.26° of twist per cellobiose unit for microfibrils in the 20–50 nm thickness regime, implying the degree of twisting predicted by simulation may not be unreasonable. Furthermore, recent work by Nishiyama et al.28 on theoretical fiber diffraction patterns calculated from model crystals suggests that a subtle degree of twist, such as that observed by Hanley et al., would not interfere with the development of a diffraction pattern and is not necessarily inconsistent with the crystallographic data.
Although microfibril thickness is known to depend on cellulosic source, experimental evidence to support exact sizes for microfibrils of a given origin remains controversial. An elementary fibril of 36 chains has become widely accepted as the representative structure for plant-based cellulose; however, Nishiyama et al.28 have recently presented results suggesting a structure containing 64–100 chains (8–10 per face) for cotton cellulose. As the present work ultimately seeks to lay a foundation for understanding the interactions of water molecules with cotton fiber, microfibrils corresponding to this cross-sectional thickness regime were of primary interest. A model of 81 chains (9 per face) was therefore selected as the representative microfibril structure for further use in this study.
While microfibrils can range naturally to thousands of residues in length with intermittent amorphous regions, previous simulation work has explored lengths corresponding to only DP 10–40.4-12 Evaluation of a 9-chain, DP 106 model showed the magnitude of <θTwist> to be highly comparable to the value obtained for a 9-chain, DP 20 model (Figure 4), suggesting the characteristic magnitude of <θTwist> observed for a microfibril of given thickness is independent of microfibril length. Since no notable length dependence was observed for values of <θTwist>, the representative structure of 81 chains was assigned DP 20.
As the focus of this study was the initial tendency of microfibrils to adopt a twisted conformation, preliminary simulations explored timescales of only 10 ns to collect statistics on the twisted structure after transition from the crystallographic coordinates. Once dimensions for the representative structure were established, simulations were extended to the 50 ns time-scale under both constant pressure (NPT) and constant volume (NVT) conditions (Figure 5). While the use of different thermodynamic ensembles produced no significant variation in twisting behavior, the magnitude of <θTwist> was observed to trend downward when averaged over progressively longer timescale increments. This cannot necessarily be interpreted as suggesting convergence of the twisted structure over time, as similar systems have been shown to gradually converge to a structure that no longer corresponds to cellulose Iβ.9 Nevertheless, beyond 5 ns of simulation, the rate of decrease of <θTwist> was relatively slow. Given this, and in order to avoid the possibility that structures would begin to deviate markedly from the cellulose Iβ form, a 10 ns timescale was deemed acceptable for drawing relative comparisons between models. A summary of data collected in this study for the representative 81-chain, DP 20 microfibril averaged over 10 ns simulation trajectories is presented in Figure 6.
FIGURE 5.
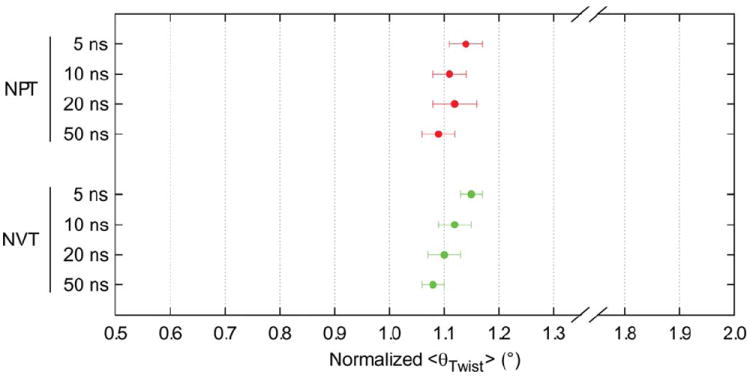
Values of <θTwist> collected for the representative microfibril of 81 chains, DP 20 over timescales of up to 50 ns with NPT and NVT ensembles. Values are per cellobiose unit. Error bars are SDM. Root-mean-squared fluctuations were within 13°–14°.
FIGURE 6.
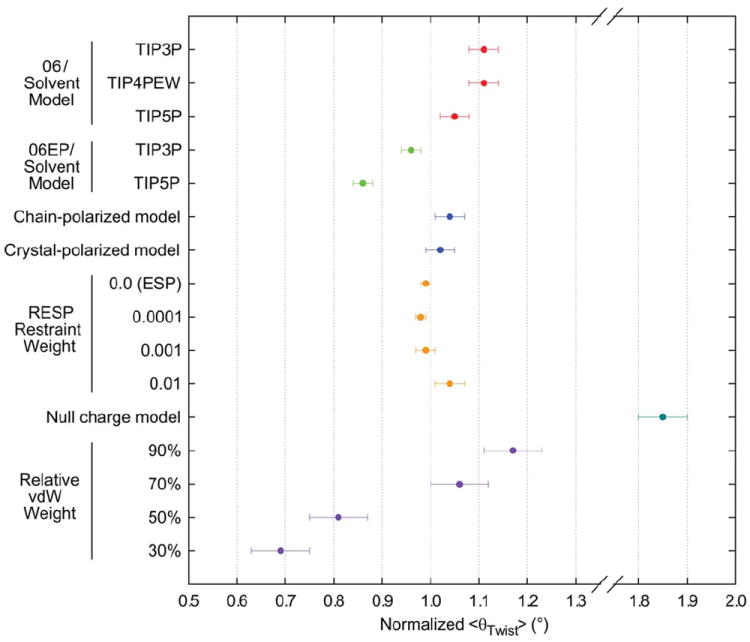
Summary of <θTwist> data collected in this study, plotted as a function of force field, solvent model, and varied nonbonded force field parameters. Values are per cellobiose unit, averaged over 10 ns simulation trajectories. Error bars are SDM.
Solvent Effects
While the crystallographic coordinates for cellulose represent the ordered interior of a large, solid phase structure, cellulose microfibrils based on these coordinates constitute comparatively small, isolated crystalline assembles. Furthermore, simulation studies of microfibrils generally aim to understand the dynamic behavior and intermolecular interactions of these assemblies in the context of an aqueous environment, necessitating the addition of solvent. A short (800 ps) in vacuo simulation displayed extreme deformation, indicating that the physical presence of water plays a critical role in mitigating the extent of twisting that would otherwise occur (Figure 7). Although the representative 81-chain, DP 20 model displayed normalized <θTwist> values of ~1° when solvated with TIP3P (Figures 4-6), the value from the in vacuo simulation rose to nearly 14° before equilibrating to ~6°. Implicit solvent simulations employing a series of generalized Born models as implemented in AMBER12 (igb = 1,29-31 2,32,33 5,33 834,35) all produced microfibrils that fragmented or peeled into constituent cellulose chains, further demonstrating the importance of explicit solvent in this system.
FIGURE 7.
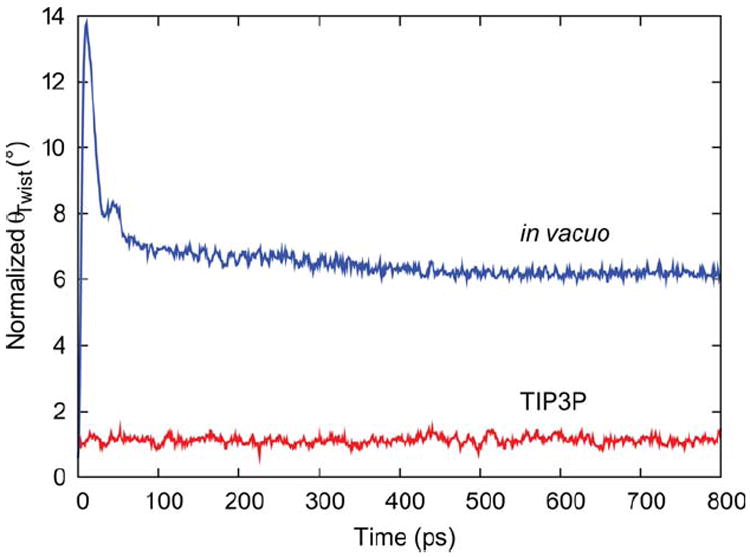
Calculated values of θTwist plotted over time for a short (800 ps) in vacuo simulation, and a simulation employing TIP3P explicit water. Values are per cellobiose unit.
Solvent Model
Having established the critical role of water in microfibril simulations, two additional commonly employed explicit solvent models were evaluated. Employing TIP4PEW36 produced results that were remarkably comparable to that of TIP3P (Figure 6), indicating that improved modeling of bulk water properties has no effect on microfibril behavior. Alternatively, employing TIP5P, 37 which includes lone pairs on oxygen atoms to better reproduce both bulk water properties and the tetrahedral geometry of hydrogen bonds, resulted in a noticeable reduction of <θTwist> (Figure 6). This implicates solvent hydrogen bonding as a determining factor in twisting behavior.
Analysis of the radial distribution function (RDF) for water oxygen atoms around a representative solvent-exposed hydroxymethyl hydrogen (H6O) on the 11̄0 face of the microfibril (Figure 8) indicates that TIP5P binds more tightly, and displays a significantly higher occupancy in the first solvation shell as compared to TIP3P. Decomposition of the molecular mechanical (MM) contributions to interaction energy between microfibril and solvent also shows that TIP5P is preferred over TIP3P by more than 2000 kcal/mol due to more favorable electrostatic interactions with the microfibril surface (Figure 9). Previous computational studies have demonstrated that TIP5P enhances specific solvation and results in more highly conserved and optimally coordinated water interactions in biomolecules, which can impact the dynamics and conformational preferences of flexible systems.38,39 While the mechanism by which tighter interaction with solvent leads to a decrease in <θTwist> is unclear, significant solvent structuring is known to occur around cellulose surfaces,4,40,41 and it may be that increased order in this structure serves to restrict twisting motion. This is consistent with the observation that the physical presence of water restricts twisting relative to vacuum conditions.
FIGURE 8.
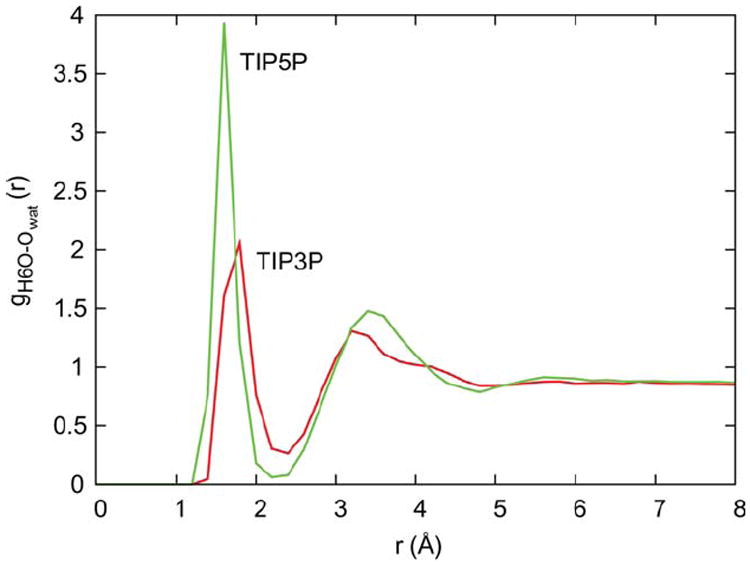
Radial distribution functions for TIP3P (red) and TIP5P (green) water oxygen atoms around a representative solvent-exposed hydroxymethyl hydrogen atom (H6O) on the 11̄0 microfibril surface.
FIGURE 9.
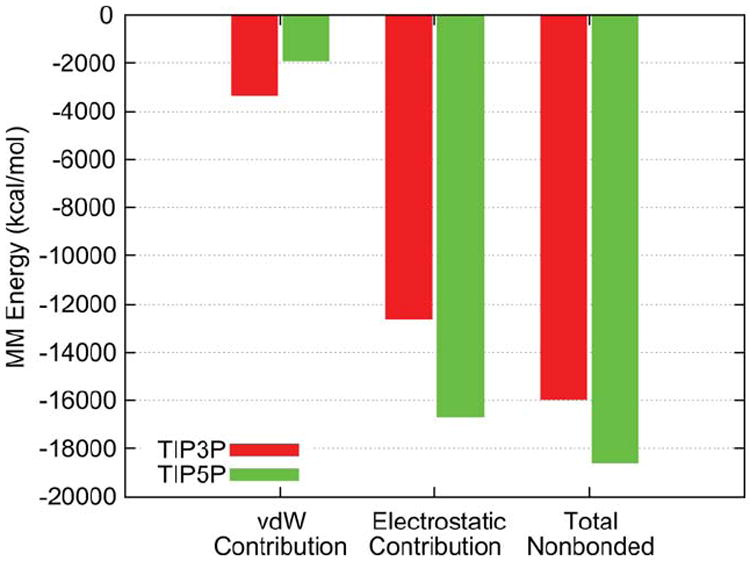
Molecular mechanics interaction energies between microfibril and water, decomposed into vdW and electrostatic contributions for TIP3P and TIP5P solvent models.
Solute Lone Pairs
As the use of an explicit solvent model employing lone pairs on oxygen atoms produced a noticeable effect on the magnitude of <θTwist>, additional simulations were performed with the GLYCAM06EP42 carbohydrate force field, which includes lone pairs on carbohydrate oxygen atoms. While the magnitude of <θTwist> was markedly reduced with GLYCAM06EP relative to GLYCAM06 in TIP3P solvent, this value was substantially reduced when GLYCAM06EP was combined with TIP5P solvent (Figure 6). Comparing the standard model (GLYCAM06 with TIP3P) to the full lone pair model (GLYCAM06EP with TIP5P), the overall values for <θTwist> differ by 0.25° per cellobiose. As with TIP5P, the addition of lone pairs in GLYCAM06EP improves hydrogen bond directionality and has been shown to better preserve unit cell dimensions when simulating crystalline carbohydrate assemblies.42 Furthermore, use of lone pairs on the solute also appears to enhance the surface solvent effects observed with TIP5P, resulting in increased order in the surrounding solvent structure, which apparently serves to mitigate twisting. These data underscore the role of hydrogen bonds as critical determinants of cellulose structure, both in terms of the internal network, as well as at the microfibril surface. In particular, simulations with GLYCAM06EP suggest that the internal hydrogen bond network resists the tendency to twist and that this effect is sensitive to the manner in which these charge interactions are modeled. Tighter error bars for the calculated values of <θTwist> (Figure 6) indicate that refinement of the internal hydrogen bond network enhances overall structural stability.
Charge Model
Given the importance of internal hydrogen bonds to cellulose microfibril structure and the sensitivity of modeled hydrogen bonds to charge parameterization protocols, the effect of charge model was evaluated. To reduce computational expense, most biomolecular force fields do not account for charge polarization, but instead employ invariant partial atomic charges whose molecular distributions are dependent on the conformation of the model used for their development. While the charges in GLYCAM06 were derived based on isolated monosaccharides in solution to facilitate modularity and broad applicability, such fixed charges are unable to adjust to changes in local environment, including assembly of monomeric units into polymers or a crystalline lattice, as found in cellulose.
An alternative charge set designed to account for changes in charge distribution induced by the polymeric nature of cellulose structure was developed based on a trisaccharide fragment of cellulose Iβ (Figure 2). Simulations employing these chain-polarized charges resulted in a reduction in the magnitude of <θTwist>, with error bars comparable to that of standard GLYCAM06 in TIP3P under equivalent simulation conditions (Figure 6). This refined charge distribution serves to polarize and thus strengthen the hydrogen bond network that extends down the length of each cellulose chain. Two key hydrogen bonds are those that span each of the glycosidic linkages (O3–O5’ and O6–O2’), and variations in their relative strength may be expected to directly impact the torsional properties of these linkages.
A second alternative charge set designed to account for changes in charge distribution induced by both the polymeric and crystalline aspects of cellulose structure was also developed. This was accomplished by augmenting the chain-polarized charge model with 10 water molecules representing contacting hydroxyl groups of neighboring polysaccharide chains according to the crystallographic coordinates (Figure 3). Simulations applying these crystal-polarized charges displayed only a slight reduction in the value of <θTwist> beyond that already imparted by the chain-polarized charge model (Figure 6). This result indicates that, while interchain hydrogen bonds are clearly associated with organization of cellulose chains into layers, electrostatic polarization from such interactions contributes only a modest stabilizing force. In contrast, polarization of the intrachain hydrogen bonds plays a significant role in resisting the tendency to twist by constraining the individual torsional properties of the glycosidic linkages.
Charge Restraint Weight
An additional factor of charge development protocol that can influence the strength of modeled hydrogen bonds is the choice of restraint weight (kRstr). In GLYCAM06 and other AMBER-family force fields, the 6-31G* basis set is generally employed for the QM calculation of MEPs for charge derivations, as it suitably reproduces biomolecular properties for use in condensed phase simulations. However, the ESP charges produced with this basis set tend to overstate bond polarity, such that a hyperbolic restraint function is commonly applied during fitting in order to compensate [Eqs. (2) and (3)].19,21
| (2) |
where
| (3) |
The standard GLYCAM06 charge development protocol uses a restraint weight of 0.01 for calculation of these RESP charges.19,43 To probe the sensitivity of the cellulose internal hydrogen bond network to attenuation of bond polarity, as determined by the choice of this value, a series of RESP charges were developed based on the chain-polarized trisaccharide model described above (Figure 2), employing restraint weights ranging from 0–0.01. Simulations with these charge sets all resulted in a reduction of <θTwist> (Figure 6). The majority of this effect arises from use of the chain-polarized charge model, which strengthens the intrachain hydrogen bonds. Use of restraint weights less than 0.01 led to a further reduction of <θTwist> that may be directly attributed to enhanced bond polarity imparting additional strength to this network. The error ranges for values of <θTwist> decrease with increasing bond polarity (Figure 6), indicating greater overall microfibril stability. As noted in previous sections, the cellulose internal hydrogen bond network, particularly the intrachain network, is a critical determinant of the extent of twisting, and accurate modeling of microfibril behavior will likely depend on the force field’s ability to capture the characteristics of charge interactions in the context of this crystalline lattice.
Internal Nonbonded Interactions
To probe the overall role of electrostatics in microfibril behavior, a simulation was performed in which all atoms in the microfibril were assigned a charge of zero to create a “null charge” model. In the absence of all internal electrostatic interactions, the magnitude of <θTwist> was considerably enhanced (Figure 6), indicating that twisting behavior is not fundamentally driven by electrostatics. Although this increase might stem partially from a lack of electrostatic repulsion between layers, it is likely also related to the absence of the internal hydrogen bond network, particularly the intrachain network, which serves as an essential stabilizing framework that resists the tendency to twist.
The observation that significant twisting occurs in the absence of any solute electrostatics implicates van der Waals (vdW) interactions as a key contributing factor. Notably, recent ab initio QM studies of cellulose structure suggest that dispersion interactions are largely responsible for the stability of stacked layers in the crystalline assembly.44
Classical force fields, such as those from the AMBER family, often employ a 12-6 Lennard-Jones potential to model vdW interactions between atoms (Eq. 4).
| (4) |
where ε defines the well depth, or strength of the pairwise association.
To investigate the overall function of vdW interactions with regard to twisting behavior, a series of simulations were performed in which ε was scaled to percentages ranging from 90–30% of the default. While this alteration induced some structural instability, as was to be expected, the results nevertheless showed the magnitude of <θTwist> decreasing dramatically as ε was reduced (Figure 6). That is, as the vdW interactions within the microfibril were artificially diminished, the structure became less twisted. Combined with the results from the “null charge” model simulation, this analysis suggests that attractive vdW interactions within the microfibril contribute a driving force responsible for twisting behavior, likely seeking to maximize crystal packing efficiency in the twisted structure. In contrast, electrostatic interactions provide a balancing resistance to twisting.
CONCLUSIONS
Previous simulation studies of cellulose Iβ microfibrils have demonstrated the tendency for these structures to diverge from the linearly oriented crystallographic coordinates and adopt a twisted conformation.4-12 The present work sought to understand the driving forces behind this behavior, as well as to determine how computational methodology might play into it, through evaluation of model microfibril dimensions, the role of solvent and effect of solvent model, the effect of charge set and application of explicitly modeled oxygen lone pairs, and the overall role of nonbonded interactions. The results indicate that a balance of competing forces ultimately determines the extent of microfibril twisting observed in a given simulation. While twisting appears to be driven by attractive vdW (dispersion) interactions seeking to maximize crystal packing efficiency between layers, it is mitigated by both the intrachain hydrogen bond network, which influences the torsional properties of the glycosidic linkages, and solvent effects at the microfibril surface. As the strength and geometry of modeled hydrogen bonds are sensitive to charge development protocols and to the relative positioning of oxygen partial charges, the most accurate atomistic modeling of cellulose structure likely necessitates use of prepolarized charge distributions that describe β-D-glucose in the context of the cellulose crystalline lattice. Further, to optimally reproduce the internal hydrogen bond network, unit cell dimensions, and the resulting magnitude of microfibril twist, improved electrostatic directionality, such as imparted by the oxygen lone pairs employed in GLYCAM06EP, is required. The physical presence of solvent also serves to significantly mitigate the extent of twisting, and this effect is enhanced by the ability of the explicit solvent model to induce well-ordered, tightly coordinated water structure at the cellulose surface.
The magnitude of the microfibril twist resulting from the balance of these inter- and intramolecular forces depends on the cross-sectional thickness of the model employed for simulation, with models composed of greater numbers of constituent chains exhibiting increasingly subtle twisting behavior. Comparison of <θTwist> values collected in this study with experimental estimates based on data from Hanley et al.14 suggest that the degree of twist predicted by MD simulation is not unreasonable and that current computational methodology is thus adequate to provide a suitable representation of microfibril behavior in the presence of aqueous solution, at least on relatively short simulation timescales. Further work is needed to assess the affect of system parameterization on long timescale behavior, given the report by Matthews et al.19 describing eventual transition of the twisted cellulose Iβ structure to the I-HT form. As this transition results from a gradual disruption of the internal hydrogen bond network due to widespread reorientation of hydroxymethyl groups, improved modeling of partial atomic charge distributions and hydrogen bond geometries in both solute and solvent, as discussed in this study, may be required to enhance microfibril stability and preserve the cellulose Iβ structure over extended simulation timescales.
Acknowledgments
Contract grant sponsor: Cotton, Inc
Contract grant sponsor: National Institutes for Health
Contract grant number: GM094919 (EUREKA)
Contract grant sponsor: Science Foundation of Ireland
Contract grant number: 08/IN.1/B2070
References
- 1.Doblin MS, Kurek I, Jacob-Wilk D, Delmer DP. Plant Cell Physiol. 2002;43:1407–1420. doi: 10.1093/pcp/pcf164. [DOI] [PubMed] [Google Scholar]
- 2.Nishiyama Y, Langan P, Chanzy H. J Am Chem Soc. 2002;124:9074–9082. doi: 10.1021/ja0257319. [DOI] [PubMed] [Google Scholar]
- 3.Nishiyama Y, Sugiyama J, Chanzy H, Langan P. J Am Chem Soc. 2003;125:14300–14306. doi: 10.1021/ja037055w. [DOI] [PubMed] [Google Scholar]
- 4.Matthews JF, Skopec CE, Mason PE, Zuccato P, Torget RW, Sugiyama J, Himmel ME, Brady JW. Carbohydr Res. 2006;341:138–152. doi: 10.1016/j.carres.2005.09.028. [DOI] [PubMed] [Google Scholar]
- 5.Yui T, Nishimura S, Akiba S, Hayashi S. Carbohydr Res. 2006;341:2521–2530. doi: 10.1016/j.carres.2006.04.051. [DOI] [PubMed] [Google Scholar]
- 6.Yui T, Hayashi S. Biomacromolecules. 2007;8:817–824. doi: 10.1021/bm060867a. [DOI] [PubMed] [Google Scholar]
- 7.Matthews JF, Bergenstrahle M, Beckham GT, Himmel ME, Nimlos MR, Brady JW, Crowley MF. J Phys Chem B. 2011;115:2155–2166. doi: 10.1021/jp1106839. [DOI] [PubMed] [Google Scholar]
- 8.Paavilainen S, Rog T, Vattulainen I. J Phys Chem B. 2011;115:3747–3755. doi: 10.1021/jp111459b. [DOI] [PubMed] [Google Scholar]
- 9.Matthews JF, Beckham GT, Bergenstrahle-Wohlert M, Brady JW, Himmel ME, Crowley MF. J Chem Theory Comput. 2012;8:735–748. doi: 10.1021/ct2007692. [DOI] [PubMed] [Google Scholar]
- 10.Bu LT, Beckham GT, Crowley MF, Chang CH, Matthews JF, Bomble YJ, Adney WS, Himmel ME, Nimlos MR. J Phys Chem B. 2009;113:10994–11002. doi: 10.1021/jp904003z. [DOI] [PubMed] [Google Scholar]
- 11.Glass DC, Moritsugu K, Cheng XL, Smith JC. Biomacromolecules. 2012;13:2634–2644. doi: 10.1021/bm300460f. [DOI] [PubMed] [Google Scholar]
- 12.Wu S, Zhan HY, Wang HM, Ju Y. Chin J Chem Phys. 2012;25:191–198. [Google Scholar]
- 13.Wohlert J, Berglund LA. J Chem Theory Comput. 2011;7:753–760. [Google Scholar]
- 14.Hanley SJ, Revol JF, Godbout L, Gray DG. Cellulose. 1997;4:209–220. [Google Scholar]
- 15.Macrae CF, Bruno IJ, Chisholm JA, Edgington PR, McCabe P, Pidcock E, Rodriguez-Monge L, Taylor R, van de Streek J, Wood PA. J Appl Crystallogr. 2008;41:466–470. [Google Scholar]
- 16.Kirschner KN, Yongye AB, Tschampel SM, Gonzalez-Outeirino J, Daniels CR, Foley BL, Woods RJ. J Comput Chem. 2008;29:622–655. doi: 10.1002/jcc.20820. [DOI] [PMC free article] [PubMed] [Google Scholar]
- 17.Jorgensen WL, Chandrasekhar J, Madura JD, Impey RW, Klein ML. J Chem Phys. 1983;79:926–935. [Google Scholar]
- 18.Frisch MJ, Trucks GW, Schlegel HB, Scuseria GE, Robb MA, Cheeseman JR, Montgomery JJA, Jr, Vreven T, Kudin KN, Burant JC, Millam JM, Iyengar SS, Tomasi J, Barone V, Mennucci B, Cossi M, Scalmani G, Rega N, Petersson GA, Nakatsuji H, Hada M, Ehara M, Toyota K, Fukuda R, Hasegawa J, Ishida M, Nakajima T, Honda Y, Kitao O, Nakai H, Klene M, Li X, Knox JE, Hratchian HP, Cross JB, Bakken V, Adamo C, Jaramillo J, Gomperts R, Stratmann RE, Yazyev O, Austin AJ, Cammi R, Pomelli C, Ochterski JW, Ayala PY, Morokuma K, Voth GA, Salvador P, Dannenberg JJ, Zakrzewski VG, Dapprich S, Daniels AD, Strain MC, Farkas O, Malick DK, Rabuck AD, Raghavachari K, Foresman JB, Ortiz JV, Cui Q, Baboul AG, Clifford S, Cioslowski J, Stefanov BB, Liu G, Liashenko A, Piskorz P, Komaromi I, Martin RL, Fox DJ, Keith T, Al-Laham MA, Peng CY, Nanayakkara A, Challacombe M, Gill PMW, Johnson B, Chen W, Wong MW, Gonzalez C, Pople JA. Gaussian 03. Wallingford, CT: Gaussian Inc.; 2004. [Google Scholar]
- 19.Woods RJ, Chappelle R. Theochem J Mol Struct. 2000;527:149–156. doi: 10.1016/S0166-1280(00)00487-5. [DOI] [PMC free article] [PubMed] [Google Scholar]
- 20.Breneman CM, Wiberg KB. J Comput Chem. 1990;11:361–373. [Google Scholar]
- 21.Bayly CI, Cieplak P, Cornell WD, Kollman PA. J Phys Chem. 1993;97:10269–10280. [Google Scholar]
- 22.Case DA, Darden TA, Cheatham TE, I, Simmerling CL, Wang J, Duke RE, Luo R, Walker RC, Zhang W, Merz KM, Roberts B, Hayik S, Roitberg A, Seabra G, Swails J, Götz AW, Kolossváry I, Wong KF, Paesani F, Vanicek J, Wolf RM, Liu J, Wu X, Brozell SR, Steinbrecher T, Gohlke H, Cai Q, Ye X, Wang J, Hsieh M-J, Cui G, Roe DR, Mathews DH, Seetin MG, Salomon-Ferrer R, Sagui C, Babin V, Luchko T, Gusarov S, Kovalenko A, Kollman PA. Amber 12. San Francisco: University of California; 2012. [Google Scholar]
- 23.Gotz AW, Williamson MJ, Xu D, Poole D, Le Grand S, Walker RC. J Chem Theory Comput. 2012;8:1542–1555. doi: 10.1021/ct200909j. [DOI] [PMC free article] [PubMed] [Google Scholar]
- 24.Salomon-Ferrer R, Gotz AW, Poole D, Le Grand S, Walker RC. J Chem Theory Comput. 2013 doi: 10.1021/ct400314y. in press. [DOI] [PubMed] [Google Scholar]
- 25.Ryckaert JP, Ciccotti G, Berendsen HJC. J Comput Phys. 1977;23:327–341. [Google Scholar]
- 26.Kirschner KN, Woods RJ. Proc Natl Acad Sci U S A. 2001;98:10541–10545. doi: 10.1073/pnas.191362798. [DOI] [PMC free article] [PubMed] [Google Scholar]
- 27.Foley BL, Woods RJ. A lightweight, practical method for estimating mean value errors in statistically non-ideal data. J Comput Chem. in preparation. [Google Scholar]
- 28.Nishiyama Y, Johnson GP, French AD. Cellulose. 2012;19:319–336. [Google Scholar]
- 29.Hawkins GD, Cramer CJ, Truhlar DG. Chem Phys Lett. 1995;246:122–129. [Google Scholar]
- 30.Hawkins GD, Cramer CJ, Truhlar DG. J Phys Chem. 1996;100:19824–19839. [Google Scholar]
- 31.Tsui V, Case DA. Biopolymers. 2000;56:275–291. doi: 10.1002/1097-0282(2000)56:4<275::AID-BIP10024>3.0.CO;2-E. [DOI] [PubMed] [Google Scholar]
- 32.Onufriev A, Bashford D, Case DA. J Phys Chem B. 2000;104:3712–3720. [Google Scholar]
- 33.Onufriev A, Bashford D, Case DA. Proteins. 2004;55:383–394. doi: 10.1002/prot.20033. [DOI] [PubMed] [Google Scholar]
- 34.Mongan J, Simmerling C, McCammon JA, Case DA, Onufriev A. J Chem Theory Comput. 2007;3:156–169. doi: 10.1021/ct600085e. [DOI] [PMC free article] [PubMed] [Google Scholar]
- 35.Shang Y, Nguyen H, Wickstrom L, Okur A, Simmerling C. J Mol Graph. 2011;29:676–684. doi: 10.1016/j.jmgm.2010.11.013. [DOI] [PMC free article] [PubMed] [Google Scholar]
- 36.Horn HW, Swope WC, Pitera JW, Madura JD, Dick TJ, Hura GL, Head-Gordon T. J Chem Phys. 2004;120:9665–9678. doi: 10.1063/1.1683075. [DOI] [PubMed] [Google Scholar]
- 37.Mahoney MW, Jorgensen WL. J Chem Phys. 2000;112:8910–8922. [Google Scholar]
- 38.Florova P, Sklenovsky P, Banas P, Otyepka M. J Chem Theory Comput. 2010;6:3569–3579. doi: 10.1021/ct1003687. [DOI] [PubMed] [Google Scholar]
- 39.Fadda E, Woods RJ. J Chem Theory Comput. 2011;7:3391–3398. doi: 10.1021/ct200404z. [DOI] [PubMed] [Google Scholar]
- 40.Heiner AP, Teleman O. Langmuir. 1997;13:511–518. [Google Scholar]
- 41.Heiner AP, Kuutti L, Teleman O. Carbohydr Res. 1998;306:205–220. [Google Scholar]
- 42.Tschampel SM, Kennerty MR, Woods RJ. J Chem Theory Comput. 2007;3:1721–1733. doi: 10.1021/ct700046j. [DOI] [PMC free article] [PubMed] [Google Scholar]
- 43.Basma M, Sundara S, Calgan D, Vernali T, Woods RJ. J Comput Chem. 2001;22:1125–1137. doi: 10.1002/jcc.1072. [DOI] [PMC free article] [PubMed] [Google Scholar]
- 44.Li Y, Lin ML, Davenport JW. J Phys Chem C. 2011;115:11533–11539. [Google Scholar]
- 45.Darden T, York D, Pedersen L. J Chem Phys. 1993;98:10089–11539. [Google Scholar]


