

Abstract
The enzyme, tyramine β-monoxygenase (TβM), belongs to a small eukaryotic family of physiologically important mononuclear dicopper monooxygenases. The properties of this family include non-coupled mononuclear copper centers ca. 11 Å apart, with the CuM performing C–H and O2 activation and CuH functioning as an electron storage site [Klinman, J.P. (2006) J. Biol. Chem. 281, 3013–3016]. A conserved tyrosine (Y216 in TβM) is positioned between the copper domains and is associated with CuH (through an interaction with a CuH-coordinating histidine). Mutations at Y216 (to W, I and A) indicate little or no difference in EPR spectra, while XAS studies show only a very small decrease in distance between the CuM and its Met471 ligand in reduced enzyme. HPLC assays demonstrate that turnover of substrate is complete with Y216W and Y216I, whereas Y216A undergoes a secondary inactivation that is linked to oxidation of ligands at CuM. Steady-state kinetic and isotope effect measurements were investigated. The significantly elevated Km,Tyr for Y216A, together with a very large D(kcat/Km,Tyr) ~ 12, indicate a major impact on the binding of substrate at the CuM site. The kinetic and isotopic parameters lead to estimated rate constants for C–H bond cleavage, substrate dissociation from the CuM site and, in the case of Y216A, the rate of electron transfer (ET) from CuH to CuM. These studies uncover a rate-limiting ET within the solvent-filled interface, and lead to a paradigm shift in our under-standing of the mononuclear dicopper monooxygenases.
Keywords: Copper monooxygenases, electron transfer, solvent-exposed active site, kinetic isotope effects, rate-determining steps, site-specific mutagenesis
Tyramine β-monooxygenase (TβM) is the insect homolog of dopamine β-monooxygenase (DβM) and regulates the biosynthesis of invertebrate neurotransmitters. TβM hydroxylates the β-position of tyramine to yield octopamine (Eq. 1) (1):
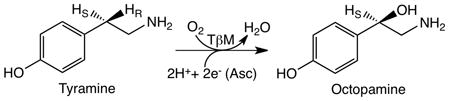 |
(1) |
TβM and DβM belong to a small family of eukaryotic, mononuclear dicopper monooxygenases that includes peptidylglycine α-hydroxylating monooxygenase (PHM) (2). PHM, which is part of the bifunctional enzyme peptidylglycine α-amidating monooxygenase (PAM), hydroxylates glycine extended peptides at the α-position en route to C-terminally carboxamidated peptide hormones (3). Early studies on this family of enzymes established that the mechanism is highly conserved despite the significantly different substrate specificity for PHM compared to DβM/TβM (2–4). The recently developed high-yield insect expression system for TβM (4) has enabled the pursuit of challenging mechanistic questions, which include the timing and energetics for ET between the copper sites, more readily accessible.
Structural information about TβM/DβM is inferred from primary amino acid sequence alignments, together with a series of X-ray structures for PHM (5–8) that support and confirm the copious and comprehensive spectroscopic investigations carried out on all three enzymes (3,4,9–14). These enzymes contain two distinct copper domains: CuM, which is coordinated by two histidines and a methionine, and is the site of O2 and substrate activation (7,9); and CuH, which is ligated by three histidine residues and stores the second electron required to complete enzymatic turnover (Figures 1A and B) (9). Interestingly, structures reveal that the copper domains are solvent-exposed and separated by ~11 Å (5–8). How these enzymes hydroxylate their substrates, a process that requires transfer of an electron across a solvent-exposed active site is intensely debated and still not well understood.
Figure 1.

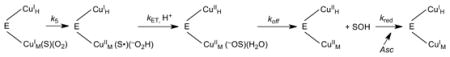
A. X-ray crystal structure of the catalytic core of peptidylglycine α-hydroxylating monooxygenase (PDB: 1PHM) (5). B. The active site is enlarged to show the coordinating ligands to CuM (H242, H244, and M314) and CuH (H107, H108, and H172) and the conserved tyrosine (Y79 in PHM and Y216 in TβM) that is the focus of this study. Residue numbers are shown for PHM (without parentheses) and TβM (with parentheses). C. Consensus mechanism through the first irreversible step (22, 24). Waters are visualized in the last frame only, to illustrate a possible conduit for proton-coupled electron transfer from CuH to CuM.
The TβM/DβM/PHM operate via a formal ping-pong kinetic mechanism, with the resting Cu(II) form of enzyme undergoing reduction to Cu(I) by ascorbate. The reduced enzyme is subsequently oxidized after binding of O2 and substrate, via the formation of a CuM(II)-superoxo species as the active agent in C–H bond cleavage (15–18), Figure 1C. Although many alternative forms of activated oxygen had been proposed for this class of enzymes, each has been eliminated in turn (19–23). Importantly, the consistent demonstration that the consumption of O2 and hydroxylation of substrate remain tightly coupled, even when substrate and enzyme variants of significantly reduced reactivity are examined, rules out any accumulation of a dissociable CuM(II)-reduced oxygen intermediate prior to substrate activation (22,23). The mechanism proposed by Evans et al. (22), and corroborated by DFT calculations (24), in which a tightly-controlled CuM(II)-superoxo intermediate reacts with substrate, fulfills the voluminous mechanistic data collected for this family of enzymes (22). Model studies of copper-based catalysis also support a role for Cu(II)-superoxo in aliphatic C–H activation (25, 26).
Long-range ET from CuH to CuM is proposed to take place after an irreversible C–H abstraction that places the rate constant for ET within the unimolecular rate constant, kcat (27). The timing and pathway of long-range ET from CuH to CuM is one of the most debated features of the TβM/DβM/PHM function, with described mechanisms placing this step either before (22) or after (24) the formation of product alcohol/alkoxide. The electron transferred from CuH has, alternatively, been proposed to traverse through substrate and/or a protein network (27, 28). However, the mutation of Q170 in PAM to an alanine, which was generated to disrupt the proposed interdomain, hydrogen-bonded protein network facilitating long-range ET from CuH, resulted in only minor effects on enzyme activity (28). Similarly, first- and second-order kinetic rate constants measured for the PHM-catalyzed reaction using two substrates differing significantly in length are very similar (27), eliminating the substrate backbone as a vehicle for the ET pathway from CuH to CuM. The collective data are consistent with a mechanism in which long-range ET occurs through water within the solvent-exposed interface between the copper domains. Herein, the consequences of mutating a conserved solvent cleft residue, Y216 in TβM, analogous to Y79 in PHM, are presented. Y216 of TβM was targeted because of an apparent pi-stacking interaction with a coordinating histidine ligand to CuH (H172 in PHM, Figure 1), which control the efficiency of ET from CuH to CuM. As we report, mutation of Y216 to alanine in TβM, the most extreme mutant examined, results in an enzyme form that appears significantly impacted with regard to the rate of long-range ET. This feature, together with the increase in the rates for substrate release and CuM ligand oxidation with Y216A points toward a central role for Y216 in optimizing catalysis within a water-filled active site.
Materials and Methods
Materials
Drosophila Schneider 2 (S2) cells, Insect-XPRESS growth media, Drosophila Expression System and blasticidin S-HCl were purchased from Invitrogen. HPLC-purified primers were ordered from Operon. Anion-exchange and size-exclusion chromatography media were from Sigma-Aldrich and GE Healthcare, respectively. Talon affinity resin was purchased from BD Biosciences. Assay reagents were obtained from Sigma-Aldrich (St. Louis, MO) or Fisher Scientific (Pittsburgh, PA), except for catalase, which was purchased from Roche. Acetonitrile and methanol (Fisher Optima grade, 99.9 %) and formic acid (Pierce, 1 mL ampules, 99+ %), purchased from Fisher Scientific and water purified to a resistivity of 18.2 MΩ·cm (at 25 °C) using a Milli-Q Gradient ultrapure water purification system (Millipore, Billerica, MA), were used to prepare mobile phase solvents for HPLC and liquid chromatography-mass spectrometry.
Protein Expression & Purification
The polyhistidine-tagged (His-tagged) wild-type (WT) and TβM mutants were expressed in S2 cells as described previously (4). Tyr216 mutations were generated by PCR using the pBipTBM plasmid and primers encoding 10–17 bases upstream and downstream of the mutation. The forward primers are shown below, with the mutated codon in bold. The reverse primers were complementary:
Y216A: G GAG ACC ACG GCC TGG TGT CAC G
Y216I: CC AGT CAG GAG ACC ACG ATC TGG TGT CAC GTT CAG C
Y216W: C AGT CAG GAG ACC ACG TGG TGG TGT CAC GTT CAG C
The resulting altered pBipTBM plasmid was transformed into Escherichia coli strain XL1 Blue (Stratagene) cells and purified using a Qiagen Highspeed Miniprep kit. The sequence of the purified plasmid was confirmed by automated DNA sequencing (Sequencing Facility, University of California, Berkeley). Cell stocks for each mutant were then expanded and DNA purified using an endotoxin-free Qiagen Highspeed Midiprep or Maxiprep Kit prior to transfection into S2 cells. Protein secreted by S2 cells was purified using anion exchange (DEAE), His-tag affinity (TALON), and size exclusion chromatography (GE) as described previously for WT TβM. High purity fractions (single-banded, as determined using SDS-PAGE) were pooled, and protein concentrations were determined by UV absorbance at 280 nm. TβM molecular weights and extinctions coefficients were determined using ExPASy (http://www.expasy.org), on the assumption that all cysteines are cystines and neglecting any post-translational glycosylation. The calculated values for WT TβM containing the polyhistidine tag are as follows: MW=69 718 Da, A280mg/mL=1.423, ε280=99 210 M−1 cm−1, as previously reported (30). The calculated mass, A280mg/mL, and ε280 for each Y216 variants are summarized in Table S1. Concentrations were determined by Bradford assays and were within 5% of values derived from the absorbance at 280 nm.
Enzyme Kinetic Assays Using Oxygen Electrode
Steady-state rates of oxygen consumption by Y216 TβM variants were measured on a Yellow Springs Instrument model 5300 biological oxygen electrode, and rate constants were calculated as previously described as a function of tyramine, ascorbate, and O2 (30). Assay solutions in which tyramine was varied contained H-tyramine (25 μM–10 mM) or D-tyramine (50 μM – 20 mM), 10 mM ascorbate, 50 mM KPi, 100 mM KCl, 100 μg/mL catalase, 2 μM CuSO4, and enzyme, pH 6. Assay mixtures in which ascorbate was varied included a constant concentration of tyramine (50 μM, 250 μM, 500 μM, or 1.25 mM), ascorbate (2 mM – 100 mM), 50 mM KPi, 100 M KCl, 100 μg/mL catalase, 2 μM CuSO4, and enzyme, pH 6. Experiments in which O2 was varied were identical to the assay conditions described above for varying H- or D-tyramine and were carried out with a range of O2 concentrations (~ 55–1070 μM). For each experiment, the assay solution was stirred at 35 °C for a period of ~ 5 min to equilibrate the solution at the desired O2 concentration. After equilibration, CuSO4 was added and the background rate of reaction was recorded for at least 1 min. Enzyme was always added last to the assay mixture and the rate of O2 consumption as a function of Y216 TβM variant was measured. The background rate (due to reaction of CuSO4, ascorbate, and O2) was subtracted from the overall rate of O2 consumption. Initial velocities of O2 consumption were fit to the Michaelis-Menten equation by fitting kcat(app) and kcat(app)/Km,Tyr, using the program Kaleidagraph. In cases where substrate inhibition is observed, the data were fit to the form of the Michaelis-Menten equation that includes a term for the inhibition constant, Ki (Eq. 2):
| (2) |
The final kcat and kcat/Km,Tyr values of Y216X TβM variants under conditions of saturating O2 were obtained by first fitting for kcat(app) and kcat(app)/Km,Tyr using the Michaelis-Menten equation, Eq (2), at constant [O2]. The subsequent fitting of these data sets to variable [O2] used an error-weighted algorithm with one exception. In the case of kcat(app) vs. [O2] for Y216I with H-tyramine as substrate, visual comparison of weighted vs. unweighted indicated a superior fit in the latter case (Figure S1 in Supporting Information). Kinetic data for WT TβM (30) were also refitted using the procedure outlined above. Since the concentration of ascorbate does not affect kcat/Km,Tyr, as a result of the ping-pong mechanism, kcat(app)/Km,Tyr data available at 10 mM and 50 mM ascorbate for WT were combined to obtain the final kcat/Km,Tyr. KIEs on kcat and kcat/Km,Tyr values were calculated from ratios of the kcat and kcat/Km,Tyr values for H- and D-tyramine.
Time-Dependent Product Analysis by HPLC
HPLC separations were performed on an Alltech Adsorbosphere reversed phase C-18 column (Grace Discovery Sciences) (4.6 × 250 mm) attached to a Beckman-Coulter system Gold HPLC equipped with a system Gold autosampler. Octopamine and tyramine were monitored at 224 and 274 nm, respectively. Separation of tyramine and octopamine from other assay components was achieved using a mobile phase of 5 mM acetic acid (pH 5.8), 600 μM heptane sulfonic acid, and 15% methanol at a flow rate of 1.1 ml/min; under these conditions octopamine eluted at a retention time of 10.5 min, and tyramine at 35 min. Assay solutions containing tyramine (250 μM – 10 mM), 50 mM ascorbate, 50 mM KPi, 100 mM KCl, 100 μg/mL catalase, and enzyme, pH 6, were mixed for periods of 2 min to 8 h. CuSO4 (2–20 μM) was maintained in all assay mixtures at a ratio of either 2:1 or 4:1 Cu:TβM (to examine the impact of excess Cu on product formation). Enzyme was added as the final component of the assay mixtures to initiate the reactions. For experiments monitoring product formation as a function of time, 115 μL aliquots were removed from the reaction mixtures at specific time points during the course of the reaction and added to 1.5 μL of 70 % HClO4. The quenched aliquots were spun at 14,000 rpm (22 min) to remove precipitated protein prior to HPLC analysis. Assay samples that were not analyzed by HPLC on the same day as prepared, were frozen in liquid nitrogen and stored at −80 °C until subsequent analysis.
Standard Curves
Product standard curves were generated as previously described using solutions that contained varying amounts of octopamine (50 μM–2 mM) and are in good agreement with published results (Figure S2 in Supporting Information) (29). The fit of the octopamine standard curve generated from the integrated peak area (224 nm) was used to quantify the amount of product generated in assay mixtures. Tyramine standard curves were not generated due to the broadness of tyramine peaks observed under the reaction conditions described herein; the characteristics of the tyramine elution spectra were similar to those observed previously (29). However, the disappearance of tyramine was monitored (274 nm) and used qualitatively to confirm substrate turnover by Y216 TβM variants. The validity of the octopamine standard curve was confirmed by analyzing a sample of known octopamine concentration each time when samples were analyzed by HPLC.
Control Assays
Control reactions that contained all reagents except enzyme and varying amounts of CuSO4 (2 to 20 μM) were stirred for periods of up to 12 h and analyzed by HPLC to determine the background amount of tyramine oxidation in the absence of enzyme. A small peak with the same retention time as octopamine occasionally was observed, suggesting that a minor amount of octopamine was generated under these conditions. The maximum amount of octopamine generated in control assays was 10 μM in solutions containing 20 mM CuSO4.
Enzyme Inactivation in the Absence of Tyramine
For each assay, ~ 2.0 μM of each Y216 TβM variant was mixed with 50 mM ascorbate, 100 mM KPi pH 6.0, 100 mM KCl, 100 μg/mL catalase, and 10 μM CuSO4 and incubated for 0–4 h at room temperature. After a specific period of time, 1 mM tyramine was added and the reaction was allowed to proceed for up to 6 h to assay for remaining activity. 110 μL aliquots were removed at specific time points after addition of tyramine (2 min–6 h), quenched with 1.5 μl of 70% HClO4, and spun at 14,000 rpm (22 min) to remove precipitated protein before injection onto the HPLC column. Samples that were not analyzed on the same day the assays were completed were stored at −80 °C until subsequent analysis by HPLC. The rate of loss of activity of the Y216 TβM mutants, prior to the addition of tyramine, was determined by plotting the ln kobs vs. the pre-incubation time of each variant.
Inductively-Coupled Plasma Optical Emission Spectroscopy (ICP-OES) and Circular Dichroism (CD)
The amount of copper bound to predominately apo-samples of each Y216 mutant and WT TβM purified as described previously (4) and above was determined using a Perkin Elmer 5300 DV optical emission ICP equipped with an auto sampler. 5 mL sample of each Y216 variant and WT TβM (~ 0.8–2 μM) in 100 mM KPi, pH 7.3 was used to determine the amount of copper bound in ppb by integrating the 327 nm signal of copper and fitting this value to a standard curve. CD measurements were carried out with an Aviv 410 spectropolarimeter interfaced with a Peltier temperature-controlled cell holder. For all samples, spectra were collected scanning 190–300 nm and each individual CD measurement is an average of the signal at 222 nm over 1 min in a 0.5 cm path length cuvette. The CD spectrum (190 – 300 nm) for each Y216 variant and WT TβM (~ 1 to 2 μM) was collected before and after the addition of an ~ 5-fold excess of CuSO4 in order to examine how the secondary structure changes as a function of mutation and copper binding.
Preparation of TβM Samples for EPR, EXAFS, and XANES
For the purposes of these studies, samples of the Y216 TβM variants lacking the His-tag were used to ensure accurate determination of the active site Cu-binding stoichiometries. Details for the removal of the His-tag and for the expression and purification of TβM lacking the His-tag are identical to that reported previously (14). The details for copper reconstitution for oxidized and reduced Y216 TβM variant samples are also identical to previously published protocols (29).
EPR Studies
EPR spectra were collected using a Varian E9 spectrometer; T = 15 K, field center = 3100 Gauss, scan range = ±1000 Gauss, microwave power = 2 mW, modulation amplitude = 20 Gauss, time constant = 0.25 s. Copper concentrations of all enzyme samples were determined by double integration of the resultant EPR spectra using the program, EView (E. Bill, Max Planck Institute for Bioinorganic Chemistry) and comparison to the double integration values obtained for the EPR spectra of Cu standards. Cu standards contained 50 μM – 200 μM CuSO4, 20 mM EDTA, pH 8. Several standards in the appropriate concentration range, as well as a cavity spectrum, were measured on each day of EPR experiments.
Collection and Analysis of XAS Data
Cu K-edge (8.9 keV) extended X-ray absorption fine structure (EXAFS) and X-ray absorption near edge structure (XANES) data were collected at the Stanford Synchrotron Radiation Lightsource operating at 3 GeV and 300 mA under continuous top-up mode on beam line (BL) 7-3 using a Si[220] monochromator and a Rh-coated mirror upstream of the monochromator with a 13 keV energy cutoff to reject harmonics. Data were collected in fluorescence mode using a high-count rate Canberra 30-element GE array detector with maximum count rates below 120 kHz. A Z-1 Ni oxide filter and Soller slit assembly were placed in front of the detector to reduce the elastic scatter peak. Energy calibration was achieved by reference to the first inflection point of a copper foil (8980.3 eV) placed between the second and third ionization chamber.
The samples (80 μL) were measured as aqueous glasses (> 20% ethylene glycol) at 10–15 K. Six scans of a sample containing only sample buffer were collected, averaged and subtracted from the averaged data for the protein samples to remove Z-1 Kβ fluorescence and produce a flat pre-edge baseline. Data reduction and background subtraction were performed using the program modules of EXAFSPAK (31). Data from each detector channel were inspected for glitches, drop-outs, or other non-linear behavior before inclusion in the final average.
Spectral simulation was carried out using the program EXCURVE 9.2 (33–35) as previously described (36). EXAFS data were simulated using a mixed-shell model consisting of imidazole and S(Met) coordination. First-shell distances (R) and Debye Waller factors (DW, 2σ2) for the Cu-N(imidazole) and the Cu-S(Met) shell, and the threshold energy E0 were initially refined. In these preliminary refinements, the imidazole ring outer shell C and N atoms were constrained to move relative to the first shell Cu-N distance so as to maintain the idealized ring geometry, and all single and multiple scattering pathways were included in the calculations as previously described (36). Later in the refinement, this constraint was lifted, and the outer shells of the imidazole rings were allowed to float within 10 percent of their original idealized positions. In practice, the final outer shell coordinates for acceptable fits deviated by less than the permitted amount from the idealized position. The parameters refined in the fit included shell occupancy N, Cu-scatterer distance R, and Debye-Waller factor (2σ2) for each shell, and the threshold energy for photoelectron ionization (E0), which was constrained to be the same for all shell of scatterers.
Inactivation Incubations and Limited Trypsin Digestion of Y216 TβM Variants
For each assay, ~ 15 μM of each Y216 TβM variant was combined with ascorbate (1 or 50 mM), 100 mM KPi pH 6.0, 100 mM KCl, 100 μg/mL catalase, 45 μM CuSO4, and 0.5–1 mM tyramine for 0–4 h at room temperature. At specific time points, the assay mixture was quenched with 10 M urea and immediately concentrated using Amicon ultra 0.5 mL concentrators (YM30, Millipore). This process of denaturing and washing was repeated three times to remove any small molecular reagents (i.e. KCl, CuSO4, ascorbate). The enzyme was subsequently reconstituted in 100 mM, Tris, pH 8.5 and concentrated to a volume of ~ 20 μL. 15 μM enzyme was first denatured in 8 M urea and 100 mM Tris, pH 8.5, followed by reduction of disulfide bond of cystine residues with 5 mM tris(2-carboxyethyl)phosphine hydrochloride (TCEP) for 20 min at room temperature and then capping of thiol of cysteine with 10 mM iodoacetic acid (IAA) for 45 min at room temperature. The samples were subsequently diluted four-fold with 100 mM Tris, pH 8.5 (final urea concentration = 2 M), and 1 mM CaCl2 was added to the mixture. 1 μL of tosyl phenylalanyl chloromethyl ketone (TPCK) treated trypsin (0.5 μg/μL) was added, and the reaction was incubated overnight in the dark at 37 °C. 1 μL of neat formic acid was added before mass spectrometric analysis. Control limited trypsin digestions were run under the conditions above using the Y216W/I/A variants of TβM without inactivation incubation.
Liquid Chromatography-Mass Spectrometry (LC-MS)
Tryptic digested samples were analyzed using an ultraperformance liquid chromatograph (nanoAcquity UPLC, Waters, Milford, MA) connected in-line with an orthogonal acceleration quadrupole time-of-flight mass spectrometer (Q-Tof Premier, Waters), and by an Agilent 1200 liquid chromatograph (Santa Clara, CA) connected in-line with an LTQ Orbitrap XL hybrid mass spectrometer (Thermo Fisher Scientific, Waltham, MA). Both mass spectrometers were equipped with electrospray ionization (ESI) sources. The methods used here are similar to those previously reported (37).
Results and Discussion
Decades of research on the small family of mononuclear dicopper monooxygenase have led to a consensus mechanism up through the first irreversible, C–H bond cleavage step, Figure 1C (2,18–24). However, many functional features have not been delineated, including the structural motifs that facilitate the precise timing and energetics of long-range ET from CuH to CuM. A number of pathways for ET have been proposed and, when tested, have not been supported by the experimental evidence (6, 27, 28). One posited ET pathway that is consistent with steady-state kinetics (18, 30, 38), but not yet demonstrated experimentally, involves a direct line transfer across the water interface from CuH to a CuM(II)-hydroperoxo intermediate (Figure 1C) or a CuM(II)-oxo intermediate (24). Of potential importance, a universally conserved tyrosine residue (Y216 in TβM and Y79 in PHM), which appears to pi-stack with a coordinating histidine (H317 in TβM and H172 in PHM) to CuH (Figure 1), is positioned in the solvent cleft between the two copper domains. This residue was targeted in the present study, undergoing mutation to tryptophan, isoleucine, and alanine in TβM.
Physical Characterization of the TβM Variants
During the purification procedure, each Y216 TβM variant was extensively washed with ethylenediamine tetraacetic acid (EDTA) while bound to the anion exchange resin. The purpose of this step is to chelate free copper, resulting in enzymes that are predominately in their apo-form, thereby minimizing copper-dependent reactions that could be damaging to protein. The final copper occupancy for WT TβM, determined by ICP-OES, was ~ 0.2 Cu/domain, with similar values for each of the Y216W/I/A variants (Table S1 in Supporting Information). The fairly low levels of copper and the consistent treatment of each variant and WT proteins indicate that baseline levels of ROS, formed as a result of the purification procedures, are likely to be low and not significantly different among the variants versus WT enzyme. Snap-freezing of protein aliquots and storage at −80 °C were used to minimize any further copper-dependent reactions.
The impact of mutating Y216 of TβM to W/I/A on the overall secondary structure of TβM was examined by CD spectroscopy and compared to WT TβM. The as-purified (predominately apo-protein) and copper-reconstituted enzyme forms were measured. In all cases, there were no discernible mutational or copper-dependent differences in overall secondary structures (data not shown).
EPR spectroscopy was used to examine oxidized [Cu(II)] enzyme samples of Y216W/I/A that had been reconstituted with copper sulfate at a ratio of 2:1. The spectra were characteristic of a Type II active site and were nearly identical to the spectra of WT TβM and the M471 TβM mutants (Figure S3 in Supporting Information) (29). Based on the similarity among spectra, it can be concluded that mutation of Y216 does not have an observable effect on the geometry at CuM or CuH in the oxidized state. The concentration of oxidized coppers bound to each Y216 variant was determined by double integration of each EPR spectrum and comparison to a Cu(II)-EDTA standard curve (Table S1 in Supporting Information). The ratio of copper occupancy to protein for Y216W and Y216I (1.7:1 and 1.9:1, respectively) were nearly identical to that measured for WT TβM (29). The Cu/enzyme ratio for Y216A TβM was determined to be 2.3:1. This value is slightly above the expected 2:1 ratio. The Y216A variant also showed a slightly greater amount of residual copper after treatment of enzyme with EDTA prior to reconstitution, suggesting either small differences in Cu(II) affinity (29) or possibly a low level of non-specific copper binding. Reduction of the Y216 variant samples with ascorbate completely diminishes the EPR signal as previously observed for the WT and M471 variants (29) (data not shown). The loss of signal is consistent with complete reduction of the mutants by ascorbate. To test whether this reduction of the copper domains impacts the coordination environment, the reduced samples were exposed to air and the EPR spectra re-examined. The Cu(II) signals were nearly identical to initial spectra for the oxidized form of the mutants, as reported previously for WT and M471 variants (29).
The coordination environment of Y216A and Y216W TβM was examined by XAS to determine whether the observed steady-state kinetic and inactivation parameters (see below) could be explained by changes to the coordinating ligands as a function of mutation. XAS data were collected for oxidized and reduced forms of Y216A and Y216W, and compared with data for the WT protein reported previously (14). Experimental and simulated Fourier transforms and EX-AFS spectra for each variant are shown in Figures S4 and S5 of the Supporting Information, with the best-fit parameters listed in Table S2 of the Supporting Information. Inspection of the data indicates that the variant spectra are very similar to WT. In particular, oxidized data are identical within experimental error, consistent with the EPR results discussed above. For the reduced data, the overall coordination at each copper center likewise remains unchanged. However, a small decrease of 0.03 Å in the bond length associated with the Cu-S(Met) ligand at CuM is observed for each variant suggesting subtle changes in coordination at CuM. These subtle changes are also echoed in the XANES data (Figure S6 in Supporting Information) where the mutants show minor changes in edge absorption from the WT.
Extent of Catalytic Turnover with Y216W/I/A
The time-dependent formation of octopamine catalyzed by Y216W/I/A TβM was examined by HPLC methods in which the substrate and product are separated, and the peak corresponding to octopamine formation integrated and fit to a standard curve (Figure S2 in Supporting Information). In reaction mixtures containing Y216W TβM, tyramine is completely converted to octopamine within 120 min under the assay conditions described herein (Figure S7 in Supporting Information, Table 1).
Table 1.
Extent of Octopamine Formation with Y216W/I/A at Ambient Oxygen, Fixed Tyraminea and Variable Enzyme Concentrations
| [Y216W] (μM) | [oct]fb (μM) | [oct]f/[Y216W] | [oct]f/[Tyr]o | kobs(s−1) |
|---|---|---|---|---|
| 1.03 | 523 | 508 | 1.05 | 0.19 |
| 2.05 | 505 | 246 | 1.01 | 0.16 |
| 3.08 | 490 | 159 | 0.98 | 0.18 |
|
| ||||
| [Y216I] (μM) | [oct]fb (μM) | [oct]f/[Y216I] | [oct]f/[Tyr]o | kobs(s−1) |
|
| ||||
| 1.00 | 516 | 516 | 1.03 | 0.21 |
| 2.01 | 511 | 254 | 1.02 | 0.16 |
| 3.01 | 510 | 169 | 1.02 | 0.14 |
|
| ||||
| [Y216A] (μM) | [oct]fb (μM) | [oct]f/[Y216A] | [oct]f/[Tyr]o | kobs(s−1) |
|
| ||||
| 1.04 | 83 | 80 | 0.17 | 0.016 |
| 2.02 | 203 | 100 | 0.41 | 0.016 |
| 3.03 | 286 | 94 | 0.57 | 0.014 |
| 3.88 | 297 | 77 | 0.59 | 0.015 |
These data are at 500 μM tyramine.
[Oct]f is the final level of product formed.
The slope of the linear portion of the product versus time curves for Y216W resulted in an average kobs = 0.18 s−1, which is ~ 26-fold lower than that determined for WT TβM under identical conditions (29). This observation was not unexpected. The impact of an equivalent mutant in PHM (28) is more pronounced than what is observed for Y216W TβM, with a reported reduction rate on ca. ~ 200-fold for Y79W PHM compared to WT PHM. Some of this difference may be due to variability in the PHM expressed in mammalian cell lines (5). We note that Y79F PHM has also been generated and characterized (3), and the impact of mutating Y79 to a phenylalanine on turnover number for PHM (3) is nearly identical to the effect of changing Y216 in TβM to tryptophan (Table 1). The data reported herein show that Y216W is capable of fully converting tyramine to octopamine, indicating little or no loss of enzyme activity during turnover. Somewhat unexpectedly, removal of the aromatic ring at position 216 (Y216I) yielded kinetic parameters nearly identical to Y216W TβM, as well as full conversion of tyramine to octopamine (Figure S8 in Supporting Information, Table 1). From the kinetic properties of Y216W and Y216I TβM and the requirement of ET from CuH to CuM during each enzymatic turnover, it can be concluded that aromaticity/unsaturation at position 216 is not a pre-requisite for catalytic turnover.
Octopamine formation was also observed in the assay of product formation catalyzed by Y216A TβM. During all assays, the reaction was essentially complete after 4 h, and the average kobs was determined to be 0.015 s−1. However, even at nearly 4 μM Y216A TβM, full conversion of tyramine to octopamine does not occur (Figure S9 in Supporting Information, Table 1). In fact, the amount of octopamine formed per unit of enzyme is very similar to that observed previously for reactions in which a mutation was created at CuM, M471C TβM (29). In the latter case, the time dependence of octopamine formation was analyzed to yield kobs and kinact, both of which were found to be independent of enzyme concentration. This initially led to a model in which an ES complex was proposed to partition between product formation and enzyme inactivation (29), whereas, a more recent extended study of the properties of M471C TβM inactivation (37) shows that enzyme loss occurs predominantly with free enzyme according to Eq (3),
 |
(3) |
predicting that Y216A will likewise undergo inactivation in the absence of substrate.
Susceptibility of Y216W/I/A to Inactivation in the Absence of Tyramine
In the context of the increased susceptibility of M471C TβM to inactivation in the absence of tyramine (37), incubations of the Y216 variants were carried out in the presence of all reaction components except tyramine. The activity remaining as a function of time of incubation could be fit to a single exponential rate constant, Table 2. As already reported (37), WT TβM is fairly stable to solution oxidants, with a kinact of 0.79 × 10⁻⁴ s−1 in relation to a kobs (500 μM tyramine) of 4.5 s−1 under the same conditions of buffer components (29, 37). With regard to the Y216 variants, Y216I was impacted the least when incubated with assay components that could form a variety of ROS yielding a kinact = 8.3 × 10⁻⁵ s−1 (Table 2, Figure S10 in Supporting Information). The kinact for both Y216W and Y216A TβM was determined to be 1.8 × 10⁻⁴ s−1 and 1.7 × 10⁻⁴ s−1, respectively (Table 2, Figure S10 in Supporting Information). Although the nearly identical values for Y216W and Y216A was initially unexpected in the context of reduced conversion of substrate to product for Y216A (Table 1), a key component that will control the ability of enzyme to give full turnover is the relative rates of kobs to kinact (Table 2). As summarized, these vary from 1 – 2 × 10³ for Y216W/I to only 90 for Y216A.
Table 2.
Comparison of kinact and kobs for Y216 Variants.
The cause of the inactivation of the Y216 TβM variants was further examined by limited proteolysis by TPCK treated trypsin and LC-MS/MS analysis of the resulting peptides to determine whether specific sites on the enzyme are vulnerable to oxidation. WT TβM and the Y216 variants were incubated with the full complement of assay components, with the exception of tyramine, as a function of time before proteolysis and LC-MS/MS analysis. The mass spectral intensities of non-oxidized and oxidized forms of the peptides containing active site residues were used to determine the extents of oxidation at specific sites.
Our primary focus is on peptides that contain ligands to CuM, M471 (Figure S11 in Supporting Information), H396, and H398 (Figure S12 in Supporting Information and Figures 2A and 2B), and a peptide containing H317, which binds CuH (not shown). The peptide containing the other two ligands to CuH, H247 and H248, could not be isolated. Residues located near or bound to CuH were expected to be the most vulnerable to oxidative damage based on the fact that Y216 appears to pi-stack with H317 (corresponding to Y79 and H172 in PHM). However, the ratio of oxidized to non-oxidized peptide containing H317 remains virtually unchanged over a period of 4 h for all of the Y216 mutants and WT TβM (Table 3). While it is impossible to rule out the possibility of oxidation at H247 and H248, disruption of the native interaction between Y216 and H317 in TβM has only a modest impact on the vulnerability of H317 to oxidative damage. One possible explanation for this observation is that breaking the pi-stacking interaction increases the strength of the bond between H317 (H172 in PHM) and CuH, thereby protecting this residue from oxidation by ROS. One might expect that M471 (M314 in PHM at CuM) would also be a probable ligand to undergo oxidation, due to the intrinsic susceptibility of methionine to oxidation and the presence of this residue within the coordination sphere of CuM in the reduced state (3,11–14). However, M471 also is not significantly oxidized as a function of time (Table 3), consistent with the greater stability of WT TβM containing methionine at this position.
Figure 2.

Tandem mass spectra resulting from collisionally activated dissociation of the triply charged positive ions that is due to the [M + 3H]3+ ion of the tryptic peptide, AALPATGII-IFGSQLHTHLR, corresponding to residues 381–400 of Y216A TβM. (A) m/z = 711.4, containing one oxidation (i.e., a mass addition of 16 Da), and (B) m/z = 716.7, containing two oxidations (i.e., a mass addition of 32 Da). Ions have been transformed onto a singly charged x-axis (i.e., z = 1) to simplify spectral interpretation. Internal cleavage ions are labeled with their amino acid sequences. Ions that are due to neutral losses of molecules of water or ammonia are denoted by asterisks. Fragment ions y3 through y18 exhibit the 16-Da mass addition in (A), and 32-Da mass addition in (B). The oxidation sites, H398, are underlined in each of the above sequence maps. These spectra correspond to the time point at 4 h.
Table 3.
Fraction Oxidized Residues.a
| Protein | ||||
|---|---|---|---|---|
|
| ||||
| WT | Y216W | Y216I | Y216A | |
| CuH | ||||
| His317 b | ||||
| 1 h | 0.20 | 0.19 | 0.27 | 0.24 |
| 4 h | 0.17 | 0.18 | 0.34 | 0.36 |
|
| ||||
| CuM | ||||
| Met471b | ||||
| 1 h | 0.20 | 0.22 | 0.37 | 0.30 |
| 4 h | 0.25 | 0.28 | 0.24 | |
|
| ||||
| His396, 398 c | ||||
| 1 h | 0.11 | 0.10 | 0.38 | 0.25 |
| 4 h | 0.25 | 0.30 | 0.50 | 0.56 |
In presence of 50 mM ascorbate. This is a representative table comparing the fractions of oxidized to non-oxidized residues in tryptic peptides of TβM that contain active site ligands.
Two peptides compared, unmodified vs. oxidized.
Three peptides compared, unmodified (Figure S12) vs. monooxidized (Figure 2A) and doubly oxidized (Figure 2B).
On the other hand, the peptide consisting of TβM residues 381–400 is consistently observed to be oxidized to a greater extent than any other peptides containing active site ligands for Y216A (Table 3). This peptide contains two residues that are ligands to CuM, namely H396 and H398. The MS/MS spectra for this peptide indicate that H398 is the specific site for the addition of one (Figure 2A) and two oxygen atoms (Figure 2B). Whereas the doubly oxidized peptide (432 Da., Figure 2B) could have resulted from oxidation of both H396 and H398, the fragments y3 and y4 containing H398 alone indicate this position as the more reactive. In contrast, other histidine-containing peptides (e.g., TβM residues 31–42 and 52–67) located in different regions of the enzyme were typically detected solely in non-oxidized form. Thus, among the three positions interrogated (H317, M471, and H398), only the stability of the latter appears to be significantly altered in Y216I/A. This observation indicates that changes to Y216 are propagated throughout the protein/interdomain solvent, resulting in an increased oxidation at H398. The XAS data indicate an unaltered interaction of H398 to CuM, and a weakened interaction between this side chain and CuM is an unlikely cause of the inactivation. Instead, we conclude that the reduction in bulk at position 216 results in increased access of ROS to H398. The comparison between the oxidation of active-site residues (Table 3) to the kinact (Table 2) demonstrates a general trend for the Y216 variants. The fact that the Y216W variant undergoes a much greater rate of inactivation compared to WT TβM with a similar extent of oxidation observed at H398 indicates that additional factors contribute to the kinact.
Steady-State Kinetic Parameters
The impact of replacing Y216 with W/I/A on the steady-state kinetic mechanism was investigated in greater detail by monitoring the rate of O2 uptake under a range of conditions. Given the lower turnover rates for these variants in relation to WT enzyme, background rates of O2 uptake needed to be minimized. While the WT-enzyme could be analyzed at elevated ascorbate using an O2 electrode (30), 10 mM ascorbate was found to be the upper limit for the collection of reliable data with the slower Y216 variants. The trend in the apparent kcat for WT TβM at saturating tyramine, and O2 as a function of ascorbate, indicated only a ca. 2-fold increase in going from 10 mM to 50 mM ascorbate, with the latter being close to saturation with regard to reductant. We, therefore, proceeded to collect all data for the Y216 variants at 10 mM ascorbate, and to compare the resulting parameters to WT TβM under the same conditions.
First, the tyramine concentration was varied at ambient O2 (222 μM), to look for trends in the limiting parameters (highlighted in Tables S3–S5). The kcat(app) is similar for the three variants, while the Ki,Tyr and Km,Tyr are clearly elevated for Y216A; the latter also results in a reduced kcat(app)/Km,Tyr for Y216A. These facts point toward a likely impact on the on/off rates for the interaction of the substrate, tyramine, with Y216A. The same type of experiment at ambient O2 was then repeated at variable O2 concentrations from ca. 50 μM to over 1 mM (Tables S3–S5). Within the noise, there appears to be little trend in either Km,Tyr or Ki,Tyr as a function of O2 for Y216W/I. The former behavior is similar to that for WT TβM, while Ki,Tyr was seen to decrease for WT enzyme – attributed to an inhibitory binding mode that is dependent on the redox state at the copper centers. In the case of Y216A, a similar trend in Ki,Tyr may be discernible. The increase in kcat(app) with increasing O2 is also as expected, with Km,O2 values falling roughly between kcat(app) with increasing O2 is also as expected, with Km,O2 values falling roughly between 100 and 200 μM (cf. Figure 3). It is notable that while the elevated Km,Tyr at ambient O2 does decrease as the O2 is elevated, it remains greater than Km,Tyr for either Y216W/I or WT TβM in the limit of saturating O2.
Figure 3.

Replot of apparent first-order and second-order rate constants vs. [O2] for reactions of Y216X TβM with H-tyramine (○ solid line) and D-tyramine (□ dashed line) at 10 mM ascorbate. (A) kcat(app) of Y216W TβM; (B) kcat(app)/Km,Tyr of Y216W TβM; (C) kcat(app) of Y216I TβM; (D) kcat(app)/Km,Tyr of Y216I TβM; (E) kcat(app) of Y216A TβM; (F) kcat(app)/Km,Tyr of Y216A TβM. Data was fitted as described in Materials and Methods.
To further probe the impact of mutation at position 216, kinetic experiments were repeated using D-tyramine to measure the deuterium kinetic isotope effects (KIEs) (Tables S6–S8 in Supporting Information). The limiting rate constants for D-tyramine at variable O2 are plotted on Figure 3 for comparison to the H-tyramine. The impact of substrate deuteration on Km,O2 is not large and, particularly in the case of Y216A, looks almost identical to WT TβM (30).
The kinetic mechanism for WT TβM is random order, Scheme 1, and it is reasonable to assume that the variants behave in a similar manner; this is supported by the observed changes in D(kcat/Km,Tyr(app)) as a function of O2 for Y216I (cf. Table S7 of the Supporting Information, where D(kcat/Km,Tyr) decreases as a function of O2 and extrapolates to a value greater than unity, Table 4.). Analysis of the data from turnover of H- and D-tyramine as a function of [O2] yielded limiting values for Dkcat, D(kcat/Km,Tyr), as well as estimated unimolecular rate constant for a number of the individual rate constants in the mechanism (Table 4). The most remarkable feature to emerge from this analysis is the elevated value for the D(kcat(app)/Km,Tyr) in the case of Y216A, which is close to the value previously reported for the intrinsic isotope effect on the C–H bond cleavage step of 11–12 (18, 39).
Scheme 1.
Kinetic mechanism for random-ordered binding of substrate and O2. The rate constants k5 and k4′ refer to the C–H bond cleavage step and release of bound tyramine, respectively. The rate constant k7 is a lumped constant that contains the rate constant for enzyme reduction/recycling by ascorbate, the loss of product and long-range ET, kET. E represents enzyme that is reduced at Cu, whereas E′ is oxidized.
Table 4.
Fitted Values for kcat, Dkcat, kcat/Km,Tyr and D(kcat/Km,Tyr) for WT TβM and Y216 Variants at Infinite O2, Leading to the Calculated Values for k5, k4′, and kET.
| Parameter | WT TβM a | Y216W TβM | Y216I TβM | Y216A TβM |
|---|---|---|---|---|
| kcat (s−1) | 8.0 ± 0.6 | 0.36 ± 0.03 | 0.33 ± 0.03 | 0.42 ± 0.03 |
| Dkcat | 1.9 ± 0.3 | 1.5 ± 0.2 | 1.2 ± 0.1 | 1.8 ± 0.3 |
| kcat/Km,Tyr (mM−1s−1) | 76 ± 7 | 14 ± 5 | 5.9 ± 0.7 | 2.0 ± 0.5 |
| D(kcat/Km,Tyr) | 1.9 ± 0.4 | 1.3 ± 0.5 | 1.5 ± 0.2 | 12 ± 3. |
| k5 (s−1) b | 100 ± 40 | 8.7 ± 2.9 | 16 ± 8 | 5.6 ± 1.9 |
| k4′ (s−1) | 8.8 ± 5.2 | IDd | 0.75 ± 0.53 | 56 c |
| kET (s−1) | ID d,e | ID d,e | ID d,e | 0.45 ± 0.04 f |
These values are refitted using data from reference (30).
Calculated from Eq (4) in text for the condition of 10 mM ascorbate. At saturating ascorbate, all estimated rate constants k5, k4′, and kET are expected to be increased ca. 2-fold.
Since D(kcat/Km,Tyr) is approaching the intrinsic KIE of 12, the ratio of substrate off rate and C-H subtraction rate should be very large. Here we assume k4′/k5 ≈ 10. Hence, no error bars indicated.
ID means indeterminate.
As argued in the text, it is likely that kET ≫ k5 for WT, Y216W and Y216I.
Calculated from Eq (8) in text for Y216A.
We begin our analysis of the rate constants and KIEs using the available values for kcat and Dkcat to calculate k5 for C–H bond cleavage (23) (Table 4), Eq (4):
| (4) |
where Dk5 is assigned a value of 12, based on virtually identical intrinsic KIE measurements for DβM (37) and PHM (18) and the value for D(kcat/Km,Tyr) with Y216A-TβM (Table 4). It can be seen that for all Y216 variants examined, the impact on k5 is modest and varies 6.5- to 18-fold, in marked contrast to the enormous effect of mutation of the histidine ligand in contact with the analogous tyrosine side chain in PHM (H172A), where k5 is reduced ca. 104-fold (23).
The expression for the KIE on kcat/Km,Tyr in the limit of saturation with O2 is given in Eq (5),
| (5) |
and allows us similarly to obtain insight into the role of position 216 on the rate of substrate release from ternary complex, k4′ in Scheme 1.
In contrast to the D(kcat/Km,Tyr) for Y216A, the values for this parameter with WT and the other two Y216 variants are small and close to unity. In the case of Y216W, the error in D(kcat/Km,Tyr) exceeds its value, and no further effort was made to estimate k4′. The values of k4′ for WT and Y216I TβM, Table 4, indicate a ca. 10-fold decrease in the step, for the Y216I variant. In the case of Y216A, the D(kcat/Km,Tyr) approximates the intrinsic KIE (18, 37); this implies that k4′ must be large enough to reduce the contribution of k5/k4′ to a small value close to zero, and we estimate a value for k4′ ≈ 56 s−1, where k5/k4′ = 0.1. This analysis indicates that the introduction of isoleucine into position 216 impairs both the C–H bond cleavage step and the rate of substrate release to a similar extent, with a possible explanation for these observations offered below. Although a quantitative assessment of k4′ for Y216W was not possible, the fact that the trends in Dkcat and D(kcat/Km,Tyr) are similar to each other and to WT- and Y216I-TβM, suggests a reduction in k4′ that is analogous to Y216I. The impact of Y216A is quite different, and leads to a decreased kC–H while koff is increased, significantly differentiating its behavior from the larger side chain replacements. We conclude that Y216A results in a more facile pathway for substrate egress from the active site that is distinct from its impact on other catalytic steps.
One of the major goals of this study was to discern whether the Y216 that sits at the interface between CuH and CuM has any impact on the rate of ET between the metal sites. Previous analyses of DβM, PHM and TβM indicate that kcat can, in principle, be controlled by four irreversible steps: enzyme reduction by ascorbate, C–H bond cleavage (k5), long-range ET (kET) and product release (koff), Eq (6):
 |
(6) |
The rate of reduction of DβM has been directly measured as 250 s−1 at saturating ascorbate (17). Even if this parameter were to be reduced 100-fold for the mutant TβMs, which is much larger than their impact on either k5 or k4′, this step would still be 10-fold faster than the measured kcat values with all three Y216 variants. Thus, we consider a role for ascorbate reduction in controlling kcat unlikely for the TβM mutants. For WT DβM, there are strong data in support of product release as a major rate-determining step for kcat (38) which, together with C–H bond cleavage (k5), can fully account for the reported kcat and Dkcat values (39):
| (7) |
If we use the rate of substrate release as an estimate for product release in TβM, together with the k5 value in Table 4, we are able to explain the size of the Dkcat for WT TβM. The implication is that long-range ET is likely to be at least 10-fold faster than k5 (> 103 s−1) for WT TβM (cf. Eq (8) below).
In comparing Y216I to WT, we once again use the release of bound substrate to estimate the product release step. As for WT TβM, the reduction in k4′ relative to WT (ca. 10-fold) is of the same order of magnitude as the reduction in k5 and is capable of fully explaining the observed Dkcat, Eq (7). Note that if the rate of product release were slowed in relation to substrate release (as a result of the incorporation of a hydroxyl group into the beta position of substrate, Eq (1) and resulting complexation to CuM) (38), the kinetic commitment that is represented by k5/koff and approximated by k5/k4′ (cf. Eq. (7)) would only become larger, further reducing the need for a kinetically important electron transfer step to explain Dkcat. Another, perhaps more simple, approach to understanding the trends with the WT and Y216 variants of TβM is to examine the relative size of the KIEs on kcat vs. kcat/Km,Tyr for each enzyme form, which are seen to be largely unchanged for WT, Y216W and Y216I (Table 4). This is the origin of the conclusion that a similar step (product release for kcat and substrate release for kcat/Km) controls both parameters. Thus, as for WT TβM, we conclude that the kET is likely to be at least 10-fold larger than the observed k5 for Y216W/I.
The fact that the KIEs for WT and Y216W/I are similar to one another, in contrast to the ca. 20-fold reduction in kcat with these mutants, is of interest. In this laboratory, we are increasingly seeing similar behavior in enzyme systems with selected mutants (40), which we ascribe to a primary impact of such mutations on the fraction of catalytically functional enzyme rather than on individual rate constants. While this subject will be dealt with in greater detail in a subsequent publication (41), we suggest that an invariance of KIEs in combination with impaired catalysis may provide a means of identifying altered conformational landscapes in mutated proteins.
Importantly, the behavior for Y216A is quite different from the other 216 variants, as the value of its Dkcat resembles WT while the D(kcat/Km,Tyr) is much larger. This immediately suggests that another step must be contributing to kcat, with the only step unaccounted for being the long-range ET step between CuH and CuM. Using a modified expression for kcat in which there are three consecutive irreversible steps, k5, kET and koff ≃ k4′, we obtain Eq (8):
| (8) |
A useful expression for calculating kET directly from experimental observables (see Supporting Information) is, thus:
| (9) |
From Eq (9), the kET for Y216A is estimated as ca. 0.45 s−1 (Table 4). Since the primary experimental observation is that Dkcat < D(kcat/Km,Tyr), it is important to question whether another factor, other than kET, could be at work for Y216A. We have already discussed how a slowing of koff for product, relative to k4′, could reduce the magnitude of Dkcat, but such an effect was unlikely to influence the conclusions regarding Y216W/I where Dkcat and D(kcat/Km,Tyr) are within experimental error. If we assume that all of the reduction in Dkcat for Y216A comes from the k5/koff commitment (cf. Eq (7) above), we would need a value for koff of ca. 0.4 s−1 to be consistent with the experimental findings. This would require koff for product from Y216A to be ca. 20-fold smaller than WT, in marked contrast to k4′ that is 6-fold larger (Table 4), i.e. that there would be a 120-fold differential for the rate of release of substrate vs. product for Y216A, whereas no differential is seen with either WT-TβM or Y216W/I. We conclude that a large reduction in koff for Y216A is highly unlikely, reinforcing our conclusion regarding the magnitude of kET in this variant. We consider this a very significant result, given our previous inability to monitor directly the rate of ET from CuH to CuM in DβM, PHM or TβM (either WT and mutants), with the resulting implication that kET is likely rapid and kinetically invisible in most instances.
The factors that control long-range ET across a water interface are of great interest in biology, and the present studies provide the first implication of a role for the conserved interdomain tyrosine in TβM (and by inference DβM and PHM) in facilitating ET from CuH to CuM. The data provided suggest that Y216 plays a role in enabling the pathway/energetics for ET and while replacement with tryptophan or isoleucine may impair this process, the impact is not large enough to make kET rate-determining. In marked contrast, introduction of alanine at 216 appears to disrupt one of the essential conditions for rapid electron tunneling, i.e. the presence of either an aromatic or large hydrophobic group in this position. It is of note that the mutation of the histidine ligand that pi-stacks with Y216 (cf. Figure 1), was previously shown to have a very different impact on activity than Y216A (23). In the case of H172A (PHM), the trends for Dkcat and D(kcat/Km,substrate) resembled that for WT-TβM and Y216W/I. The failure to detect a rate-limiting kET for H172A (PHM) is most likely due to the enormous reduction in kC–H (104-fold), such that kET, while still greatly affected, remained greater than kC–H. This study results in the first experimental detection of rate-limiting long-range ET from CuH to CuM in the small family of dicopper mononuclear monooxygenases.
Conclusions
Y216 was mutated to a W/I/A to test the hypothesis that bulk at this position and/or a pi-stacking interaction with H317 (Y79 and H172 in PHM, Figure 1B) at CuH is a structural requirement for efficient long-range ET from CuH to CuM. Mutating Y216 to either a W/I has a relatively minor impact on TβM function with kcat and kcat/Km,Tyr reduced ca. 20- and 13-fold, respectively. Analysis of the deuterium KIEs on kcat vs. kcat/Km,Tyr leads to the conclusion of a similar reduction in both the rates of substrate/product release and the C–H bond cleavage for these variants relative to WT TβM, suggesting a shift of the conformational landscape away from the ensemble that is optimally active for the WT enzyme. Replacing Y216 with a small residue such as alanine does not prevent turnover, since in the limit of saturating substrate and O2 kcat is even a little larger than for the other Y216 variants. However, introduction of alanine at position 216 has a range of profound effects that include a proclivity of the H398 at CuM toward oxidation, a faster rate of loss of substrate from the CuM site and an apparent reduction in the rate of ET from CuH to CuM such that this step has now become almost fully rate-determining for kcat. In addition to a direct role for the side chain at position 216 on ET, the size and hydrophobicity at residue 216 is proposed to alter the structuring of water between CuH and CuM that affects the chemical stability of metal ligands toward oxidation and the access of substrate to CuM (42). These data represent a paradigm shift in our conceptualization of the class of enzymes that constitute TβM, DβM, and PHM. Rather than focusing on the properties of separate metal binding domains, it is becoming increasingly clear [cf. (42)] that a single and highly connected, albeit solvent-exposed, active site controls numerous features of their chemical reactivity.
Supplementary Material
Acknowledgments
We wish to thank Dr. Monika Sommerhalter for careful reading of this manuscript and extremely valuable input.
Abbreviations
- TβM
tyramine β-monooxygenase
- DβM
dopamine β-monooxygenase
- PHM
peptidylglycine α-hydroxylating monooxygenase
- PAM
peptidylglycine α-amidating monooxygenase
- ET
electron transfer
- ICP-OES
inductively coupled plasma optical emission spectroscopy
- CD
circular dichroism
- EPR
electron paramagnetic resonance
- TCEP
tris(2-carboxyethyl)phosphine hydrochloride
- IAA
iodoacetic acid
- EDTA
ethylenediamine tetraacetic acid
- KPi
potassium phospate buffer
- ROS
reactive oxygen species
- WT
wild-type
- Y
tyrosine
- W
tryptophan
- I
isoleucine
- A
alanine
- M
methionine
- Tyr
tyramine
- H-tyramine
tyramine without deuterium labeling
- D-tyramine
β, β-[2H2]-tyramine
- kcat(app)
apparent kcat at a given O2 concentration
Footnotes
Financial support was provided by the National Institutes of Health (GM025765 to J.P.K.; GM082095 to R.L.O.; NS027583 to N.J.B; and 1S10RR022393-01 to A.T.I.).
Additional EPR spectra, XAS data, octopamine standard curve, time courses for enzyme inactivation, and LC-MS/MS spectra are in the figures in Supporting Information. Tables in Supporting Information include the fits to EXAFS data and kinetic parameters obtained using H- and D-tyramine as substrate. This material is available free of charge via the Internet at http://pubs.acs.org.
References
- 1.Evans PD. Octopamine. In: Kerknt GA, Gilbert LI, editors. Comprehensive Insect Physiology, Biochemistry and Pharmacology. Pergamon; Oxford: 1985. pp. 499–530. [Google Scholar]
- 2.Klinman JP. The copper-enzyme family of dopamine β-monooxygenase and peptidylglycine α-hydroxylating monooxygenase: Resolving the chemical pathway for substrate hydroxylation. J Biol Chem. 2006;281:3013–3016. doi: 10.1074/jbc.R500011200. [DOI] [PubMed] [Google Scholar]
- 3.Eipper BA, Quon ASW, Mains RE, Boswell JS, Blackburn NJ. The catalytic core of peptidylglycine α-hydroxylating monooxygenase: Investigation by site-directed mutagenesis, Cu X-ray absorption spectroscopy, and electron paramagnetic resonance. Biochemistry. 1995;34:2857–2865. doi: 10.1021/bi00009a016. [DOI] [PubMed] [Google Scholar]
- 4.Gray EE, Small SN, McGuirl MA. Expression and characterization of recombinant tyramine β-monooxygenase from Drosophila: A monomeric copper-containing hydroxylase. Prot Exp Purif. 2006;47:162–170. doi: 10.1016/j.pep.2005.11.008. [DOI] [PubMed] [Google Scholar]
- 5.Prigge ST, Eipper BA, Mains RE, Amzel LM. Amidation of bioactive peptides: The structure of peptidylglycine α-hydroxylating monooxygenase. Science. 1997;278:1300–1305. doi: 10.1126/science.278.5341.1300. [DOI] [PubMed] [Google Scholar]
- 6.Prigge ST, Kolhekar AS, Eipper BA, Mains RE, Amzel LM. Substrate- mediated electron transfer in peptidylglycine α-hydroxylating monooxygenase. Nature. 1999;6:976–983. doi: 10.1038/13351. [DOI] [PubMed] [Google Scholar]
- 7.Prigge ST, Eipper BA, Mains RE, Amzel LM. Dioxygen binds end-on to mononuclear copper in a precatalytic complex. Science. 2004;304:864–867. 32. doi: 10.1126/science.1094583. [DOI] [PubMed] [Google Scholar]
- 8.Siebert X, Eipper BA, Mains RE, Prigge ST, Blackburn NJ, Amzel LM. The catalytic copper of peptidylglycine α-hydroxylating monooxygenase also plays a critical structural role. Biophys J. 2005;89:3312–3319. doi: 10.1529/biophysj.105.066100. [DOI] [PMC free article] [PubMed] [Google Scholar]
- 9.Blackburn NJ, Pettingill TM, Seagraves KS, Shigeta RT. Characterization of a carbon monoxide complex of reduced dopamine β-hydroxylase. Evidence for inequivalence of the Cu(I) centers. J Biol Chem. 1990;265:15383–15386. [PubMed] [Google Scholar]
- 10.Klinman JP. Mechanisms whereby mononuclear copper proteins functionalize organic substrates. Chem Rev. 1996;96:2541–2561. doi: 10.1021/cr950047g. [DOI] [PubMed] [Google Scholar]
- 11.Boswell JS, Reedy BJ, Kulathila R, Merkler D, Blackburn NJ. Structural investigations on the coordination environment of the active site copper centers of recombinant bifunctional peptidylglycine α-amidating enzyme. Biochemistry. 1996;35:12241–12250. doi: 10.1021/bi960742y. [DOI] [PubMed] [Google Scholar]
- 12.Reedy BJ, Blackburn NJ. Preparation and characterization of half-apo dopamine-β-hydroxylase by selective removal of CuA. Identification of a sulfur ligand at the dioxygen binding site by EXAFS and FTIR spectroscopy. J Am Chem Soc. 1994;116:1924–1931. [Google Scholar]
- 13.Scott RA, Sullivan RJ, DeWolf WE, Dolle RE, Kruse LI. The copper sites of dopamine β-hydroxylase: An x-ray absorption spectroscopic study. Biochemistry. 1988;27:5411–5417. doi: 10.1021/bi00415a005. [DOI] [PubMed] [Google Scholar]
- 14.Hess CR, Klinman JP, Blackburn NJ. The copper centers of tyramine β-monooxygenase and its catalytic-site methionine variants. An x-ray absorption study. J Biol Inorg Chem. 2010;15:1195–1207. doi: 10.1007/s00775-010-0677-3. [DOI] [PMC free article] [PubMed] [Google Scholar]
- 15.Goldstein M, Joh TH, Garvey TQ., III Kinetic studies of the enzymic dopamine β-hydroxylation reaction. Biochemistry. 1968;7:2724–2730. doi: 10.1021/bi00848a005. [DOI] [PubMed] [Google Scholar]
- 16.Klinman JP, Humphries H, Voet JG. Deduction of kinetic mechanism in multisubstrate enzyme reactions from tritium isotope effects. J Biol Chem. 1980;255:11648–11651. [PubMed] [Google Scholar]
- 17.Brenner MC, Klinman JP. Correlation of copper valency with product formation in single turnovers of dopamine β-monooxygenase. Biochemistry. 1989;28:4664–4670. doi: 10.1021/bi00437a023. [DOI] [PubMed] [Google Scholar]
- 18.Francisco WA, Merkler DJ, Blackburn NJ, Klinman JP. Kinetic mechanism and intrinsic isotope effects for the peptidylglycine α-amidating enzyme reaction. Biochemistry. 1998;37:8244–8252. doi: 10.1021/bi973004y. [DOI] [PubMed] [Google Scholar]
- 19.Tian G, Berry JA, Klinman JP. Oxygen-18 kinetic isotope effects in the dopamine β-monooxygenase reaction: Evidence for a new chemical mechanism in non-heme metallomonooxygenases. Biochemistry. 1994;33:226–234. doi: 10.1021/bi00167a030. [DOI] [PubMed] [Google Scholar]
- 20.Crespo A, Martí MA, Roitberg AE, Amzel LM, Estrin DA. The catalytic mechanism of peptidylglycine α-hydroxylating monooxygenase investigated by computer simulation. J Am Chem Soc. 2006;128:12817–12828. doi: 10.1021/ja062876x. [DOI] [PubMed] [Google Scholar]
- 21.Francisco WA, Blackburn NJ, Klinman JP. Oxygen and hydrogen isotope effects in an active site tyrosine to phenylalanine mutant of peptidylglycine α-hydroxylating monooxygenase: Mechanistic implications. Biochemistry. 2003;42:1813–1819. doi: 10.1021/bi020592t. [DOI] [PubMed] [Google Scholar]
- 22.Evans JP, Ahn K, Klinman JP. Evidence that dioxygen and substrate activation are tightly coupled in dopamine β-monooxygenase. Implications for the reactive oxygen species. J Biol Chem. 2003;278:49691–49698. doi: 10.1074/jbc.M300797200. [DOI] [PubMed] [Google Scholar]
- 23.Evans JP, Blackburn NJ, Klinman JP. The catalytic role of the copper ligand H172 of peptidylglycine α-hydroxylating monooxygenase: A kinetic study of the H172A mutant. Biochemistry. 2006;45:15419–15429. doi: 10.1021/bi061734c. [DOI] [PubMed] [Google Scholar]
- 24.Chen P, Solomon EI. Oxygen activation by the noncoupled binuclear copper site in peptidylglycine alpha-hydroxylating monooxygenase. Reaction mechanism and role of the noncoupled nature of the active site. J Am Chem Soc. 2004;126:4991–5000. doi: 10.1021/ja031564g. [DOI] [PubMed] [Google Scholar]
- 25.Kunishita A, Kubo M, Sugimoto H, Ogura T, Sato K, Takui T, Itoh S. Mononuclear copper(II)-superoxo complexes that mimic the structure and reactivity of the active centers of PHM and DβM. J Am Chem Soc. 2009;131:2788–2789. doi: 10.1021/ja809464e. [DOI] [PubMed] [Google Scholar]
- 26.Kunishita A, Ertem MZ, Okubo Y, Tano T, Sugimoto H, Ohkubo K, Fujieda N, Fukuzumi S, Cramer CJ, Itoh S. Active site models fot the CuA site of peptidylglycine α-hydroxylating monooxygenase and dopamine β-monooxygenase. Inorg Chem. 2012;51:9465–9480. doi: 10.1021/ic301272h. [DOI] [PubMed] [Google Scholar]
- 27.Francisco WA, Wille G, Smith AJ, Merkler DJ, Klinman JP. Investigation of the pathway for inter-copper electron transfer in peptidylglycine α-amidating monooxygenase. J Am Chem Soc. 2004;126:13168–13169. doi: 10.1021/ja046888z. [DOI] [PubMed] [Google Scholar]
- 28.Bell J, El Meskini R, D’Amato D, Mains RE, Eipper BA. Mechanistic investigation of peptidylglycine α-hydroxylating monooxygenase via intrinsic tryptophan fluorescence and mutagenesis. Biochemistry. 2003;42:7133–7142. doi: 10.1021/bi034247v. [DOI] [PubMed] [Google Scholar]
- 29.Hess CR, Wu Z, Ng A, Gray EE, McGuirl MM, Klinman JP. Hydroxylase activity of Met471Cys tyramine β-monooxygenase. J Am Chem Soc. 2008;130:11939–11944. doi: 10.1021/ja800408h. [DOI] [PubMed] [Google Scholar]
- 30.Hess CR, McGuirl MM, Klinman JP. Mechanism of the insect enzyme, tyramine β-monooxygenase, reveals differences from the mammalian enzyme, dopamine β-monooxygenase. J Biol Chem. 2008;283:3042–3049. doi: 10.1074/jbc.M705911200. [DOI] [PubMed] [Google Scholar]
- 31.George GN. Exafspak. Stanford Synchrotron Radiation Laboratory; 1990. [Google Scholar]
- 32.Binsted N, Gurman SJ, Campbell JW. Excurve 9.2. Daresbury Laboratory; 1998. [Google Scholar]
- 33.Gurman SJ, Binsted N, Ross I. A rapid, exact curved-wave theory for EXAFS calculations. J Phys C. 1984;17:143–151. [Google Scholar]
- 34.Gurman SJ, Binsted N, Ross I. A rapid, exact curved-wave theory for EXAFS calculations. II. The multiple-scattering contributions. J Phys C. 1986;19:1845–1861. [Google Scholar]
- 35.Binsted N, Hasnain SS. State-of-the-art analysis of whole X-ray absorption spectra. J Synchrotron Radiat. 1996;3:185–196. doi: 10.1107/S0909049596005651. [DOI] [PubMed] [Google Scholar]
- 36.Blackburn NJ, Rhames FC, Ralle M, Jaron S. Major changes in copper coordination accompany reduction of peptidylglycine monooxygenase: implications for electron transfer and the catalytic mechanism. J Biol Inorg Chem. 2000;5:341–353. doi: 10.1007/pl00010663. [DOI] [PubMed] [Google Scholar]
- 37.Osborne RL, Zhu H, Iavarone AT, Hess CR, Klinman JP. Inactivation of Met471Cys tyramine β-monooxygenase results from site-specific cysteic acid formation. Biochemistry. 2012;51:7488–7495. doi: 10.1021/bi300456f. [DOI] [PMC free article] [PubMed] [Google Scholar]
- 38.Miller SM, Klinman JP. Secondary isotope effects and structure-reactivity correlations in the dopamine beta-monooxygenase reaction: Evidence for a chemical mechanism. Biochemistry. 1985;24:2114–2127. doi: 10.1021/bi00330a004. [DOI] [PubMed] [Google Scholar]
- 39.Miller SM, Klinman JP. Magnitude of the intrinsic isotope effects in the dopamine β-monooxygenase reaction. Biochemistry. 1983;22:3091–3096. doi: 10.1021/bi00282a011. [DOI] [PubMed] [Google Scholar]
- 40.Nagel ZD, Dong M, Bahnson BJ, Klinman JP. Impaired conformational landscapes as revealed in anomalous Arrhenius prefactors. Proc Natl Acad Sci USA. 2011;108:10520–10525. doi: 10.1073/pnas.1104989108. [DOI] [PMC free article] [PubMed] [Google Scholar]
- 41.Sharma S, Klinman JP. Kinetic detection of impaired protein conformational land-scapes: double mutants of soybean lipoxygenase. J Am Chem Soc. under revision. [Google Scholar]
- 42.Osborne RL, Klinman JP. Insights into the proposed copper oxygen intermediates that regulate the mechanism of reactions catalyzed by dopamine β-monooxygenase, peptidylglycine α-hydroxylating monooxygenase, and tyramine β-monooxygenase. In: Karlin KD, Itoh S, editors. Copper Oxygen Chemistry. Vol. 4. Wiley & Sons, Ltd; U.S.A: 2011. pp. 1–22. (Wiley Series on Reactive Intermediates in Chemistry and Biology). [Google Scholar]
Associated Data
This section collects any data citations, data availability statements, or supplementary materials included in this article.