Abstract
Development of tools to jointly visualize the genome and the epigenome remains a challenge. chroGPS is a computational approach that addresses this question. chroGPS uses multidimensional scaling techniques to represent similarity between epigenetic factors, or between genetic elements on the basis of their epigenetic state, in 2D/3D reference maps. We emphasize biological interpretability, statistical robustness, integration of genetic and epigenetic data from heterogeneous sources, and computational feasibility. Although chroGPS is a general methodology to create reference maps and study the epigenetic state of any class of genetic element or genomic region, we focus on two specific kinds of maps: chroGPSfactors, which visualizes functional similarities between epigenetic factors, and chroGPSgenes, which describes the epigenetic state of genes and integrates gene expression and other functional data. We use data from the modENCODE project on the genomic distribution of a large collection of epigenetic factors in Drosophila, a model system extensively used to study genome organization and function. Our results show that the maps allow straightforward visualization of relationships between factors and elements, capturing relevant information about their functional properties that helps to interpret epigenetic information in a functional context and derive testable hypotheses.
INTRODUCTION
Understanding how genomic information is translated into cellular functions constitutes a main challenge in Biology. The eukaryotic genome exists as chromatin, a nucleoprotein complex composed by DNA, regulatory RNAs and a variety of histone and non-histone proteins that are often modified and regulate expression of the genetic information contained in DNA (1–3). Chromatin contains both genetic information encoded in the DNA sequence and epigenetic instructions that, residing in DNA-associated factors and modifications, regulate its expression. Full understanding of the functional content of the genome requires description of the epigenetic information contained in chromatin or, in other words, the epigenome.
In recent years, after sequencing the genomes of several model organisms, large amounts of data have been gathered regarding different aspects of genome functioning, from gene expression and non-coding RNAs to the genomic distribution of epigenetic factors, namely DNA methylation, histone modifications and chromatin associated proteins. There are also numerous databases describing gene functions and interactions. Tools to analyze, visualize and integrate genomic data at a functional level are available. However, integrating experimental results and databases on epigenetic factors and genetic elements in a user-friendly manner, amenable to the non-specialist, remains a challenge [reviewed in (4)]. In this context we developed chroGPS, a global chromatin positioning system to integrate and visualize the associations between epigenetic factors and their relation to functional genetic elements in low-dimensional maps.
chroGPS belongs to the family of dimensionality reduction techniques that have proven successful in analyzing genomic data (5–9). The basic rationale is to measure similarity between epigenetic factors or between genetic elements on the basis of their epigenetic state and using multidimensional scaling (MDS) represent the similarities in 2D/3D reference maps. Emphasis is placed on interpretability, computational feasibility and statistical considerations to guarantee reliable representations and integration of data from multiple sources (studies, technologies, genetic backgrounds, etc.). A key feature of the approach lies in its generality: rather than producing a map in a specific condition, we provide a map-generating tool applicable to a wide range of situations. We illustrate the potential with two specific types of maps: chroGPSfactors, which describes similarities between epigenetic factors based on their genomic distribution profiles and informs about their functional association, and chroGPSgenes, which integrates epigenetic marks at the gene level and describes the epigenetic context of gene expression and function. As a proof of principle, we generated chroGPS maps using data from the modENCODE project in Drosophila (10), which constitutes the most comprehensive dataset on epigenetic factors available to date.
MATERIALS AND METHODS
Data access
ChIP-chip data from the modEncode project are freely available at www.modencode.org. Supplementary Tables S1 and S2 provide the sample identifiers. ChIP-seq data were obtained from the NCBI GEO repository at http://www.ncbi.nlm.nih.gov/geo/ (GSE19325, GSE24115 and GSE27078). See Supplementary Section S1 for details on data acquisition and formatting.
Generation, integration and annotation of chroGPS maps
chroGPS is based on two steps. First, numeric distances between objects are measured with a user-specified metric. Second, MDS is applied to generate a low-dimensional map where Euclidean distances between objects approximate the calculated distances. Therefore, the main challenges are defining an appropriate distance metric and generating a high-quality map in a reasonable computational time. Below we address these issues separately for chroGPSfactors and chroGPSgenes. Another important challenge is integrating data from different sources, as strong source-specific biases that hamper analysis are usually present. We propose methods to adjust these biases. Finally, it is important to annotate the maps to maximize their usefulness. We discuss multivariate statistical techniques such as projections, clustering or non-parametric density estimation that help interpreting the maps. The practical use of these methodologies is described in the ‘Results’ section, pointing to detailed descriptions in the Supplementary Materials whenever appropriate.
We provide the open-source Bioconductor package chroGPS (11) (http://www.bioconductor.org). The manuals illustrate the functionality, data import and export for integration with Cytoscape (12), and the code required for our analyses.
RESULTS
Generating chroGPS maps for epigenetic factors
The inputs for chroGPSfactors are lists of genomic intervals with predicted binding sites for each epigenetic factor, e.g. inferred from ChIP-chip or ChIP-seq experiments. We also allow using continuous scores (e.g. probe intensities, sequencing coverage) as input data. By default we use genomic intervals, as these are comparable across technologies and usually provide similar maps to those from continuous scores. Furthermore, genome annotations (genes, promoters, transposons, etc.) are also expressed as genomic intervals, facilitating data integration.
The first step in chroGPSfactors is defining a similarity measure between two factors based on their genomic profile overlap. Although in principle MDS can be used with any similarity measure, it is important to assess its performance and effects on the final results. To address this question, we considered three metrics: interval Tanimoto (iTanimoto), average interval overlap (iOverlap) and chi-square (Supplementary Section S3). When the input are continuous scores we defined distances as d = (1−r)/2, where r is the Pearson correlation between two genome-wide profiles. Continuous scores were also used to perform Principal Component Analysis (PCA).
The second step is generating 2D/3D maps where distances between elements are as similar as possible to the calculated distances. Obviously, the larger the number of elements the harder it is to represent all distances accurately. We focused on two popular MDS techniques: classical metric MDS (13) and isoMDS (14). The former produces a map where pairwise Euclidean distances between elements approximate the original distances in squared norm. isoMDS is a non-metric MDS that considers monotone transformations of the input distances. We measure the map accuracy with the squared Pearson correlation (R2) between original and approximated distances and the classical stress-1 function (s) (Supplementary Section S2).
Based on simulation studies and observations in experimental data, by default we recommend iOverlap combined with isoMDS. This choice exhibited a robust behavior when the number of binding sites was unbalanced across factors, and gave good representation accuracy and biological meaningful maps. See Supplementary Section S3.2 and Supplementary Figures S1–S3.
chroGPSfactors describes main functional chromatin states
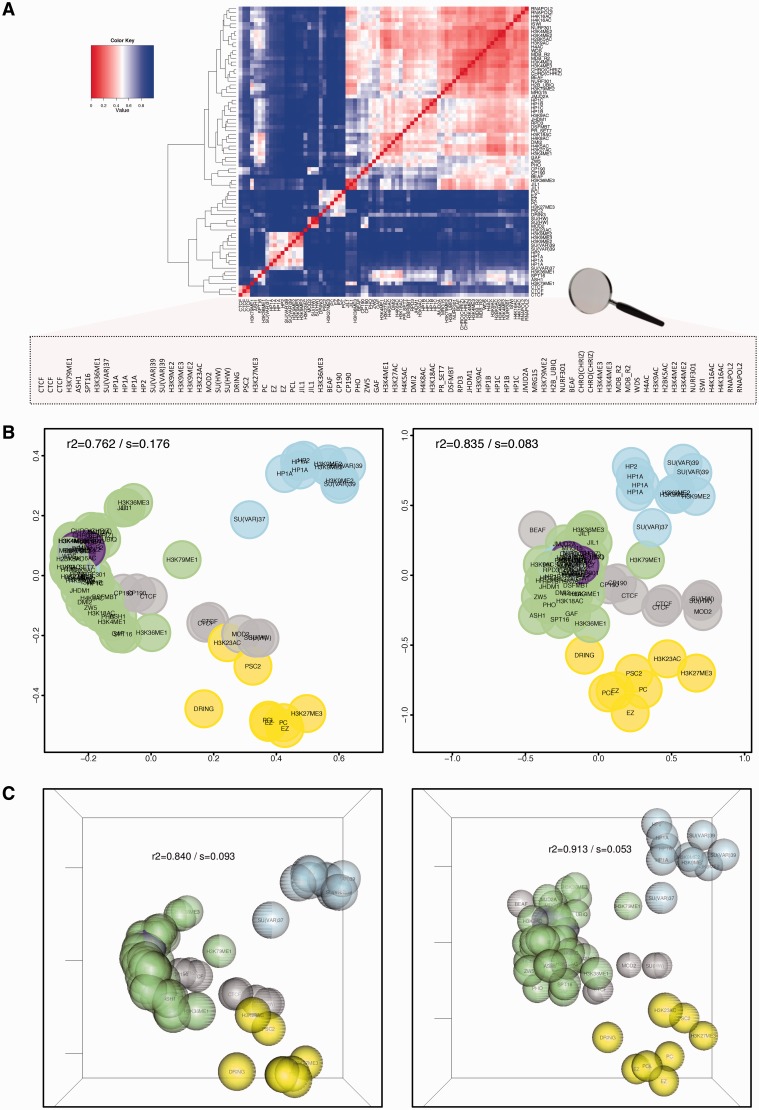
Figure 1A shows iOverlap distances between factors in Drosophila S2 cells (rows and columns sorted by hierarchical clustering). While the plot suggests several clusters, interpretation is not straightforward and the relative similarity between clusters is unclear. Instead, representing the distance matrix in 2D/3D reference maps (Figure 1B and C, Supplementary Figure S14 and Video S1) provides a directly interpretable representation. isoMDS maps show higher R2 than their classicMDS counterparts, and for both metrics 3D maps provide a non-negligible accuracy improvement. Therefore, although for convenience we use 2D representations throughout the manuscript, we generally recommend 3D maps for better visualization.
Figure 1.
chroGPSfactors visualizes functional associations between epigenetic factors. Similarity between 76 individual epigenetic factors (Supplementary Table S1), as determined from their genomic profiles with iOverlap, is represented in a heatmap with hierarchical clustering dendrogram (A) or 2D (B) and 3D (C) reference maps using classical MDS (left) or isoMDS (right). R2 and stress (s) are indicated. Factors are colored according to their biological activity: RNApol II (purple), regulation of transcription (green), boundary/insulator function (gray), HP1-(blue) and Polycomb (PC)-dependent silencing (yellow). See also Supplementary Video S1 for visualization of the 3D-map in motion (Supplementary Section S10.1).
The map describes main functional chromatin states. To facilitate interpretation, we colored factors according to their biological activity: RNApol II (purple), regulation of transcription (green), boundary/insulator function (gray), HP1-dependent (blue) and Polycomb (PC)-dependent silencing (yellow). As shown in Figure 1B and C, the map has a characteristic funnel configuration. Factors involved in transcription regulation seat at the apex and define the ‘active chromatin’ domain, while boundary/insulator, HP1- and PC-chromatin domains localize in the wider zone. In the core of the ‘active chromatin’ domain resides RNApol II (purple), and several branches emerge from there (Supplementary Section S8).
chroGPSfactors integrates data from different sources
The practical usefulness of chroGPS strongly depends on its ability to integrate data from different sources; an extreme case being datasets obtained using completely different methodologies. For instance, at present genomic profiling of epigenetic factors is largely determined through ChIP-seq experiments, which identify binding sites at higher accuracy than ChIP-chip. Due to intrinsic technical differences, ChIP-seq and ChIP-chip data tend to appear on separate layers in the map (Supplementary Figure S5).
We propose two bias-adjustment methods: Procrustes and peak width adjustment (PWA). Procrustes superimposes two sets of points by altering their center, scale and orientation, while preserving relative distances within each set. It is a general adjustment that accounts for fairly general biases. A limitation is requiring the datasets to share common points (in practice, ≥3), which may not be available. As an important difference across methodologies lies in peak-calling resolution, we propose PWA as an alternative. PWA selects the source with widest peaks and increases the peak width in the remaining sources until the mean and standard deviation of the peak width distribution are equal. See Supplementary Section S5.1 for further details and results.
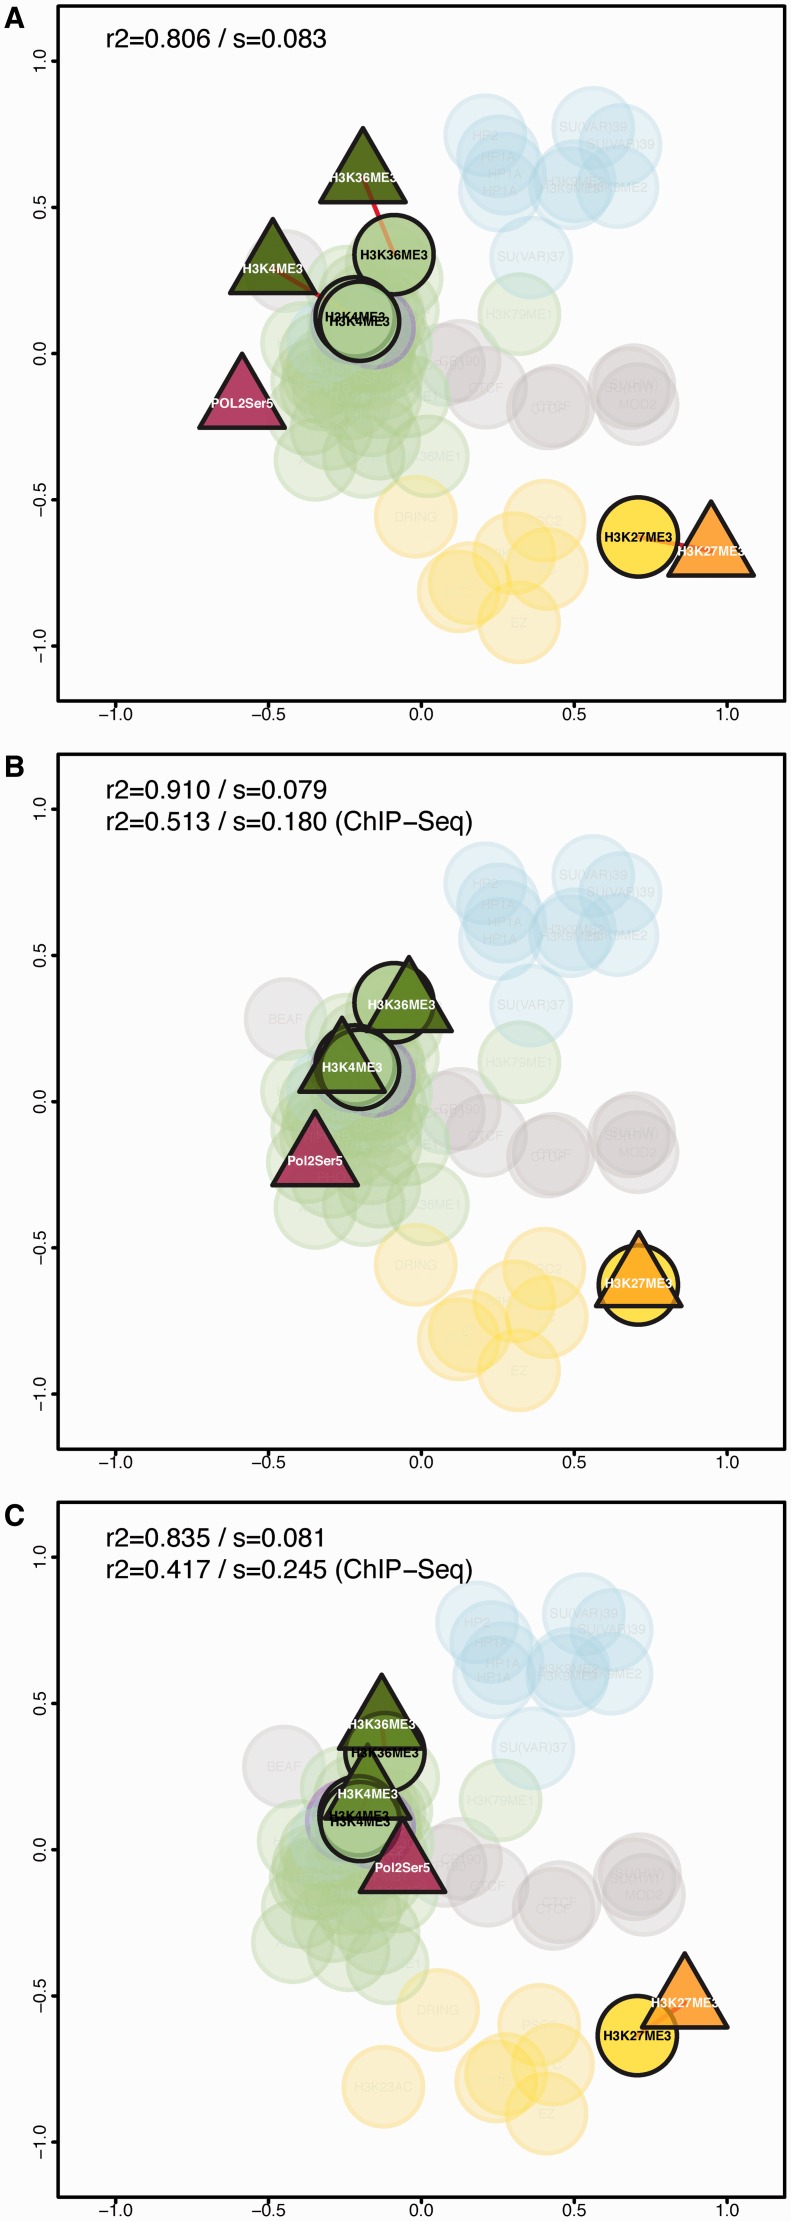
We illustrate the power of chroGPSfactors to integrate data from different sources using four factor profiles obtained via ChIP-seq. For the three factors, ChIP-chip data are also available (H3K4me3, H3K27me3 and H3K36me3), the remaining one being the active RNApol II form Pol IIoser5 (15) (see ‘Data Access’ section). A joint ChIP-chip/ChIP-seq map including these data (Figure 2A) locates the three common ChIP-seq elements as an external layer to their ChIP-chip counterparts. As shown in Figure 2B, applying Procrustes to Figure 2A using the three common elements effectively matches ChIP-seq and ChIP-chip locations. The adjustment also brings the Pol IIoser5 ChIP-seq position in close proximity to whole RNApol II and other transcription activation factors. Applying PWA to Figure 2A provides similar results (Figure 2C).
Figure 2.
Integration of ChIP-chip and ChIP-seq data in chroGPSfactors maps. ChIP-seq data (triangles) for H3K4me3, H3K27me3 H3K36me3 and Pol IIoser5 is integrated into the chroGPSfactors map generated from modENCODE ChIP-chip data (circles). The joint ChIP-chip/ChIP-seq 2D-map is presented without any adjustment (A) and after Procrustes (B) or PWA (C) adjustment. ChIP-Seq elements and the corresponding ChIP-chip counterparts are highlighted. Common factors in both technical backgrounds (replicates) are joined by a red line. Maps were generated from iOverlap distances and represented using isoMDS. R2 and stress (s) are indicated for both the joint map and the ChIP-Seq map before (A) and after integration (B and C).
chroGPSfactors assesses conservation of functional co-operation and genomic location of epigenetic factors
Functional co-operation between epigenetic factors is largely conserved, implying that chroGPSfactors maps obtained separately in different cellular backgrounds should present similar configurations. However, the actual genomic locations of the factors under consideration may well differ across backgrounds (e.g. binding different genes). These observations prompt a direct use of chroGPS maps to assess conservation of both genomic locations and factor interactions, e.g. identify cell-type specific interactions or disease-related alterations. Whenever the genomic locations of a given factor are conserved across backgrounds, directly merging all data into a joint map reveals a similar location for that factor across all backgrounds. If only interactions between factors are conserved (but not factor-binding sites), backgrounds appear separated in the map but the relative factor positions within each background are conserved. See Supplementary Section S5.2 for further details.
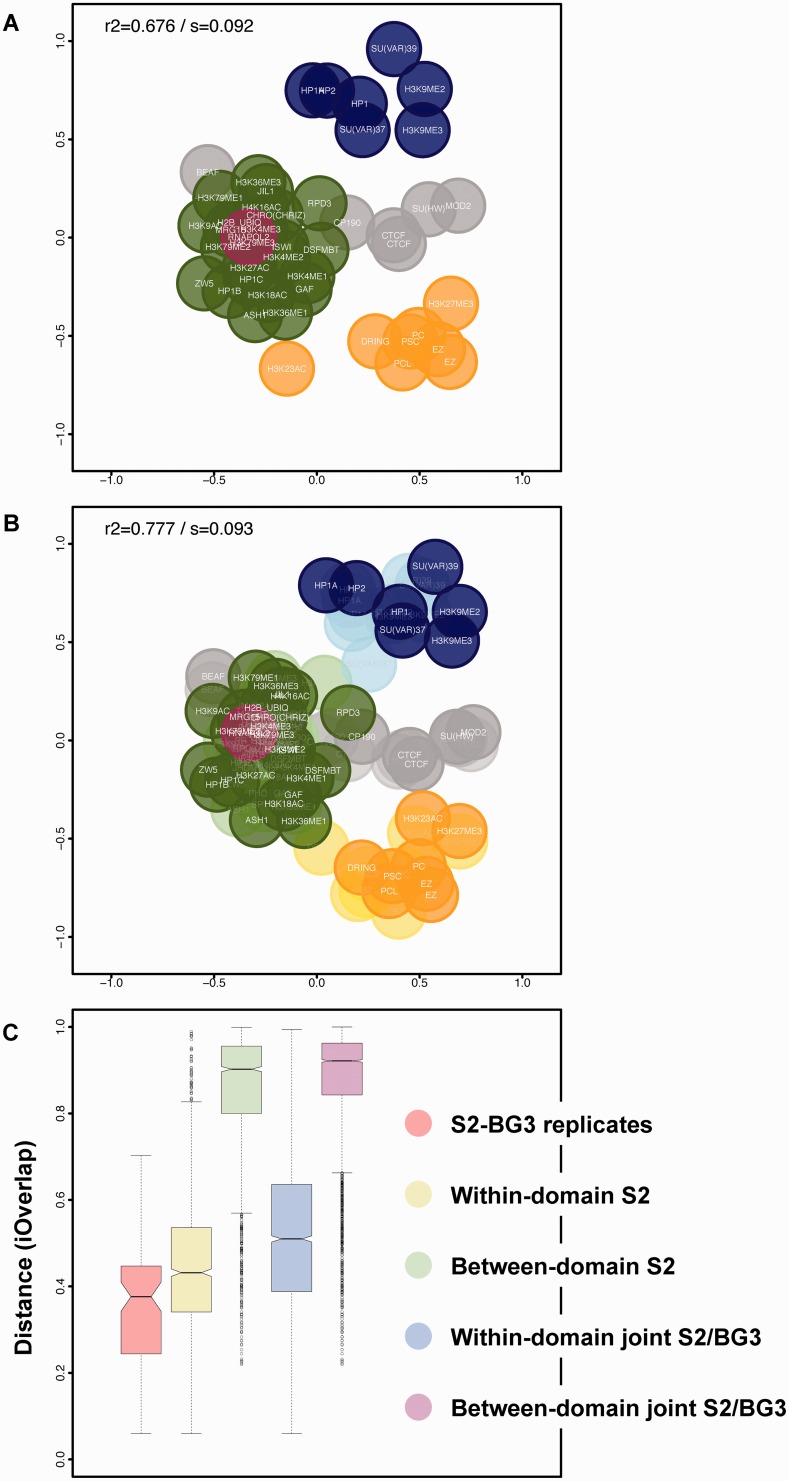
We integrated ChIP-chip data from Drosophila BG3 cell line (Supplementary Table S2) with the S2 data shown above. BG3 is a third instar larval stage CNS-derived cell line while S2 is a late embryonic cell line. As anticipated, a separate BG3 map (Figure 3A) retains the general features of the S2 map, which indicates that functional associations between factors are largely conserved. Figure 3B merges the two datasets, calculating a joint S2/BG3 distance matrix and representing it via isoMDS. Remarkably, the joint map is biologically meaningful and shows a similar configuration to the individual maps. This finding indicates that genomic locations of most factors are highly conserved, i.e. the S2/BG3 distance for each factor is relatively small. Indeed, S2/BG3 distances are of the same magnitude as distances between functionally related factors (intra-domain) and much smaller than those between unrelated factors (inter-domain) (Figure 3C). Furthermore, in the joint S2/BG3 map intra- and inter-domain distances are similar to those in the S2 map (Figure 3C), i.e. the joint map describes functional domains as accurately as the separate maps.
Figure 3.
Integration of data from different cellular backgrounds in chroGPSfactors maps. (A) Map generated from modENCODE ChIP-chip data obtained in BG3 cells for 46 different epigenetic factors (Supplementary Table S2). (B) Joint S2/BG3 map obtained by merging S2 and BG3 datasets. Color code is as in Figure 1 and BG3 factors are highlighted. Maps were generated from iOverlap distances and represented using isoMDS. R2 and stress (s) are indicated. (C) iOverlap distances between S2-BG3 replicates are compared to those between functionally related (within-domain) and unrelated (between-domain) factors determined in both the S2 and the joint S2/BG3 chroGPSfactors maps.
These results indicate that chroGPS maps identify cases where genome-wide factor location is conserved. We now investigate their ability to detect situations where functional interplays are conserved but genomic locations differ across backgrounds. We performed a simulation study by artificially increasing/decreasing the similarities between S2 and BG3, while not altering similarities within each cell line (Supplementary Section S5.2). That is, we emulated a situation where interplays within cell lines are conserved but genomic locations are not conserved across cell lines. The map preserved its general configuration whenever S2/BG3 distances remained smaller than inter-domain distances (Supplementary Figure S8). As desired, when S2/BG3 distances grew further the map split S2 from BG3 factors into two subsets, each with similar configuration. These results show that chroGPSfactors maps assess conservation of functional interactions and genomic locations in a straightforward manner.
chroGPSfactors functionally catalogs novel epigenetic factors
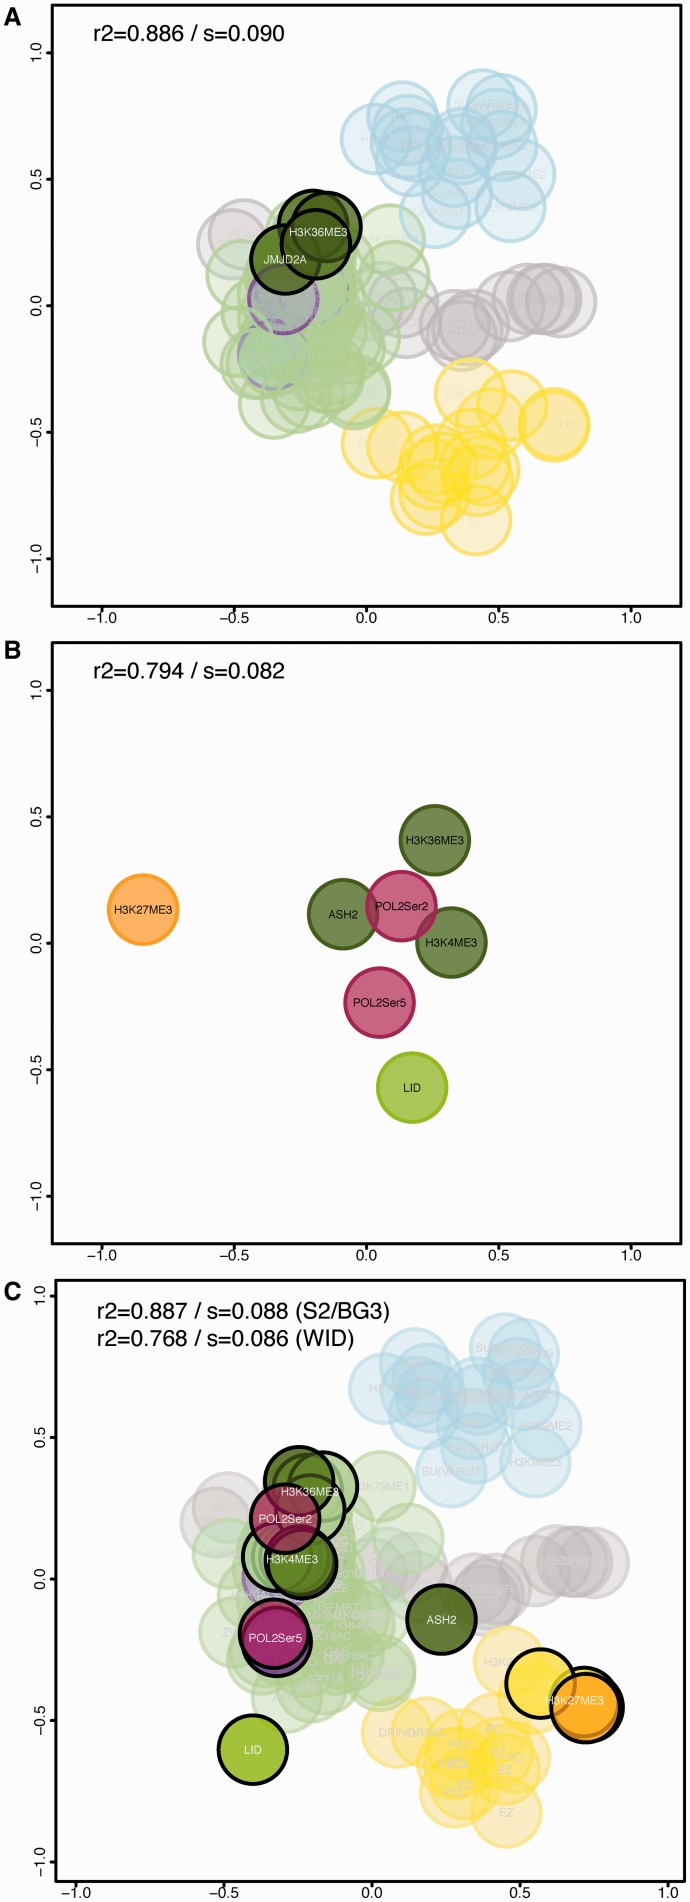
Here we use chroGPSfactors to interrogate about the functions of novel factors in epigenetic terms. This operation is straightforward when the novel factor is studied in an experimental system with abundant experimental data from other factors. It simply requires including the new data and generating a joint map. As an example, Figure 4A highlights the position of JMJD2A, a histone demethylase of unknown function that is capable of demethylating both H3K9me3 and H3K36me3 (16,17). JMJD2A localizes in the active chromatin domain close to H3K36me3, suggesting that in vivo it demethylates H3K36me3 and contributes to transcription regulation.
Figure 4.
Using chroGPSfactors maps to analyze novel epigenetic factors of unknown function. (A) The position corresponding to JMJD2A is highlighted in the map integrating S2 ChIP-chip and ChIP-seq data, and BG3 ChIP-chip data. The positions of three different datasets for H3K36me3 are also indicated. (B) chroGPSfactors map generated from ChIP-seq data obtained in the wing imaginal disc (WID) for the seven indicated factors. The map was generated from iOverlap distances and represented using isoMDS. R2 and stress (s) are indicated. (C) Joint S2/WID chroGPSfactors map integrating WID ChIP-seq data, and S2 ChIP-chip and ChIP-seq data. The map was generated from iOverlap distances, represented using isoMDS and adjusted using Procrustes. Pearson correlation (R2) and MDS stress function (s) values are indicated for both the joint map and the WID map after integration. Color code is as in Figure 1.
Learning the function of a novel factor in a system with limited experimental data poses a bigger challenge. To illustrate the potential of chroGPS maps in this situation, we used data generated in the Drosophila wing imaginal disc that only contain seven factors, four common to the S2 map (H3K4me3, H3K27me3, H3K36me3 and Pol IIoser5) and three unique (Pol IIoser2, ASH2 and dKDM5/LID) (18,19) (see ‘Data Access’ section). These data were generated by ChIP-seq in a larval structure formed by a heterogeneous population of cells and, thus, differs strongly from embryonic S2 cells ChIP-chip data. A raw map generated with these seven elements contains very low structural information (Figure 4B). In Figure 4C we merged these data with the S2 factors into a joint distance matrix and used Procrustes to match the positions of the four common factors. The unique WING-factors localize to the active chromatin domain, close to other functionally related factors. For instance, elongating Pol IIoser2 lies close to H3K36me3, a modification that is enriched at the coding region of elongating genes. Similarly, dKDM5/LID, which is involved in the regulation of Pol IIoser5 at promoters (18), is close to Pol IIoser5. On the contrary, ASH2, which has also been shown to regulate Pol IIoser5 (19), maps at a more external position, suggesting it plays additional roles. That is, integrating wing imaginal disc and S2 factors into a joint map provided a richer environment to study functions of the former.
Generating chroGPS maps for genetic elements
chroGPSgenes maps display the epigenetic state of genes, as well as their expression and function. The maps are based on measuring similarity between genes according to their shared epigenetic factors. The input is a binary matrix with genes in rows and factors in columns, where 1 indicates that the factor binds that gene and 0 otherwise (Supplementary Section S1). We considered three similarity metrics: chi-square, Tanimoto and average overlap. The former is the basis of correspondence analysis, a standard dimensionality reduction technique for binary matrices. The latter two measure overlap in an intuitive manner and weight all epigenetic factors equally. As some users might consider that sharing a scarce factor can be more biologically meaningful than sharing a frequent one, we defined a weighted Tanimoto distance as a fourth metric. This metric weights co-occurrences inversely to the number of genes with that factor (Supplementary Section S4).
Representing tens of thousands of points via MDS is a high-dimensional problem posing two important challenges. First, classical MDS may fail to numerically minimize the stress function and result in poor R2 coefficients. Second, the required computation time for alternative solutions can be substantial. To overcome these limitations we propose BoostMDS, a novel two-step procedure (Supplementary Section S6). Briefly, BoostMDS finds an initial solution by splitting the distance matrix into smaller overlapping sub-matrices. The sub-problems are computationally tractable, can be run in parallel and the solutions are stitched into an overall map using Procrustes. This initial solution is then refined by formally maximizing the R2 coefficient via a gradient search algorithm with automatic step size selection. By default we recommend applying BoostMDS to Tanimoto distances, as this option achieves high representation accuracy at a substantially reduced computation time (Supplementary Figure S4).
Annotating chroGPSgenes maps
chroGPSgenes maps contain thousands of points, which hampers interpretation. Fortunately, they can integrate genetic data to visualize the relationship between epigenetic states and gene functions. For instance, gene expression or other continuous measurements can be shown by coloring the map. Another basic operation is to highlight genes bound by a given epigenetic factor, related to some genetic pathway or function. We use non-parametric contours to indicate high-density regions for any given gene set. Contours indicate the overlap between gene sets in a manner analogous to Venn diagrams, with the advantage of providing a functional context. See Supplementary Section S7 for details.
Beyond representing individual gene sets, we provide tools to display the results of clustering analyses to help interpret each area in the map. Clusters not showing good separation in the map are merged using posterior expected correct classification (CCR) and probabilistic overlap (PO) criteria. We provide an automatic procedure to stop merging clusters based on change-point analysis. Finally, the robustness of the map interpretation afforded by the clusters is assessed via bootstrap. See Supplementary Section S7 for details.
chroGPSgenes describes the epigenetic context of gene function
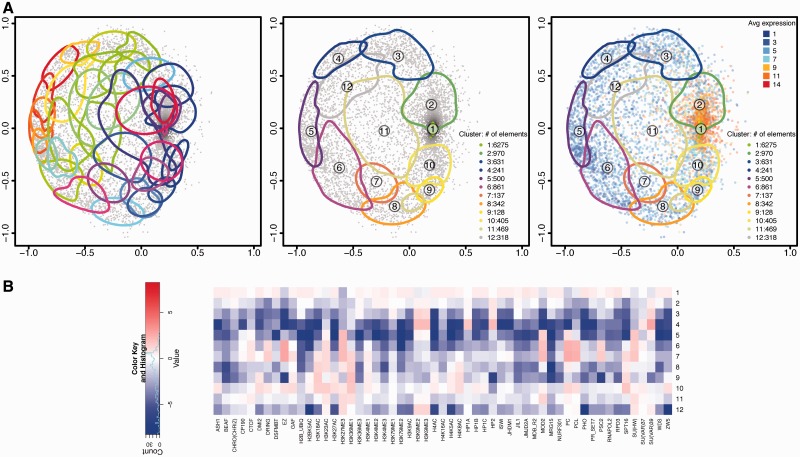
Figure 5A (left) shows the chroGPSgenes map of Drosophila S2 cells based on BoostMDS and Tanimoto distances (for a 3D representation see Supplementary Video S2). Contours in Figure 5A indicate clusters of genes with similar epigenetic profiles (average between-cluster distance threshold = 50%). These clusters overlap strongly and do not provide a clear description of the map. Accordingly, the CCR is low (Supplementary Figure S12). Complexity of the map is highly reduced after merging clusters until their PO drops swiftly (Figure 5A, middle and Supplementary Figure S11). The 37 clusters merged to 12 that are specifically enriched/depleted in particular epigenetic factors (Figure 5B) and describe distinct epigenetic states. This 12-clusters configuration was found to be reproducible in a bootstrap analysis (Supplementary Figure S9 and Supplementary Section S7). Clusters 1–2 correspond to the ‘active chromatin region’, clusters 3 and 4 to the ‘HP1-chromatin region’, clusters 5, 6, 7, 8 and 10 to the ‘PC-chromatin region’, and clusters 9 and 11 show a peculiar combination of ‘silencing’ and ‘active’ factors, and cluster 12 has both PC and HP1 silencing marks. We decreased the between-cluster distance threshold <50% and obtained smaller clusters (Supplementary Figure S10). After cluster merging the CCR was high (>75%) and largely independent of the distance threshold (Supplementary Figure S13).
Figure 5.
chroGPSgenes map of S2 cells. The map was generated using Tanimoto distances and BoostMDS for representation. (A) Analysis of the map based on hierarchical clustering with average linkage. Clusters corresponding to 50% between-cluster distance before (left) and after unsupervised merging (center). On the right, the average log2 gene expression level is indicated. For each cluster, the 75% density contour is shown. The number of elements in each cluster is indicated. (B) The epigenetic profiles of the 12 merged clusters in Figure 5A (center) are presented. For each cluster, the log2 enrichment/depletion ratio of each factor with respect to its average distribution in the whole map are indicated. See also Supplementary Video S2 for visualization of the 3D-map in motion (Supplementary Section S10.1).
The chroGPSgenes map can be used as the canvas to paint other ‘omics’ information, delivering a global picture of the biological scenarios. As an illustration, Figure 5A (right) shows gene expression and Supplementary Figure S15 the distribution of certain epigenetic factors. Highly expressed genes concentrate in clusters 1–2, lowly expressed in clusters 3–9, while clusters 10–12 show a wider expression range. In good agreement, genes bound by RNApol II and marked with ‘active’ histone modifications (H3K4me3 and H3K36me3) concentrate in clusters 1 and 2, while silenced clusters 3–9 are generally enriched in ‘repressive’ factors [HP1a/Su(var)3–9 and PC/EZ] and clusters 10, 11 and 12 appears to correspond to intermediate states, as they contain both ‘active’ and ‘repressive’ marks (see Supplementary Section S9 and Supplementary Figure S15 for details).
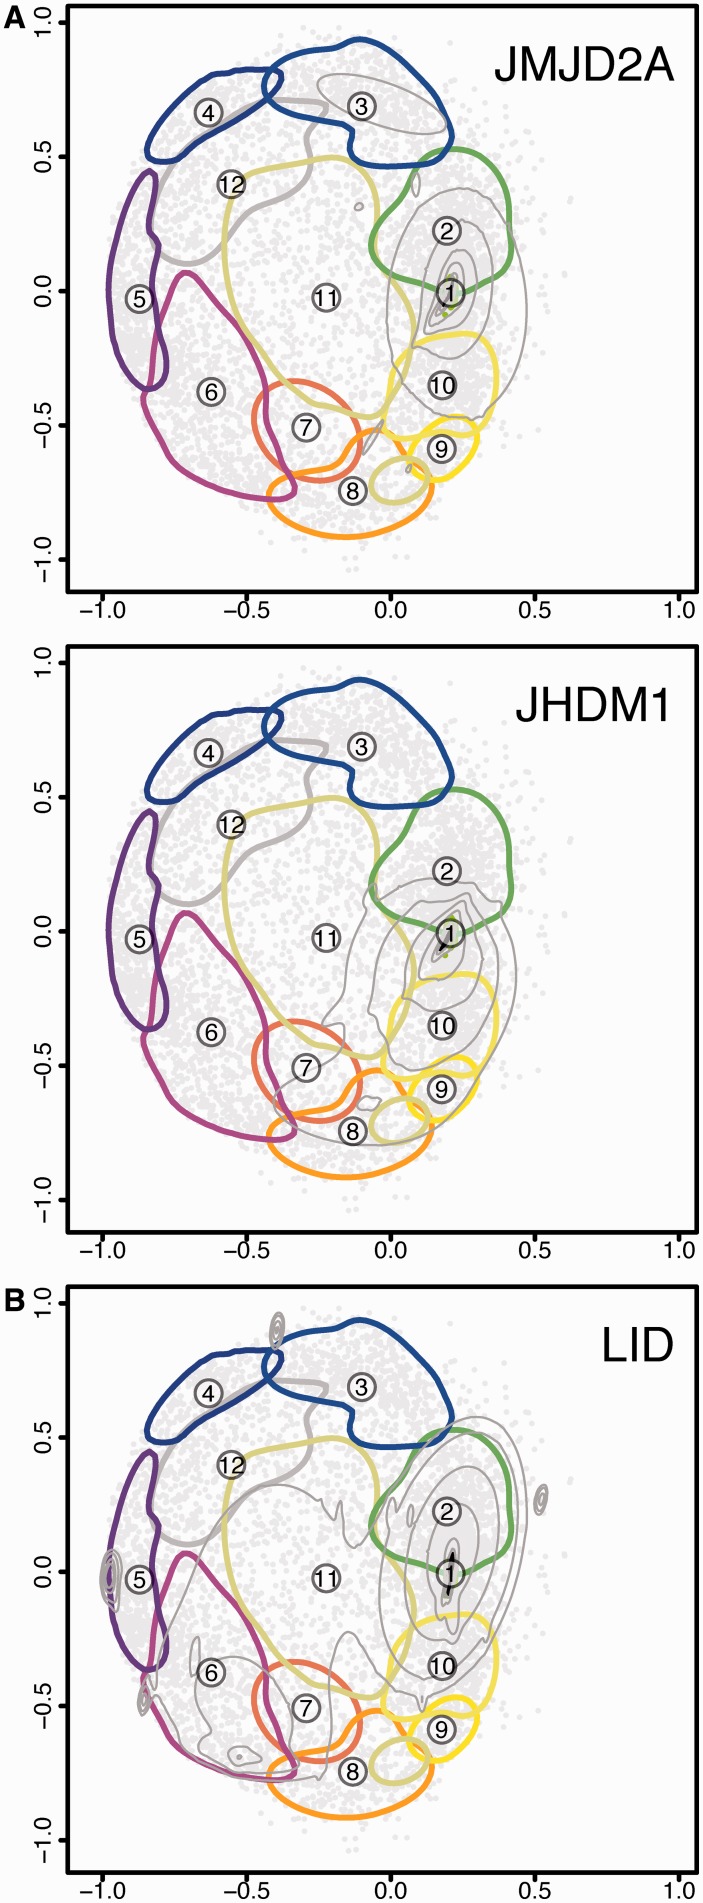
chroGPSgenes complements the information provided by chroGPSfactors on the function of novel epigenetic factors, facilitating interpretation of the biological context of their action. Figure 6A shows contours for genes bound by JMJD2A and JHDM1 (16,17,20). These two histone demethylases target H3K36me3 (an ‘active’ mark) and were anticipated to act as repressive factors. Opposite to this hypothesis, they map to cluster 1, suggesting that they regulate H3K36me3 in active genes, likely during transcription elongation.
Figure 6.
Using chroGPSgenes maps to analyze novel epigenetic factors of unknown function. (A) The distribution of JMJD2A (top) and JHDM1 (bottom) are shown on the 12-cluster configuration of the S2 chroGPSgenes map. (B) The distribution of genes bound by dKDM5/LID in the wing imaginal disc is shown on the 12-cluster configuration of the S2 chroGPSgenes map. For each factor, concentric density contours (from 10% to 95%) are presented. For each cluster, the 75% density contour is shown.
Although chroGPSgenes maps are cell-type specific, they can also provide useful information for data generated in a different cell-type. For instance, genes bound by dKDM5/LID in the wing imaginal discs are active (18) and they mostly locate in the active cluster 1 in the S2 map (Figure 6B), indicating that they maintain the active state in S2. However, some of them are also distributed across other clusters, which likely represent genes that are bound by dKDM5/LID and active in the wing disc but are repressed, or less active, in S2 cells. Interestingly, this set of genes mostly concentrates in the PC-clusters 5 and 6, suggesting that dKDM5/LID-target genes tend to be repressed by PC.
chroGPSgenes allows epigenetic analysis of complex biological networks
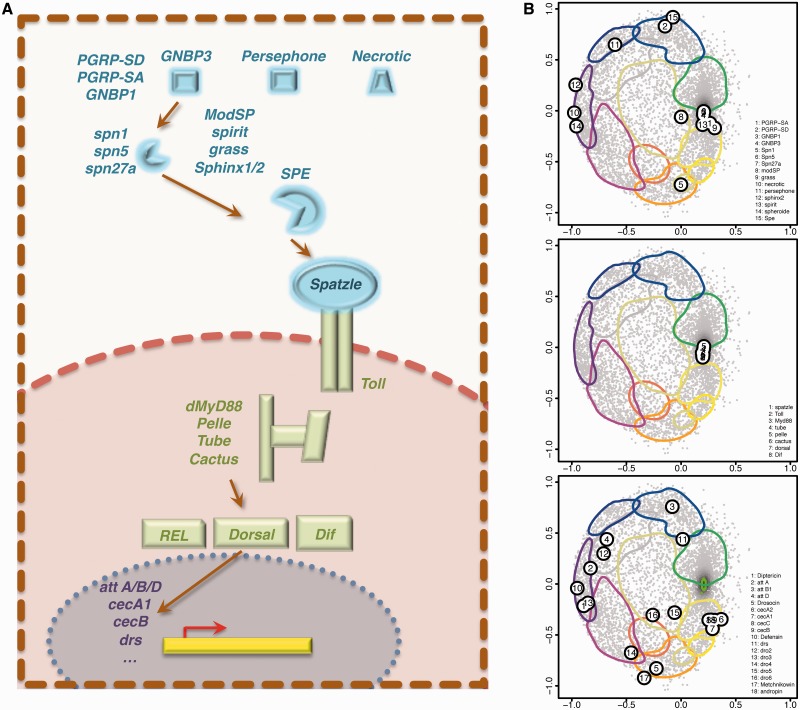
Locating genes involved in Toll signaling in the map provides an integrated view of the network’s epigenetic state. We consider 15 genes involved in the extracellular Toll cascade, whose expression would eventually change depending of the cell type and developmental stage. Figure 7B (top) evidences their complex and diverse epigenetic regulation, since seven lie in the active chromatin clusters 1–2, three locate at PC-chromatin cluster 5, three at the HP1-chromatin clusters 3–4 and two in the interphase between clusters 11, 8 and 10. Importantly, this analysis provides additional information beyond the experimental data on the factors binding each gene. For instance, only a few epigenetic factors have been experimentally found to bind the three genes lying at cluster 5 (necrotic, spheroide and sphinx2). For necrotic only H3K27me3 has been detected, for sphinx2 Su(Hw) and for spheroide both H3K27me3 and Su(Hw). The algorithm maps these three genes in cluster 5 which is not only enriched in H3K27me3 and Su(Hw), but also in PC and MOD2. These findings are interesting in that, despite the little factor binding information for the three genes, they suggest testable hypotheses.
Figure 7.
Using chroGPSgenes maps for the epigenetic analysis of the Toll innate immune pathway. (A) Schematic overview of the pathway. (B) Extracellular (top), intracellular (center) and nuclear-target (bottom) genes of the pathway are highlighted on the 12-cluster configuration of the S2 chroGPSgenes map.
Genes of the intracellular signaling cascade, known to be ubiquitously expressed, concentrate at the active chromatin cluster 1 characterized by high expression and multiple epigenetic factors (Figure 7B, center). Finally, Toll immunity pathway target genes show a complex pattern (Figure 7B, bottom). None map to the active chromatin cluster 1, in agreement with the expected weak engagement of Toll pathway in ideal cell-culture conditions. Interestingly, several target genes lie in the interphase between clusters 9 and 10, which corresponds to an intermediate epigenetic state sharing marks of both active and repressed chromatin.
DISCUSSION
Large efforts are currently devoted to describing the epigenome (21–30). The development of tools to integrate, analyze and visualize large amounts of epigenetic and genetic data is a priority in the field. In particular, hidden Markov models have been used to describe and characterize epigenetic states in chromatin (24,31). While these approaches are useful, they only focus on combinations of epigenetic factors and setups where all data are of the same kind and no systematic biases are present. An approach based on self-organizing maps, again aimed at portraying associations between epigenetic factors based on single-type data, has also been proposed (8). Instead, chroGPS is the first dimensionality reduction technique specifically designed to explore combinations of multiple data types, accounting for systematic biases and can focus both on genetic elements and epigenetic factors. Our main contribution is enabling the integration and interpretation of massive heterogeneous epigenetic data in a visually appealing and context-rich manner. We assessed the adequacy of multiple distance metrics, provided algorithms to represent a large number of objects at high resolution and a computational effort manageable by a desktop computer, and strategies to annotate the maps in order to enhance their interpretability.
chroGPS maps proved useful in a variety of situations, such as understanding functional interplays between epigenetic factors in Drosophila, assess conservation across S2 and BG3 cells, deriving testable hypotheses for novel factors, studying chromatin states at genes and the epigenetic regulation of complex pathways. While these examples illustrate the broad potential, we envision further possible uses. For instance, chroGPS maps that consider only overlaps at specific locations (e.g. promoters, exons, origins of replication, transposons, selected gene-sets, etc.) would inform about epigenetic states and functional interactions occurring at the investigated elements. In addition, integrating Hi-C data would provide direct information about the relative position of the analyzed elements. Another interesting venue is to generate maps for a particular developmental process or disease, as these would portray genetic/epigenetic changes in the analyzed conditions. For instance, comparing chroGPSgenes maps from normal and affected cells in a given disease condition (i.e. neurons in Rett syndrome) could identify which genes are changing epigenetic status and in what direction(s). Similarly, a joint chroGPSfactors plot containing data from normal and disease status could identify altered interactions between epigenetic factors (i.e. MeCP2 in Rett syndrome), at the whole-genome level or in specific genomic regions.
Overall, chroGPS maps should prove a valuable approach to explore these complex questions by combining large amounts of data, serving as a hypothesis generating tool and the starting point for further in-depth analyses.
SUPPLEMENTARY DATA
Supplementary Data are available at NAR Online.
FUNDING
The Spanish ‘Ministerio de Economia y Competitividad’ [CSD2006-49, BFU2009-07111 and BFU2012-30724] and the ‘Generalitat de Catalunya’ [SGR2009-1023]; This work was carried out within the framework of the ‘Centre de Referència en Biotecnologia’ of the ‘Generalitat de Catalunya’. Funding for open access charge: Spanish ‘Ministerio de Economia y Competitividad’ [BFU2012-30724].
Conflict of interest statement. None declared.
Supplementary Material
ACKNOWLEDGEMENTS
The authors are thankful to Dr J. Graffelman for useful comments.
REFERENCES
- 1.Lange M, Demajo S, Jain P, Di Croce L. Combinatorial assembly and function of chromatin regulatory complexes. Epigenomics. 2011;3:567–580. doi: 10.2217/epi.11.83. [DOI] [PubMed] [Google Scholar]
- 2.Lee JT. Epigenetic regulation by long noncoding RNAs. Science. 2012;338:1435–1439. doi: 10.1126/science.1231776. [DOI] [PubMed] [Google Scholar]
- 3.Musselman CA, Lalonde ME, Côté J, Kutateladze TG. Perceiving the epigenetic landscape through histone readers. Nat. Struct. Mol. Biol. 2012;19:1218–1227. doi: 10.1038/nsmb.2436. [DOI] [PMC free article] [PubMed] [Google Scholar]
- 4.Karnik R, Meissner A. Browsing (Epi)genomes: a guide to data resources and epigenome browsers for stem cell researchers. Cell Stem Cell. 2013;13:14–21. doi: 10.1016/j.stem.2013.06.006. [DOI] [PMC free article] [PubMed] [Google Scholar]
- 5.Boulesteix A-L, Strimmer K. Partial least squares: a versatile tool for the analysis of high-dimensional data. Brief. Bioinform. 2007;8:32–44. doi: 10.1093/bib/bbl016. [DOI] [PubMed] [Google Scholar]
- 6.Miclaus K, Wolfinger R, Czika W. SNP selection and multidimensional scaling to quantify population structure. Genet. Epidemiol. 2009;33:488–496. doi: 10.1002/gepi.20401. [DOI] [PubMed] [Google Scholar]
- 7.Motsinger AA, Ritchie MD. Multifactor dimensionality reduction: an analysis strategy for modeling and detecting gene-gene interaction in human genetics and pharmacogenomics studies. Hum. Genom. 2006;2:318–328. doi: 10.1186/1479-7364-2-5-318. [DOI] [PMC free article] [PubMed] [Google Scholar]
- 8.Steiner L, Hopp L, Wirth H, Galle J, Binder H, Prohaska SJ, Rohlf T. A global genome segmentation method for exploration of epigenetic patterns. PLoS One. 2012;7:e46811. doi: 10.1371/journal.pone.0046811. [DOI] [PMC free article] [PubMed] [Google Scholar]
- 9.van de Wiel MA, van Wieringen WN. CGHregions: dimension reduction for array CGH data with minimal information loss. Cancer Inform. 2007;3:55–63. [PMC free article] [PubMed] [Google Scholar]
- 10.Celniker SE, Dillon LA, Gerstein MB, Gunsalus KC, Henikoff S, Karpen GH, Kellis M, Lai EC, Lieb JD, MacAlpine DM, et al. Unlocking the secrets of the genome. Nature. 2009;459:927–930. doi: 10.1038/459927a. [DOI] [PMC free article] [PubMed] [Google Scholar]
- 11.Gentleman RC, Carey VJ, Bates DM, Bolstad B, Dettling M, Dudoit S, Ellis B, Gautier L, Ge Y, Gentry J, et al. Bioconductor: open software development for computational biology and bioinformatics. Genome Biol. 2004;5:R80. doi: 10.1186/gb-2004-5-10-r80. [DOI] [PMC free article] [PubMed] [Google Scholar]
- 12.Smoot ME, Ono K, Ruscheinski J, Wang PL, Ideker T. Cytoscape 2.8: new features for data integration and network visualization. Bioinformatics. 2011;27:431–432. doi: 10.1093/bioinformatics/btq675. [DOI] [PMC free article] [PubMed] [Google Scholar]
- 13.Torgerson WSP. Multi-dimensional scaling: I, theory and method. Psychometrika. 1952;17:401–419. [Google Scholar]
- 14. Venables, W.N. and Ripley, B.D. (2002) Modern applied statistics with S, 4th edn. Springer, New York, ISBN 0387954570.
- 15.Gan Q, Schones DE, Ho Eun S, Wei G, Cui K, Zhao K, Chen X. Monovalent and unpoised status of most genes in undifferentiated cell-enriched Drosophila testis. Genome Biol. 2010;11:R42. doi: 10.1186/gb-2010-11-4-r42. [DOI] [PMC free article] [PubMed] [Google Scholar]
- 16.Lin CH, Li B, Swanson S, Zhang Y, Florens L, Washburn MP, Abmayr SM, Workman JL. Heterochromatin protein 1a stimulates histone H3 lysine 36 demethylation by the Drosophila KDM4A demethylase. Mol. Cell. 2008;32:696–706. doi: 10.1016/j.molcel.2008.11.008. [DOI] [PMC free article] [PubMed] [Google Scholar]
- 17.Lloret-Llinares M, Carré C, Vaquero A, de Olano N, Azorín F. Characterisation of Drosophila melanogaster JmjC + N histone demethylases. Nucleic Acids Res. 2008;36:2852–2863. doi: 10.1093/nar/gkn098. [DOI] [PMC free article] [PubMed] [Google Scholar]
- 18.Lloret-Llinares M, Pérez-Lluch S, Rossell D, Morán T, Ponsa-Cobas J, Auer H, Corominas M, Azorín F. dKDM5/LID regulates H3K4me3 dynamics at the transcription-start site (TSS) of actively transcribed developmental genes. Nucleic Acids Res. 2012;40:9493–9505. doi: 10.1093/nar/gks773. [DOI] [PMC free article] [PubMed] [Google Scholar]
- 19.Pérez-Lluch S, Blanco E, Carbonell A, Raha D, Snyder M, Serras F, Corominas M. Genome-wide chromatin occupancy analysis reveals a role for ASH2 in transcriptional pausing. Nucleic Acids Res. 2011;39:4628–4639. doi: 10.1093/nar/gkq1322. [DOI] [PMC free article] [PubMed] [Google Scholar]
- 20.Pedersen MT, Helin K. Histone demethylases in development and disease. Trends Cell Biol. 2010;20:662–671. doi: 10.1016/j.tcb.2010.08.011. [DOI] [PubMed] [Google Scholar]
- 21.Dunham I, Kundaje A, Aldred SF, Collins PJ, Davis CA, Doyle F, Epstein CB, Frietze S, Harrow J, Kaul R, et al. An integrated encyclopedia of DNA elements in the human genome. Nature. 2012;489:57–74. doi: 10.1038/nature11247. [DOI] [PMC free article] [PubMed] [Google Scholar]
- 22.Ernst J, Kellis M. Discovery and characterization of chromatin states for systematic annotation of the human genome. Nat. Biotechnol. 2010;28:817–825. doi: 10.1038/nbt.1662. [DOI] [PMC free article] [PubMed] [Google Scholar]
- 23.Ernst J, Kheradpour P, Mikkelsen TS, Shoresh N, Ward LD, Epstein CB, Zhang X, Wang L, Issner R, Coyne M, et al. Mapping and analysis of chromatin state dynamics in nine human cell types. Nature. 2011;473:43–49. doi: 10.1038/nature09906. [DOI] [PMC free article] [PubMed] [Google Scholar]
- 24.Filion GJ, van Bemmel JG, Braunschweig U, Talhout W, Kind J, Ward LD, Brugman W, de Castro IJ, Kerkhoven RM, Bussemaker HJ, et al. Systematic protein location mapping reveals five principal chromatin types in Drosophila cells. Cell. 2010;143:212–214. doi: 10.1016/j.cell.2010.09.009. [DOI] [PMC free article] [PubMed] [Google Scholar]
- 25.Gerstein MB, Lu ZJ, Van Nostrand EL, Cheng C, Arshinoff BI, Liu T, Yip KY, Robilotto R, Rechtsteiner A, Ikegami K, et al. Integrative analysis of the Caenorhabditis elegans genome by the modENCODE project. Science. 2011;330:1775–1787. doi: 10.1126/science.1196914. [DOI] [PMC free article] [PubMed] [Google Scholar]
- 26.Kharchenko PV, Alekseyenko AA, Schwartz YB, Minoda A, Riddle NC, Ernst J, Sabo PJ, Larschan E, Gorchakov AA, Gu T, et al. Comprehensive analysis of the chromatin landscape in Drosophila melanogaster. Nature. 2011;471:480–485. doi: 10.1038/nature09725. [DOI] [PMC free article] [PubMed] [Google Scholar]
- 27.Liu T, Rechtsteiner A, Egelhofer TA, Vielle A, Latorre I, Cheung MS, Ercan S, Ikegami K, Jensen M, Kolasinska-Zwierz P, et al. Broad chromosomal domains of histone modification patterns in C. elegans. Genome Res. 2011;21:227–236. doi: 10.1101/gr.115519.110. [DOI] [PMC free article] [PubMed] [Google Scholar]
- 28.Roudier F, Ahmed I, Bérard C, Sarazin A, Mary-Huard T, Cortijo S, Bouyer D, Caillieux E, Duvernois-Berthet E, Al-Shikhley L, et al. Integrative epigenomic mapping defines four main chromatin states in Arabidopsis. EMBO J. 2011;30:1928–1938. doi: 10.1038/emboj.2011.103. [DOI] [PMC free article] [PubMed] [Google Scholar]
- 29.Roy S, Ernst J, Kharchenko PV, Kheradpour P, Negre N, Eaton ML, Landolin JM, Bristow CA, Ma L, Lin MF, et al. Identification of functional elements and regulatory circuits by Drosophila modENCODE. Science. 2010;330:1787–1797. doi: 10.1126/science.1198374. [DOI] [PMC free article] [PubMed] [Google Scholar]
- 30.van Bemmel J, Filion G, Rosado A, Talhout W, de Haas M, van Welsem T, van Leeuwen F, van Steensel B. A network model of the molecular organization of chromatin in Drosophila. Mol. Cell. 2013;49:759–771. doi: 10.1016/j.molcel.2013.01.040. [DOI] [PubMed] [Google Scholar]
- 31.Ernst J, Kellis M. ChromHMM: automatic chromatin-state discovery and characterization. Nat. Methods. 2012;9:215–216. doi: 10.1038/nmeth.1906. [DOI] [PMC free article] [PubMed] [Google Scholar]
Associated Data
This section collects any data citations, data availability statements, or supplementary materials included in this article.


