

The mammalian target of rapamycin (mTOR) promotes mRNA translation, cell growth, and proliferation. In a quantitative proteomic screen, Tcherkezian et al. identify proteins that associate with the mRNA 5′ cap in an mTOR-dependent manner. The authors show that the putative RNA-binding protein LARP1 stimulates the translation of mRNAs containing a 5′ terminal oligopyrimidine (TOP) motif. LARP1 associates with the mTOR complex 1 and is required for global protein synthesis. The data reveal new mechanisms of 5′TOP mRNA translation and implicate LARP1 as a key cell growth regulator.
Keywords: mTOR, mRNA, translation, LARP1, 5′TOP, proteomics
Abstract
The mammalian target of rapamycin (mTOR) promotes cell growth and proliferation by promoting mRNA translation and increasing the protein synthetic capacity of the cell. Although mTOR globally promotes translation by regulating the mRNA 5′ cap-binding protein eIF4E (eukaryotic initiation factor 4E), it also preferentially regulates the translation of certain classes of mRNA via unclear mechanisms. To help fill this gap in knowledge, we performed a quantitative proteomic screen to identify proteins that associate with the mRNA 5′ cap in an mTOR-dependent manner. Using this approach, we identified many potential regulatory factors, including the putative RNA-binding protein LARP1 (La-related protein 1). Our results indicate that LARP1 associates with actively translating ribosomes via PABP and that LARP1 stimulates the translation of mRNAs containing a 5′ terminal oligopyrimidine (TOP) motif, encoding for components of the translational machinery. We found that LARP1 associates with the mTOR complex 1 (mTORC1) and is required for global protein synthesis as well as cell growth and proliferation. Together, these data reveal important molecular mechanisms involved in TOP mRNA translation and implicate LARP1 as an important regulator of cell growth and proliferation.
The determination of cell size in multicellular organisms is achieved by the coordinated action of cell growth and cell cycle progression. The evolutionarily conserved Ser/Thr kinase mammalian target of rapamycin (mTOR) integrates both intracellular and extracellular signals to regulate cell growth and proliferation (Polak and Hall 2009; Laplante and Sabatini 2012). The mTOR kinase is the catalytic component of two distinct multiprotein complexes: mTOR complex 1 (mTORC1; comprised of mTOR, Raptor, mLST8, and PRAS40) and mTORC2 (comprised of mTOR, Rictor, mLST8 and mSIN1) (Jacinto 2008; Foster and Fingar 2010). When activated by growth signals, mTORC1 phosphorylates two well-characterized targets: the AGC family p70 ribosomal S6 kinases (S6K1 and S6K2) and the eukaryotic initiation factor 4E (eIF4E)-binding proteins 1 and 2 (4E-BP1/2) (Ma and Blenis 2009; Sengupta et al. 2010; Roux and Topisirovic 2012). While the S6Ks are implicated in the control of cell and organismal growth, the 4E-BPs regulate mRNA translation and have been shown to control cell proliferation (Dowling et al. 2010).
A key factor required for the translation of the vast majority of mRNAs is the eIF4F complex, which includes the mRNA 5′ cap-binding protein eIF4E, the RNA helicase eIF4A, and the modular scaffolding protein eIF4G that bridges the mRNA to the ribosome (Pestova et al. 1996; Sonenberg 2008). The 4E-BPs interact with eIF4E and thereby repress translation initiation by disrupting eIF4F complex formation (Pause et al. 1994). mTORC1 phosphorylates the 4E-BPs, leading to their dissociation from eIF4E and thus increasing the amount of eIF4E available to engage in eIF4F complex assembly. Although most cellular mRNAs require eIF4E to be translated, the eIF4F complex is thought to be especially important for the efficient translation of mRNAs that contain extensive secondary structure within their 5′ untranslated regions (5′ UTRs) (Koromilas et al. 1992). mTORC1 has also been implicated in the selective regulation of mRNAs with 5′ terminal oligopyrimidine (TOP) tracts (Jefferies et al. 1994), which encode for ribosomal proteins and several components of the translation machinery (Avni et al. 1997; Meyuhas 2000). Recent studies using high-resolution transcriptome-scale ribosome profiling have confirmed that the translation of 5′TOP mRNAs is highly sensitive to mTORC1 inhibitors (Hsieh et al. 2012; Thoreen et al. 2012), but the mechanism by which this occurs still remains unclear.
Translational control of 5′TOP mRNAs relies at least in part on the regulation of eIF4E by the 4E-BPs (Hsieh et al. 2012; Thoreen et al. 2012). While required, suppression of 4E-BP1/2 function is unlikely to be sufficient to drive 5′TOP mRNA translation, as eIF4E overexpression is itself insufficient to promote the translation of 5′TOP mRNAs (Shama et al. 1995). These findings suggest the existence of additional regulatory factors that would directly interact with the TOP sequence and/or regulate 5′TOP mRNA translation (Gentilella and Thomas 2012). Several candidates have been proposed over the years, including the abundant La antigen (also known as LARP3 [La-related protein 3]) (Pellizzoni et al. 1996; Crosio et al. 2000; Cardinali et al. 2003), AUF1 (Kakegawa et al. 2007), TIA-1 (Damgaard and Lykke-Andersen 2011), and LARP7 (Markert et al. 2008), but definitive evidence for the regulatory roles of these proteins in 5′TOP mRNA translation is lacking.
To better understand how mTOR regulates both global and specific mRNA translation, we performed a quantitative proteomic screen to identify proteins that associate with the mRNA 5′ cap in an mTOR-dependent manner. Using this method, we identified several candidate proteins and validated their regulated association to the mRNA 5′ cap using complementary approaches. Among these we found the putative RNA-binding protein LARP1 and provided evidence supporting an important role for this protein in 5′TOP mRNA translation. Together, our results provide important insights into the regulation of 5′TOP mRNA translation and suggest the involvement of many more uncharacterized proteins in mRNA translation.
Results
Global quantitative assessment of proteins that associate with the mRNA 5′ cap
In an attempt to identify protein components that could potentially bridge mTOR activity with the translation of specific subsets of mRNAs, we used Sepharose beads coupled to 7-methylguanosine (m7GTP), which mimics the mRNA 5′ cap structure. This approach has been widely used to purify and monitor assembly of the eIF4F complex (Sonenberg et al. 1978) but was surprisingly never combined with high-resolution mass spectrometry to globally identify and quantify factors that associate with the mRNA 5′ cap. We therefore elaborated a method based on m7GTP affinity chromatography to enrich in cap-binding proteins, such as eIF4E, as well as associated factors, followed by specific elution using excess free m7GTP (Fig. 1A). To identify and quantify purified components, we used an unbiased quantitative approach where LysC-digested peptides were labeled with 6-plex isobaric mass tags (TMT6) and subjected to liquid chromatography-tandem mass spectrometry analysis (LC-MS/MS) (Fig. 1B).
Figure 1.

Global quantitative assessment of proteins that associate with the mRNA 5′ cap. (A) Enrichment of eIF4E (immunoblot in the bottom panel) and associated factors after specific elution with m7GTP (Coomassie gel; fifth lane). (B) Schematic diagram of the multiplex work flow developed for identification and quantitation of the 5′ cap-binding complex by combining m7GTP pull-down and TMT6 labeling in the presence or absence of RNase/Benzonase for 30 or 60 min. (C) Distribution of ∼160 proteins found to be associated to the 5′ cap-binding complex. The RNase dependence ratios (treated/untreated) are plotted on a log2 scale, normalized with respect to eIF4E abundance. Proteins with a log2 ratio ≤1.3 (PABPC1 threshold), such as DDX1, NONO, and IGF2BP3, were considered RNA-dependent. (D) List of the most abundant associated proteins ranked according to the numbers of peptides identified. Gray shading indicates proteins previously shown to interact directly with eIF4E (purple). Accession numbers are from the International Protein Index (IPI). (E) Classification of RNA-insensitive candidates according to cellular and molecular functions or canonical signaling pathways using the DAVID bioinformatics database (http://david.abcc.ncifcrf.gov) or the Ingenuity Pathway Analysis platform (IPA; http://www.ingenuity.com) according to adjusted P-value. The gray line indicates minimum threshold (P = 0.05).
As a first step, we sought to determine the proportion of binding proteins that could be purified based on potentially nonspecific RNA-dependent interactions. To do so, we performed m7GTP affinity chromatography and incubated precipitates with nucleases (RNase A/Benzonase) prior to elution with m7GTP, TMT6 labeling, and LC-MS/MS analysis (Fig. 1B). In total, we identified ∼160 proteins, among which approximately one-third showed significant decreased association to the m7GTP beads following nuclease treatment (Fig. 1C; Supplemental Table 1). Among proteins unaffected by nuclease treatment, we identified eIF4E and many known direct and indirect eIF4E-binding proteins, including eIF4G1/3, 4E-T, and 4E-BP1/2 (Fig. 1D). We also identified the eIF4G-binding protein PABP, which was chosen to set the minimum threshold for protein–protein interactions because of its ability to also directly interact with mRNAs (Fig. 1C). Among proteins previously shown to be involved in mRNA translation, we identified ATAXIN-2, an RNA-binding protein with prominent roles in the nervous system that was recently shown to associate with eIF4F and PABP (Zhang et al. 2013). Importantly, we identified several additional proteins that were never previously shown to associate directly or indirectly with the mRNA 5′ cap (Fig. 1D; Supplemental Table 1). Classifying this restricted list of proteins according to molecular and cellular functions using the Ingenuity Pathway Analysis platform (IPA; http://www.ingenuity.com) revealed that most proteins detected participated in mRNA translation (P < 1 × 10−45) and were involved in expected pathways, such as “mTOR signaling” (P < 1 × 10⁻¹⁸) (Fig. 1E). Finally, we used the Search Tool for the Retrieval of Interacting Genes (STRING) database to generate an interaction network based on experimentally validated interactions between identified proteins. This analysis revealed a tight interaction network with several nodes characterized by functional complexes, such as three major clusters for mRNA metabolism and translation (Supplemental Fig. 1). Pfam domain enrichment revealed a large number of proteins containing RNA recognition motif (P < 2 × 10⁻¹⁹). Taken together, these data provide an extensive list of candidate proteins that may participate in translational control.
The mRNA 5′ cap-binding complex is principally regulated by mTOR signaling and the 4E-BPs
Having globally identified proteins that associate with the mRNA 5′ cap, we next assessed whether their association was regulated by mTOR agonists and antagonists. To do so, we treated serum-growing HEK293 cells with PI-103, a dual mTOR/PI3K inhibitor, to robustly abrogate mTOR activation and downstream signaling (Fig. 2A). Conversely, we treated serum-starved cells with insulin to provide a more physiological paradigm of mTOR activation. Cell treatments were performed in triplicate, and all m7GTP pull-down assays were processed and TMT6 labeled individually prior to being pooled for LC-MS/MS analysis and quantification (Fig. 2A). In addition, these experiments were performed in the presence of nucleases to control for potentially nonspecific RNA-dependent interactions. Prior to assessing the global effect of mTOR activation, we first determined whether we could measure significant changes in components of the eIF4F complex. As expected, eIF4E association to m7GTP was not found to be modulated, whereas the association of eIF4G and eIF4A was strongly regulated by PI-103 and insulin treatments, as revealed by both Western blotting (Fig. 2B) and TMT6-based quantifications (Fig. 2C; Tables 1, 2). Because this method allowed for the simultaneous quantification of many peptides per protein, the changes induced by both cell treatments were found to be highly significant (P < 1 × 10⁻¹² and P < 1 × 10⁻²⁹ for eIF4G and eIF4A, respectively). We also analyzed the recruitment of the 4E-BPs, which are direct targets of mTORC1 (Pause et al. 1994). As expected, the association of 4E-BP1/2 was found to be inversely correlated with that of eIF4G and eIF4A (Fig. 2B,C). To determine the contribution of the 4E-BPs in regulating the eIF4F complex, we repeated similar proteomic experiments in wild-type and 4E-BP1/2 double-knockout (DKO) mouse embryonic fibroblasts (MEFs). Consistent with previous reports (Dowling et al. 2010; Thoreen et al. 2012), we found that the eIF4F complex was constitutively bound to m7GTP in the absence of 4E-BPs (Fig. 2D,E), confirming that the 4E-BPs are required for the regulated assembly of the eIF4F complex. In addition to validating our quantitative approach, these results indicated that 4E-BP1/2-deficient cells provided a useful system to globally determine whether the proteins that we identified in our proteomic approach required eIF4E for associating to mRNA 5′ cap.
Figure 2.

mTOR-dependent regulation of the 5′ cap-binding complex. (A) Schematic diagram of the multiplex work flow strategy for the identification and quantitation of mTOR-regulated components. Cell treatments were performed in triplicate, and all m7GTP pull-down assays were processed and TMT6 labeled individually prior to being pooled for LC-MS/MS analysis and quantification. These experiments were also performed in the presence of RNase. (B) Effects of mTOR activity on eIF4F complex assembly using mTOR agonists and antagonists. Treatment of serum-growing cells with the dual mTOR/PI3K inhibitor PI-103 (1 μM) caused dissociation of eIF4G and eIF4A with an increased association of 4E-BP1 (second lane, top left panels), while insulin treatment (100 nM) for 30 min had an opposite effect (fourth lane, top right panels). The bottom panels show loading controls and treatment effects (4E-BPs phosphorylation shifts). (C) Bar graphs of TMT6-based quantifications for the same conditions. (***) P < 0.0001 using two-way ANOVAs. (ns) Nonsignificant. (D) Similar effects were seen in wild-type MEFs, but complete loss of regulation was observed in 4E-BP1/2 DKO cells. (E) Bar graphs of TMT values from DKO cells also showing a loss of regulation.
Table 1.
Insulin-regulated candidate proteins identified in the proteomic screen

Table 2.
PI-103-regulated candidate proteins identified in the proteomic screen
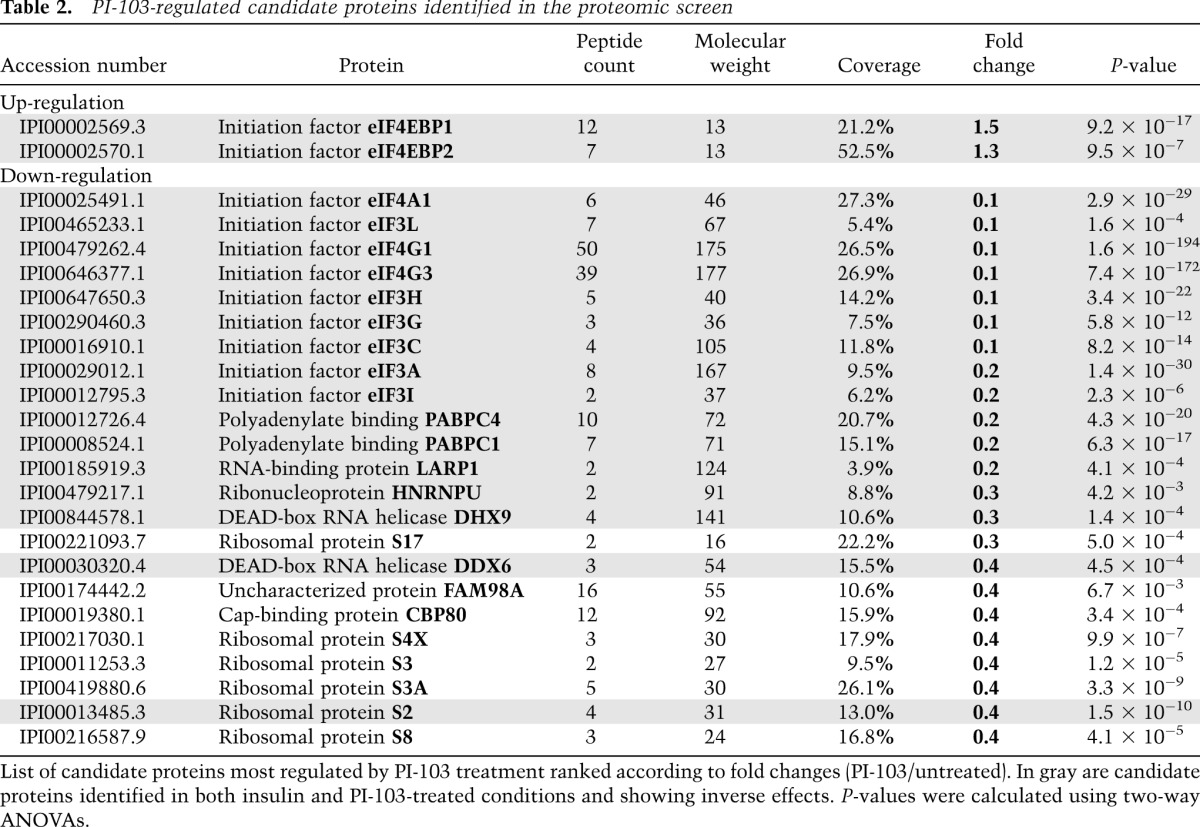
Next, we analyzed the impact of mTOR activation on all purified components of the 5′ cap-binding complex. Interestingly, we found that the relative abundance of approximately half of all identified proteins was increased by insulin stimulation (Fig. 3A), with the most prominent effects seen with PABP (∼7.5-fold), eIF4A1/2 (∼5.5-fold), eIF3 isoforms (approximately fourfold), and eIF4G1/3 (∼3.5-fold) (Table 1; Supplemental Table 2). Notably, the 4E-BPs were the only two proteins found to be less abundant in response to insulin (∼0.3-fold, P < 7.8 × 10−47 for 4E-BP1). We also analyzed the relative abundance of identified proteins in response to PI-103 treatment and found that about half displayed decreased association (Fig. 3A), with the most prominent effects seen with eIF4A1 (∼0.1-fold), eIF3 isoforms (∼0.1-fold), eIF4G1/3 (∼0.1-fold), and PABP (∼0.2-fold) (Table 2; Supplemental Table 3). Again, the 4E-BPs were the only two proteins found to be more abundant in response to PI-103 treatment (∼1.5-fold, P < 9.2 × 10⁻¹⁷ for 4E-BP1). To determine whether eIF4E was required for the recruitment of other identified proteins, we compared data obtained from wild-type and 4E-BP1/2 DKO cells treated with insulin or PI-103 (Fig. 3A). As with the eIF4F complex (Fig. 2), we found that 4E-BP1/2 were required for the regulated recruitment of all identified proteins (Fig. 3A). These results were important because they indicated that the 4E-BPs were the main mTOR effectors involved in regulating the assembly of the 5′ cap-binding complex. We used this information to apply a threshold over which changes in interaction in wild-type cells were considered significant (Fig. 3A, see area in red). Notably, we found that the majority of insulin-regulated proteins were also inversely regulated by PI-103 treatment (R2 = 0.6186) (Fig. 3B). Among these, we found several mTOR-regulated proteins that are expected to interact directly or indirectly with eIF4E, such as 4E-T, eIF3A, and DDX3 (Fig. 3C; Supplemental Table 4). In addition, we found several novel interacting proteins, such as LARP1, DDX6, hnRNPU, FAM98A, HSPA5, and DHX9 (Fig. 3D; Supplemental Table 4). Western blot analysis of candidate proteins in wild-type cells revealed mTOR-regulated binding in all cases (Fig. 3E), while no regulation was observed in cells lacking 4E-BP1/2 (Supplemental Fig. 2). Together, these results underscore the potential role of many candidate proteins in mRNA translation, such as the putative RNA-binding protein LARP1.
Figure 3.

Identification of novel components of the 5′ cap-binding complex. (A) Plot highlighting the 5′ cap association ratios in response to PI-103 (PI-103/DMSO; red squares) and insulin treatment (insulin/untreated; blue squares). Distributions obtained with 4E-BP1/2 DKO cells show loss of mTOR regulation (red shading) and were used to set minimum threshold for wild-type cells (gray shading). Proteins with a log2 PI-103/DMSO ratio ≥0.7 and insulin/untreated ratio ≤0.7, such as FAM98A, hnRNPU, DDX6, LARP1, ILF2, eIF4G1, eIF4A, eIF3L, and PABPC1, were considered mTOR-regulated. Only 4E-BP1/2 showed opposite mTOR-dependent regulation. (B) Scattered plot distribution showing that a majority of insulin-regulated proteins were also inversely regulated by PI-103 (R2 = 0.6186). (C,D) Bar graphs of TMT values from work flow above depicting expected eIF4F-associated proteins, including 4E-T, DDX3, and eIF3A (C), and novel eIF4F-associated proteins, including LARP1, DDX6, hnRNPU, FAM98A, DHX9, and HSPA5 (D). (*) P < 0.01 using two-way ANOVAs. (E) Several candidate proteins were also validated by immunoblotting, and all were confirmed to have mTOR-regulated association to the mRNA 5′ cap.
mTOR regulates LARP1 association to polysomes via PABP
LARP1 is a widely conserved and ubiquitously expressed member of the La-related family of proteins (Bayfield et al. 2010). Although it is more generally divergent from genuine La proteins than other members, it nevertheless contains two closely related RNA-binding domains known as La motif (LAM) and an adjacent RNA recognition motif-like domain (RRM-L). Consistent with these structural features, LARP1 has been found to play a role in mRNA metabolism in diverse species (Chauvet et al. 2000; Nykamp et al. 2008; Blagden et al. 2009; Burrows et al. 2010), but its mode of action remains elusive. To determine whether LARP1 associates with actively translating ribosomes (polysomes), we performed sucrose gradient velocity sedimentation of ribosomes using extracts from HEK293 cells. These experiments revealed that LARP1 efficiently cosedimented with prepolysomal subunits (monosomes and ribosomal subunits) but also with polysomes (Fig. 4A), suggesting that LARP1 associates with mRNAs during the initial steps of translation and remains associated to actively translating polyribosomes. To determine whether mTOR regulates LARP1 association to ribosomes, we treated serum-growing cells with the dual PI3K/mTOR inhibitor PI-103 to disrupt polysomes. Consistent with the observed mTOR-dependent association of LARP1 to the mRNA 5′ cap (Fig. 3), we found that mTOR inhibition resulted in an important shift in the distribution of LARP1 from polysomal to subpolysomal fractions (Fig. 4B). To further validate the specificity of this interaction, cells were treated with puromycin to inhibit protein synthesis by prematurely terminating peptide chains. Puromycin treatment strongly reduced polysome assembly and concomitantly shifted a substantial amount of LARP1 from polysomal to subpolysomal fractions (Supplemental Fig. 3A,B). While components of the eIF4F complex were, as expected, primarily associated with the 40S subunit (Tcherkezian et al. 2010), we found that the sedimentation of several ribosomal proteins was also dependent on mTOR activity, as shown for rpL5 and rpS6 (Fig. 4A,B). Interestingly, LARP1 and PABP showed very similar distributions, suggesting a possible interplay between these proteins.
Figure 4.

mTOR regulates LARP1 association to polysomes via PABP. (A) Ribosome sedimentation profiling from HEK293 cell extracts. LARP1 cosedimented with 40S, 60S, and 80S subpolysomal fractions as well as with polysomal fractions. Control proteins were distributed as expected from previous studies: S6 in 40S, 80S, and polysomal fractions; L5 in 60S, 80S, and polysomal fractions; eIF4F (eIF4E, eIF4A, and eIF4G) primarily in the 40S fractions; and PABP in all four fractions, as measured by immunoblotting. (B) Treatment of cells with 1 μM PI-103 for 1 h significantly decreased polysome assembly and concomitantly displaced polysome-associated components L5, S6, PABP, and LARP1 to subpolysomal fractions. (C–E) PABP coimmunoprecipitates with LARP1 independently of mTOR activation (100 nM insulin, 30 min) or inhibition (PI-103 and Ku-0063794 for 1 h). The bottom panels show loading and treatment controls by measuring S6 phosphorylation on Ser240/244. (F,G) LARP1 contains two putative RNA-binding domains (LAM and RRM) and a C-terminal stretch of DM15 (LARP1) motifs with unknown functions. Partial (ΔC150) and complete (ΔC300) LARP1 C-terminal deletion of the DM15 stretch drastically reduced association with PABP (G) and cap binding (H). (I,J) Sucrose gradient velocity sedimentation showing distribution of wild-type myc-LARP1 (I) in both subpolysomal and polysomal fractions, while the C-terminal mutant (ΔC150) (J) primarily cosedimented with subpolysomal fractions. (K) The bar graph shows densitometry analysis of the abundance of wild-type LARP1 and the ΔC150 mutant LARP1 in polysomal versus subpolysomal fractions.
In agreement with previous reports (Blagden et al. 2009; Burrows et al. 2010), we found that endogenous LARP1 coimmunoprecipitated with endogenous PABP irrespective of which protein was immunoprecipitated (Fig. 4C,D). Our results also indicate that the association between LARP1 and PABP was not affected by mTOR activity (Fig. 4C,E), as shown by cell treatments with insulin, PI-103, or a specific mTOR kinase inhibitor (Ku-0063794). These results suggested that LARP1 was likely recruited to the mRNA 5′ cap as well as polysomes because of its association to PABP. Thus, we next sought to identify the minimal region in LARP1 responsible for PABP binding by generating C-terminal deletion mutants (Fig. 4F). Notably, we found that a C-terminal mutant (LARP1Δ150) lacking a stretch of DM15 tandem repeats (also known as LARP1 domains) with unknown functions showed significant decreased association to PABP (Fig. 4G). This effect was also observed with a larger deletion mutant (LARP1ΔC300) lacking all DM15 tandem repeats. Furthermore, these mutants failed to associate with the mRNA 5′ cap (Fig. 4H) as well as with actively translating ribosomes (Fig. 4I,J, quantified in K), suggesting that PABP plays an important role in the recruitment of LARP1 to the translation machinery.
Given that LARP1 was identified in a proteomic screen for proteins that associate with the mRNA 5′ cap, we tested whether LARP1 could associate with other known components, including the eIF4F complex. Notably, we found that LARP1 coimmunoprecipitated with eIF4A but not eIF4E or eIF4G (Supplemental Fig. 3C), raising the possibility that the association of LARP1 to ribosomes may also depend on eIF4A binding.
LARP1 regulates protein synthesis, G1-phase progression, and cell proliferation
Given that LARP1 associates with polysomes in an mTOR-dependent manner, we next sought to determine the possible role of LARP1 in global protein synthesis. To test this, we measured [3H]leucine incorporation in stable cell lines expressing different shRNA constructs targeted against LARP1 (shLARP1.1 and shLARP1.3), which showed >90% reduction in LARP1 levels (Fig. 5A; Supplemental Fig. 4A). Consistent with a previous report (Burrows et al. 2010), we found that LARP1 knockdown decreased protein synthesis rates by a factor of approximately twofold (Fig. 5A; Supplemental Fig. 4A). Because protein synthesis is required for cell growth and proliferation, we tested whether LARP1 depletion would affect these processes. As such, we found that LARP1 silencing using three shRNA constructs in three different cell lines (HEK293, HEC-1B, and A549) significantly reduced cell proliferation to a level similar to that obtained with mTOR inhibitor treatments (Fig. 5B,C; Supplemental Fig. 4B,C). Importantly, this reduction in cell proliferation was not caused by an increase in cell death, as measured by FACS analysis of Annexin V binding (Supplemental Fig. 4F,G). mTOR inhibition is known to reduce the rate of G1-phase progression in many cell types (Fingar et al. 2004). To determine whether LARP1 knockdown results in a similar defect, we performed FACS analysis of DNA content. Similar to the inhibition of mTOR using Ku-0063794 (Fig. 5D; Supplemental Fig. 4D,E), we found that LARP1 knockdown using three different shRNA constructs resulted in the accumulation of cells at the G0/G1 phase (Fig. 5D; Supplemental Fig. 4D,E).
Figure 5.

LARP1 regulates protein synthesis, cell cycle progression, and proliferation. (A) HEK293 stably expressing different shRNA constructs targeted against LARP1 (shLARP1.1 and shLARP1.3) show decreased global protein synthesis as measured by [3H]leucine incorporation, compared with control cells (shNT). (B,C) HEK293 cells stably expressing different shRNA constructs targeted against LARP1 (LARP1.1, LARP1.2, and LARP1.3) display significantly decreased cell proliferation as measured by cell counting at 24 h, 48 h, and 72 h. (B) DIC images show representative examples of HEK293 cells stably expressing shRNAs against LARP1. (D) Comparable with the inhibition of mTOR using Ku-0063794, knockdown of LARP1 with three different shRNAs results in a cell cycle arrest and accumulation of cells at G0/G1. (E) Endogenous LARP1 coimmunoprecipitates with HA-tagged Raptor in HEK293 cells. (F) Endogenous Raptor, but not Rictor, coimmunoprecipitates with myc-tagged LARP1. (G) The interaction between LARP1 and Raptor is not significantly affected by the presence of detergents that disrupt mTORC1. (H) Immunofluorescence showing myc-tagged LARP1 (in green) colocalizing with HA-tagged Raptor (in red), notably in puncta (insets). Nuclei were stained with DAPI.
Our results indicate that LARP1 regulates protein synthesis downstream from mTORC1, which is known to recruit effector proteins via interaction with its scaffolding component, Raptor. To determine whether LARP1 interacts with Raptor, we first performed forward and reverse coimmunoprecipitation experiments. Notably, we found that endogenous and exogenous LARP1 interact with Raptor but not Rictor, a component of mTORC2 (Fig. 5E,F). Our results also indicated that LARP1 interaction with Raptor does not require mTOR, as the association was found in conditions that either disrupt (NP-40) or preserve (CHAPS) mTORC1 (Fig. 5G), which is suggestive of a direct interaction between LARP1 and Raptor. Consistent with these results, immunofluorescence localization of LARP1 and Raptor showed a high degree of overlap, including in a significant proportion of puncta (Fig. 5H), indicating that a proportion of both LARP1 and Raptor colocalizes in cells. Our results indicate that LARP1 interacts with both PABP and Raptor; therefore, we next determined whether these interactions were mutually exclusive. To address this, we performed competition assays between Raptor and PABP for their binding to LARP1. Our results show that overexpression of myc-tagged human Raptor in HEK293 cells did not alter the ability of LARP1 to coimmunoprecipitate with PABP and vice versa (Supplemental Fig. 5A,B), raising the possibility that both proteins associate with LARP1 simultaneously. Taken together, these results indicate that LARP1 is an important mediator of mTOR-regulated cell growth and proliferation.
LARP1 regulates polysome assembly and is particularly important for 5′TOP mRNA translation
To help determine how LARP1 regulates protein synthesis, we performed sucrose gradient velocity sedimentation of ribosomes in LARP1-depleted cells (shLARP1.1 and shLARP1.2). Notably, we found that LARP1 knockdown resulted in a significant decrease in polysome assembly that was concomitant with an increase in the abundance of 80S monosomal subunits (Fig. 6A; Supplemental Fig. 6A), suggesting potential defects in translation initiation. Importantly, complementation of these LARP1-depleted cells with an RNAi-resistant form of LARP1 that partially restored LARP1 expression (Supplemental Fig. 7) also displayed a partial rescue of the decrease in polysome assembly (Supplemental Fig. 7), suggesting that these effects were specific to LARP1 knockdown and not caused by random off-target effects. While mTOR inhibition using PI-103 or Ku-0063794 resulted in similar polysome assembly defects (Fig. 6B; Supplemental Fig. 6B), we did not find altered mTOR signaling in LARP1-depleted cells (Fig. 6A), indicating that LARP1 may be regulating translation initiation downstream from mTORC1.
Figure 6.

LARP1 associates with and regulates 5′TOP mRNA translation. (A) Ribosome profiling of HEK293 cells stably expressing a nontarget shRNA (shNT) or shRNAs against LARP1 (shLARP1.1 and shLARP1.2). A decrease in polysome assembly with a concomitant increase in 80S monosomes (polysome/subpolysome ratios of 0.37 and 0.38) was found in LARP1-depleted cells. (Bottom right panels) Immunoblot analysis reveals a modest effect on 4E-BP phosphorylation and S6 ribosomal protein expression. The bottom histogram shows ribosome mRNA profiling of LARP1-depleted cells (shL1.1 and shL1.2) with a significant reduction (∼50%) for 5′TOP mRNAs (average of 10 TOP mRNAs; bottom right panel; see the Materials and Methods) with no significant effects on control mRNAs (average of 10 NON-TOP mRNAs; bottom left panel; also see the Materials and Methods) when compared with a nontarget shRNA (shNT). (B) Treatment of cells with mTOR inhibitors (PI-103 and Ku-0063794 for 1 h) had a similar but stronger effect on polysome disassembly and 4E-BP phosphorylation. The bottom histogram shows ribosome mRNA profiling of cells treated with mTOR inhibitors with a significant reduction (∼90%) for 5′TOP mRNAs (average of 10 TOP mRNAs; bottom right panel; see the Materials and Methods) with no significant effects on control mRNAs (average of 10 NON-TOP mRNAs; bottom left panel; see the Materials and Methods) when compared with untreated cells (DMSO). Absorbance of polysomes and subpolysomal particles was continuously monitored at 260 nm. Representative A260-nm traces are shown (n = 3). The areas under the curves were calculated, and the polysome/subpolysome ratio in the histograms refers to the percentage of ribosomes engaged in translation. The data are normalized to polysome/subpolysome ratio of control condition (DMSO) and presented as a mean ± SE (n = 3). (***) P < 0.0001 using two-way ANOVAs. (C) Diagram of the experimental work flow for the RNA immunoprecipitation (RIP). (D) RIP of endogenous LARP1 (left panel) and exogenous LARP1 (right panel) showing enrichment of TOP mRNAs (average of five TOP mRNAs; bottom right panel; also see the Materials and Methods) versus non-TOP (average of 10 non-TOP mRNAs; bottom left panel; also see the Materials and Methods) compared with control IgG or empty vector. (E) Immunoblot analysis showing a significant decrease in the expression of protein encoded by 5′TOP mRNAs in HEK293 cells stably expressing an shRNA construct targeted against LARP1 (shL1.3).
While mTORC1 controls global mRNA translation via the 4E-BPs, mRNAs that contain a 5′TOP sequence have been shown to be more dependent on its activity (Hsieh et al. 2012; Thoreen et al. 2012). Interestingly, LARP1 is related to LARP3 and LARP7, which were previously shown to directly bind 5′TOP sequences (Pellizzoni et al. 1996; Crosio et al. 2000; Cardinali et al. 2003; Markert et al. 2008). To determine whether LARP1 could affect the abundance of 5′TOP mRNAs in actively translating polysomes, we used a targeted quantitative real-time PCR (qPCR) approach. Based on a recent report (Thoreen et al. 2012), we selected 10 control mRNAs that did not have a 5′TOP sequence and that were found to be mostly insensitive to mTOR inhibition. Conversely, 10 mRNAs harboring a 5′TOP sequence were chosen based on their high sensitivity to mTOR inhibition (Thoreen et al. 2012). First, we determined the effect of mTOR antagonists (PI-103 and Ku-0063794), and, in agreement with previous reports (Hsieh et al. 2012; Thoreen et al. 2012), our results show that mTOR inhibition preferentially decreased 5′TOP mRNA loading in polysomes (mean inhibition: ∼90%), whereas non-TOP mRNAs were less significantly affected (mean inhibition: ∼50%) (Fig. 6B; Supplemental Fig. 6D). We then analyzed polysome preparations from LARP1-depleted cells and found a significant reduction in 5′TOP mRNA loading compared with non-TOP mRNAs (Fig. 6A; Supplemental Fig. 6C). Importantly, long-term LARP1 depletion was also found to reduce the abundance of proteins encoded by 5′TOP mRNAs, including PABP, rpS6, rpS20, and rpL32 (Fig. 6E), consistent with the idea that LARP1 is required for their expression.
Next we determined whether LARP1 could selectively associate with 5′TOP mRNAs, when compared with mRNAs that do not contain a TOP motif. We performed RNA immunoprecipitation (RIP) experiments with both endogenous and exogenous LARP1 followed by qPCR (Fig. 6C). Using this approach, we found that LARP1 strongly enriched 5′TOP mRNAs over non-TOP mRNAs irrespective of whether endogenous (>27-fold) or exogenous (>10-fold) LARP1 was immunopurified (Fig. 6D). Taken together, these results suggest a model in which mTORC1 mediates cell growth and proliferation by promoting 5′TOP mRNA translation through known mechanisms involving 4E-BP inhibition but also through the regulation of LARP1, which appears to be required for the efficient translation of 5′TOP mRNAs (Fig. 7). Aside from LARP1, our proteomic results also suggest that many more proteins have unappreciated roles in mRNA translation.
Figure 7.
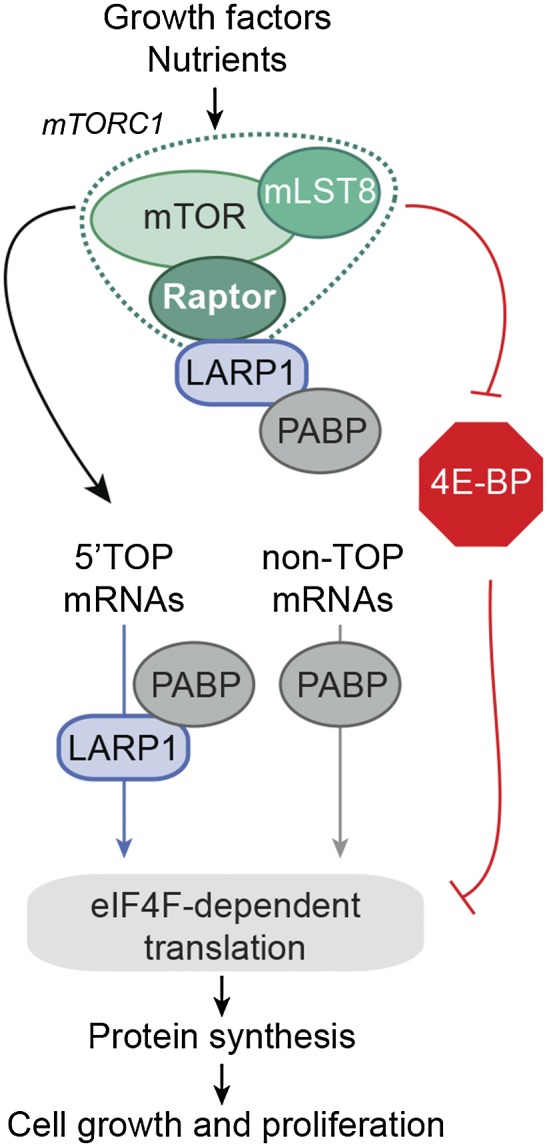
Schematic representation of the role of LARP1 in mRNA translation. Proposed model in which mTORC1 mediates cell growth and proliferation by promoting 5′TOP mRNA translation through known mechanisms involving inhibition of the 4E-BPs but also by facilitating the recruitment of 5′TOP mRNAs via their interaction with LARP1.
Discussion
While the basic mechanisms of mRNA translation have been elucidated in great detail, the identity and function of the factors implicated in targeted protein synthesis are lacking. Combining for the first time m7GTP affinity chromatography with quantitative mass spectrometry led to the identification of many proteins with uncharacterized roles in mRNA translation and metabolism (Fig. 1; Supplemental Table 1). While several of these components were previously shown to have important roles in diverse cellular processes, others, such as KIAA0564, C17orf85, and FAM98A, are completely uncharacterized. These findings underscore the complexity of targeted mRNA translation and the importance of developing novel strategies for globally identifying and characterizing new regulators of mRNA translation.
The control of gene expression at the translational level provides an efficient means for cells to rapidly respond to their changing environment. This tightly regulated process is highly dependent on mTORC1, which orchestrates a series of molecular events resulting in the recruitment and activation of several components of the translation machinery (Roux and Topisirovic 2012). Treatment of cells with mTORC1 agonists and antagonists led to the identification of many novel mTOR-regulated proteins that interact with the mRNA 5′ cap (Fig. 3; Tables 1, 2). In agreement with previous studies demonstrating an essential role for the 4E-BPs in mTOR-mediated global and targeted translation (Hsieh et al. 2012; Thoreen et al. 2012), we show that the 4E-BPs are necessary for the regulated association of most identified proteins (Figs. 2D,E, 3A). Although the 4E-BPs regulate global mRNA translation downstream from mTORC1, primarily due to their effects on eIF4F complex assembly, additional factors are likely to be required for the preferential translation of 5′TOP mRNAs, which are hypersensitive to mTOR inhibition (Gentilella and Thomas 2012). An important goal of this proteomic study was to determine whether different classes of RNA-binding proteins could at least in part explain how mTORC1 differentially regulates both global and targeted mRNA translation. Aside from LARP1, we identified several RNA-binding proteins that appear to associate to the mRNA 5′ cap, including several heterogeneous nuclear ribonucleoproteins (hnRNPs) and DEAD/DEAH-box helicases.
Our results indicate that LARP1 associates with the translation machinery and regulates both global and targeted mRNA translation. Although LARP1 depletion significantly decreased the abundance of 5′TOP mRNAs within polysome preparations, this effect was not as robust as mTOR inhibitor treatments (Fig. 6A,B). One possible explanation for this partial effect is that residual amounts of LARP1 could be sufficient to mediate basal levels of 5′TOP mRNA translation. Another possibility is that other RNA-binding proteins, including other LARPs, could compensate for LARP1 function during its depletion. Indeed, LARP3 and LARP7 have been shown to associate with 5′TOP mRNAs (Pellizzoni et al. 1996; Crosio et al. 2000; Cardinali et al. 2003; Markert et al. 2008); however, it is not clear whether this association positively or negatively impacts their translation. Consistent with our findings, a recent report indicated that LARP1 specifically interacts with 5′TOP mRNAs (Aoki et al. 2013). The investigators suggested that LARP1 could positively regulate 5′TOP mRNA stability. Although we did not see this effect in our experiments, which were performed at steady state, it is likely that treatment of cells with transcriptional inhibitors such as actinomycin D is necessary to observe changes in TOP mRNA stability. The potential involvement of LARP1 in the regulation of TOP mRNA stability would suggest that these transcripts are regulated at multiple levels. An important outstanding question is whether mTOR regulates TOP mRNA stability through mechanisms involving LARP1. Although binding of LARP1 to the 5′TOP sequence, which is adjacent to the mRNA cap structure, might be necessary to stabilize and/or transport these transcripts, it is likely that LARP1 will have to dissociate from these motifs in order for the eIF4F complex to nucleate and promote translation initiation. The observation that LARP1 cosediments with 40S, 60S, 80S, and polysomal fractions (Fig. 4A); associates with the cap complex in the absence of mRNA (Fig. 3A,B); and interacts with PABP (Fig. 4C,D) strongly supports a model in which LARP1 promotes 5′TOP mRNA translation. Nevertheless, future work is required to fully understand the exact mechanisms by which LARP1 coordinates both 5′TOP mRNA stability and translation.
Another fascinating question that arises from our work is why so many RNA-binding proteins associate with the mRNA 5′ cap upon mTOR activation. One possible explanation is that each RNA-binding protein associates with and regulates the translation of a specific subset of mRNAs. In agreement with this hypothesis, DDX3 was previously shown to associate with the eIF4F complex and regulate translation of a specific subset of mRNAs containing a complex 5′ UTR (Soto-Rifo et al. 2012). We also identified DDX3 in our proteomic screen but additionally found an mTOR-dependent association of DDX3 with the eIF4F complex (Fig. 3C). Another explanation for the high number of RNA-binding proteins is the possibility that a substantial amount of overlap exists between RNA-binding proteins, thus ensuring compensatory mechanisms in the event of deregulation. In agreement with this possibility, it has been reported that although there are diverse binding specificities among RNA-binding proteins, there is also a considerable amount of overlap (Hogan et al. 2008). Both TIA-1 and AUF-1 were identified as proteins that specifically associate with TOP mRNAs during amino acid starvation. TIA-1 binding to the TOP sequence represses their translation and decreases their association to polysome (Damgaard and Lykke-Andersen 2011; Ivanov et al. 2011). While we did not identify these proteins in our screen, we expect them to behave like the 4E-BPs and be specifically recruited to the mRNA 5′ cap in conditions where mTOR is inhibited.
Complementary approaches were used to gain in-depth knowledge on how LARP1 regulates mRNA translation. Similar to PABP, we found that LARP1 cosedimented with both subpolysomal and polysomal particles and associated with the mRNA 5′ cap in an mTOR-dependent manner. Furthermore, deletion of a C-terminal stretch of DM15 motifs in LARP1 significantly reduced its association with PABP, the eIF4F complex, and actively translating ribosomes. Notably, LARP1 association with PABP did not seem to be regulated by mTOR activity, suggesting the possibility of a preformed complex that is recruited to the translation apparatus following mTOR activation. Furthermore, we show that LARP1 forms a complex with mTORC1 but not mTORC2 by associating with Raptor. This association is consistent with previous reports showing that mTORC1 substrates require Raptor for recruitment to the complex. It is noteworthy that LARP1 contains several putative TOR signaling (TOS) motifs that may be required for efficient binding, as reported for other Raptor-binding proteins. Interestingly, recent large-scale quantitative proteomics experiments (Hsu et al. 2011; Yu et al. 2011) identified multiple mTOR-dependent phosphorylation sites in LARP1, suggesting another possible level of control by mTORC1 signaling.
Given that LARP1 promotes global protein synthesis and cell proliferation, it is reasonable to think that its expression may be up-regulated in a number of diseases, including different types of cancer. As such, LARP1 mRNA was shown to be particularly up-regulated in liver cancer (Chen et al. 2002; Wurmbach et al. 2007; Roessler et al. 2010). In addition, a recent study showed that LARP1 mRNA and protein levels were up-regulated in several hepatocellular carcinoma (HCC) cell lines as well as in HCC patients who concomitantly had a lower survival rate (Xie et al. 2013), raising the possibility that LARP1 may serve as a biomarker for predicting the prognosis of HCC. Despite promising preclinical and early clinical results obtained with mTOR inhibitors, resistance of cancer cells to these treatments has been reported. Several explanations for this resistance have been proposed, including feedback PI3K activation and loss of 4E-BP1/2 expression or overexpression of eIF4E (Alain et al. 2012). Overexpression of LARP1 in cancer cells suggests the possibility that it may promote resistance to mTOR inhibitors by facilitating cell growth and proliferation independently of mTOR activity.
This study provides new insights into the identity and regulation of components that associate with the mRNA 5′ cap. It also sheds light on how mTOR regulates both global and specific mRNA translation. Most importantly, LARP1 was identified as a key molecule involved in cell growth and proliferation, suggesting that it may be a valuable therapeutic target for the treatment of cancer.
Materials and methods
Cell culture and treatments
HEK293, HEC-1B, and A549 as well as wild-type and 4E-BP1/4E-BP2 DKO MEFs (kindly provided by Dr. Nahum Sonenberg) were maintained at 37°C in Dulbecco's modified Eagle's medium (DMEM) with 4.5 g/L glucose supplemented with 10% fetal bovine serum (FBS) and antibiotics. For insulin stimulation, cells were serum-starved overnight and treated with 100 nM insulin for 30 min. For mTOR inhibition, serum-growing cells were treated with 1 μM PI-103, 5 μM Ku-0063794, or 100 nM rapamycin (Biomol) for 1 h before being harvested.
RNAi and viral infections
For shRNA-mediated knockdown of LARP1, lentiviruses were produced using vectors from the Mission TRC shRNA library. Cells were infected in the presence of 4 μg/mL polybrene, and, 3 d after viral infection, HEK293, A549, and HEC1B cells were treated and selected with 2 μg/mL puromycin. shRNA constructs were obtained from Sigma-Aldrich (shLARP1, TRCN0000575, TRCN0000624, and TRCN0000891).
Immunoprecipitations, cap-binding assays, and immunoblotting
HEK293 and MEFs were washed with ice-cold PBS and lysed in 10 mM K3PO4, 1 mM EDTA, 5 mM EGTA, 10 mM MgCl2, 50 mM β-glycerophosphate, 0.5% NP-40, 0.1% Brij 35, 0.1% deoxycholic acid, 1 mM sodium orthovanadate (Na3VO4), 1 mM phenylmethylsulfonyl fluoride (PMSF), and a complete protease inhibitor cocktail tablet (Roche). For immunoprecipitations, HEK293 cell lysates were incubated with the indicated antibody or control IgG (Santa Cruz Biotechnology) for 2 h, followed by 1 h of incubation with protein A-Sepharose CL-4B beads (GE Healthcare). Immunoprecipitates were washed three times in lysis buffer, and beads were eluted and boiled in 2× reducing sample buffer (5× is 60 mM Tris-HCl at pH 6.8, 25% glycerol, 2% SDS, 14.4 mM 2-mercaptoethanol, 0.1% bromophenol blue). Where indicated, cells were harvested in CHAPS lysis buffer (40 mM HEPES at pH 7.4, 2 mM EDTA, 10 mM sodium pyrophosphate, 10 mM β-glycerophosphate, 0.3% CHAPS). For cap-binding assays, HEK293 and MEF cells were lysed in 10 mM Tris (pH 8), 150 mM NaCl, 10% glycerol, and 1% NP-40. Cell lysates were incubated with 7-methyl-GTP Sepharose (GE Healthcare) for 2 h. Samples were washed twice in lysis buffer and twice in lysis buffer without detergent. Pull-downs were eluted with 1 mM free 7-methyl-GTP (GE Healthcare) for 1 h at room temperature and precipitated overnight at 4°C with TCA. Eluates and total cell lysates were subjected to 10% SDS–PAGE, and resolved proteins were transferred onto polyvinylidene difluoride (PVDF) membranes for immunoblotting.
Epifluorescence microscopy
For immunofluorescence analyses, 3 × 10⁴ HEK293 cells were seeded in 12-well plates containing coverslips. Twenty-four hours later, cells were transfected with myc-tagged LARP1 and HA-tagged Raptor. Forty-eight hours later, cells were washed twice in PBS and fixed in 3.7% formaldehyde for 10 min at room temperature. Cells were washed twice in PBS, permeabilized for 5 min in PBS containing 0.2% Triton X-100, and blocked with PBS containing 0.1% bovine serum albumin for 30 min. Cells were incubated for 2 h with anti-Myc and anti-HA antibodies, washed twice with PBS, and incubated for 1 h with Alexa Fluor 488-conjugated or Alexa Fluor 555-conjugated goat anti-mouse or anti-rabbit secondary antibodies (Invitrogen). Cells were stained with DAPI (4′,6-diamidino-2-phenylindole) diluted in PBS and mounted on slides with Prolong gold (Invitrogen). Images were acquired on a Zeiss Axio Imager Z1 wide-field fluorescence microscope using a 40× oil immersion objective.
Polysomal mRNA profiling
Sucrose gradient velocity sedimentation was used to isolate the monosomal and polysomal fractions. For experiments using LARP1-depleted cells, following selection with puromycin, cells were passaged once in 15-cm dishes and then maintained in DMEM containing 10% serum and puromycin. HEK293, A549, and HEC1B LARP1-depleted cells (9 × 10⁶) were seeded in 15-cm dishes; 24 h later, fresh medium without puromycin was added, and cells were grown for another 24 h prior to harvesting. For LARP1 rescue experiments, 24 h after seeding 9 × 10⁶ HEK293 in 15-cm dishes containing DMEM with 10% serum and puromycin, cells were transfected with 9 µg of RNAi-resistant LARP1 plasmid using calcium-phosphate; 24 h later, puromycin was removed, and cells were grown for another 24 h. Ten minutes before harvesting, 100 µg/mL cycloheximide was added to the culture medium. Cells were washed in ice-cold PBS supplemented with 100 µg/mL cycloheximide and collected in polysome lysis buffer (PLB; 15 mM Tris at pH 7.4, 250 mM NaCl, 15 mM MgCl2, 1% Triton X-100, 100 µg/mL cycloheximide, 1 mM DTT, 400 U/mL RNase Out [Invitrogen, Life Technologies], protease inhibitors.) Samples were centrifuged at 10,000g for 10 min at 4°C. Protein concentration in the resulting supernatants was measured by Bradford, and equal amounts of protein were layered on a 20%–50% linear sucrose gradient and centrifuged in a Beckman SW41Ti rotor at 92,000g for 3 h at 4°C. Following centrifugation, the A254 was continuously monitored and recorded using a Gradient Station IP (Biocomp) attached to a UV-MII (GE Healthcare) spectrophotometer. Polysomal fractions were collected, and RNA was extracted using RNeasy minikit (Qiagen).
RIP
Cells were washed with ice-cold PBS and lysed in RIP buffer (50 mM Tris-HCl at pH 7.4, 300 mM NaCl, 1 mM MgCl2, 0.05% NP-40, 1 mM Na3VO4, 1 mM PMSF, 1 mM DTT, 200 U/mL RNase Out, 100 µg/mL yeast tRNA [Sigma], protease inhibitors). For immunoprecipitations, cell lysates were precleared with protein A-Sepharose beads for 30 min and then incubated with the indicated antibody for 2 h, followed by 1 h of incubation with protein A-Sepharose beads. Immunoprecipitates were washed six times with RIP buffer and divided for Western blot and RNA extraction. RNA was eluted twice with elution buffer (PK; 50 mM Tris-HCl at pH 7.4, 100 mM NaCl, 10 mM EDTA, 1% SDS, 5 mM DTT, 400 U/mL RNase Out, 0.25 µg/mL yeast) during 15 min at 65°C and digested with 4 mg/mL proteinase K (Roche) for 40 min at 37°C. RNA was then extracted with phenol-chloroform.
Acknowledgments
We deeply appreciate all members of our laboratories for their insightful discussions and comments on the manuscript and the data. This work was supported by grants from the Cancer Research Society (to P.P.R.), the Canadian Institutes for Health Research (to P.P.R.), and the Natural Sciences and Engineering Research Council of Canada (to P.P.R.) as well as the United States National Institutes of Health (HG3456 to S.P.G.). P.P.R. holds a Canada Research Chair in Signal Transduction and Proteomics. M.C. holds a doctoral studentship from the Fonds de la Recherche en Santé du Québec (FRSQ). IRIC core facilities are supported by the FRSQ.
Footnotes
Supplemental material is available for this article.
Article is online at http://www.genesdev.org/cgi/doi/10.1101/gad.231407.113.
References
- Alain T, Morita M, Fonseca BD, Yanagiya A, Siddiqui N, Bhat M, Zammit D, Marcus V, Metrakos P, Voyer LA, et al. 2012. eIF4E/4E-BP ratio predicts the efficacy of mTOR targeted therapies. Cancer Res 72: 6468–6476 [DOI] [PubMed] [Google Scholar]
- Aoki K, Adachi S, Homoto M, Kusano H, Koike K, Natsume T 2013. LARP1 specifically recognizes the 3′ terminus of poly(A) mRNA. FEBS Lett 587: 2173–2178 [DOI] [PubMed] [Google Scholar]
- Avni D, Biberman Y, Meyuhas O 1997. The 5′ terminal oligopyrimidine tract confers translational control on TOP mRNAs in a cell type- and sequence context-dependent manner. Nucleic Acids Res 25: 995–1001 [DOI] [PMC free article] [PubMed] [Google Scholar]
- Bayfield MA, Yang R, Maraia RJ 2010. Conserved and divergent features of the structure and function of La and La-related proteins (LARPs). Biochim Biophys Acta 1799: 365–378 [DOI] [PMC free article] [PubMed] [Google Scholar]
- Blagden SP, Gatt MK, Archambault V, Lada K, Ichihara K, Lilley KS, Inoue YH, Glover DM 2009. Drosophila Larp associates with poly(A)-binding protein and is required for male fertility and syncytial embryo development. Dev Biol 334: 186–197 [DOI] [PubMed] [Google Scholar]
- Burrows C, Abd Latip N, Lam SJ, Carpenter L, Sawicka K, Tzolovsky G, Gabra H, Bushell M, Glover DM, Willis AE, et al. 2010. The RNA binding protein Larp1 regulates cell division, apoptosis and cell migration. Nucleic Acids Res 38: 5542–5553 [DOI] [PMC free article] [PubMed] [Google Scholar]
- Cardinali B, Carissimi C, Gravina P, Pierandrei-Amaldi P 2003. La protein is associated with terminal oligopyrimidine mRNAs in actively translating polysomes. J Biol Chem 278: 35145–35151 [DOI] [PubMed] [Google Scholar]
- Chauvet S, Maurel-Zaffran C, Miassod R, Jullien N, Pradel J, Aragnol D 2000. dlarp, a new candidate Hox target in Drosophila whose orthologue in mouse is expressed at sites of epithelium/mesenchymal interactions. Dev Dyn 218: 401–413 [DOI] [PubMed] [Google Scholar]
- Chen X, Cheung ST, So S, Fan ST, Barry C, Higgins J, Lai KM, Ji J, Dudoit S, Ng IO, et al. 2002. Gene expression patterns in human liver cancers. Mol Biol Cell 13: 1929–1939 [DOI] [PMC free article] [PubMed] [Google Scholar]
- Crosio C, Boyl PP, Loreni F, Pierandrei-Amaldi P, Amaldi F 2000. La protein has a positive effect on the translation of TOP mRNAs in vivo. Nucleic Acids Res 28: 2927–2934 [DOI] [PMC free article] [PubMed] [Google Scholar]
- Damgaard CK, Lykke-Andersen J 2011. Translational coregulation of 5′TOP mRNAs by TIA-1 and TIAR. Genes Dev 25: 2057–2068 [DOI] [PMC free article] [PubMed] [Google Scholar]
- Dowling RJ, Topisirovic I, Alain T, Bidinosti M, Fonseca BD, Petroulakis E, Wang X, Larsson O, Selvaraj A, Liu Y, et al. 2010. mTORC1-mediated cell proliferation, but not cell growth, controlled by the 4E-BPs. Science 328: 1172–1176 [DOI] [PMC free article] [PubMed] [Google Scholar]
- Fingar DC, Richardson CJ, Tee AR, Cheatham L, Tsou C, Blenis J 2004. mTOR controls cell cycle progression through its cell growth effectors S6K1 and 4E-BP1/eukaryotic translation initiation factor 4E. Mol Cell Biol 24: 200–216 [DOI] [PMC free article] [PubMed] [Google Scholar]
- Foster KG, Fingar DC 2010. Mammalian target of rapamycin (mTOR): Conducting the cellular signaling symphony. J Biol Chem 285: 14071–14077 [DOI] [PMC free article] [PubMed] [Google Scholar]
- Gentilella A, Thomas G 2012. Cancer biology: The director's cut. Nature 485: 50–51 [DOI] [PubMed] [Google Scholar]
- Hogan DJ, Riordan DP, Gerber AP, Herschlag D, Brown PO 2008. Diverse RNA-binding proteins interact with functionally related sets of RNAs, suggesting an extensive regulatory system. PLoS Biol 6: e255. [DOI] [PMC free article] [PubMed] [Google Scholar]
- Hsieh AC, Liu Y, Edlind MP, Ingolia NT, Janes MR, Sher A, Shi EY, Stumpf CR, Christensen C, Bonham MJ, et al. 2012. The translational landscape of mTOR signalling steers cancer initiation and metastasis. Nature 485: 55–61 [DOI] [PMC free article] [PubMed] [Google Scholar]
- Hsu PP, Kang SA, Rameseder J, Zhang Y, Ottina KA, Lim D, Peterson TR, Choi Y, Gray NS, Yaffe MB, et al. 2011. The mTOR-regulated phosphoproteome reveals a mechanism of mTORC1-mediated inhibition of growth factor signaling. Science 332: 1317–1322 [DOI] [PMC free article] [PubMed] [Google Scholar]
- Ivanov P, Kedersha N, Anderson P 2011. Stress puts TIA on TOP. Genes Dev 25: 2119–2124 [DOI] [PMC free article] [PubMed] [Google Scholar]
- Jacinto E 2008. What controls TOR? IUBMB Life 60: 483–496 [DOI] [PubMed] [Google Scholar]
- Jefferies HB, Reinhard C, Kozma SC, Thomas G 1994. Rapamycin selectively represses translation of the ‘polypyrimidine tract’ mRNA family. Proc Natl Acad Sci 91: 4441–4445 [DOI] [PMC free article] [PubMed] [Google Scholar]
- Kakegawa T, Ohuchi N, Hayakawa A, Hirata S, Matsuda M, Kogure K, Kobayashi H, Inoue A, Kaspar RL 2007. Identification of AUF1 as a rapamycin-responsive binding protein to the 5′-terminal oligopyrimidine element of mRNAs. Arch Biochem Biophys 465: 274–281 [DOI] [PubMed] [Google Scholar]
- Koromilas AE, Lazaris-Karatzas A, Sonenberg N 1992. mRNAs containing extensive secondary structure in their 5′ non-coding region translate efficiently in cells overexpressing initiation factor eIF-4E. EMBO J 11: 4153–4158 [DOI] [PMC free article] [PubMed] [Google Scholar]
- Laplante M, Sabatini DM 2012. mTOR signaling in growth control and disease. Cell 149: 274–293 [DOI] [PMC free article] [PubMed] [Google Scholar]
- Ma XM, Blenis J 2009. Molecular mechanisms of mTOR-mediated translational control. Nat Rev Mol Cell Biol 10: 307–318 [DOI] [PubMed] [Google Scholar]
- Markert A, Grimm M, Martinez J, Wiesner J, Meyerhans A, Meyuhas O, Sickmann A, Fischer U 2008. The La-related protein LARP7 is a component of the 7SK ribonucleoprotein and affects transcription of cellular and viral polymerase II genes. EMBO Rep 9: 569–575 [DOI] [PMC free article] [PubMed] [Google Scholar]
- Meyuhas O 2000. Synthesis of the translational apparatus is regulated at the translational level. Eur J Biochem 267: 6321–6330 [DOI] [PubMed] [Google Scholar]
- Nykamp K, Lee MH, Kimble J 2008. C. elegans La-related protein, LARP-1, localizes to germline P bodies and attenuates Ras-MAPK signaling during oogenesis. RNA 14: 1378–1389 [DOI] [PMC free article] [PubMed] [Google Scholar]
- Pause A, Belsham GJ, Gingras A, Donze O, Lin T, Lawrence JCJ, Sonenberg N 1994. Insulin-dependent stimulation of protein synthesis by phosphorylation of a regulator of 5′-cap function. Nature 371: 762–767 [DOI] [PubMed] [Google Scholar]
- Pellizzoni L, Cardinali B, Lin-Marq N, Mercanti D, Pierandrei-Amaldi P 1996. A Xenopus laevis homologue of the La autoantigen binds the pyrimidine tract of the 5′ UTR of ribosomal protein mRNAs in vitro: Implication of a protein factor in complex formation. J Mol Biol 259: 904–915 [DOI] [PubMed] [Google Scholar]
- Pestova TV, Shatsky IN, Hellen CU 1996. Functional dissection of eukaryotic initiation factor 4F: The 4A subunit and the central domain of the 4G subunit are sufficient to mediate internal entry of 43S preinitiation complexes. Mol Cell Biol 16: 6870–6878 [DOI] [PMC free article] [PubMed] [Google Scholar]
- Polak P, Hall MN 2009. mTOR and the control of whole body metabolism. Curr Opin Cell Biol 21: 209–218 [DOI] [PubMed] [Google Scholar]
- Roessler S, Jia HL, Budhu A, Forgues M, Ye QH, Lee JS, Thorgeirsson SS, Sun Z, Tang ZY, Qin LX, et al. 2010. A unique metastasis gene signature enables prediction of tumor relapse in early-stage hepatocellular carcinoma patients. Cancer Res 70: 10202–10212 [DOI] [PMC free article] [PubMed] [Google Scholar]
- Roux PP, Topisirovic I 2012. Regulation of mRNA translation by signaling pathways. Cold Spring Harb Perspect Biol 4: a012252. [DOI] [PMC free article] [PubMed] [Google Scholar]
- Sengupta S, Peterson TR, Sabatini DM 2010. Regulation of the mTOR complex 1 pathway by nutrients, growth factors, and stress. Mol Cell 40: 310–322 [DOI] [PMC free article] [PubMed] [Google Scholar]
- Shama S, Avni D, Frederickson RM, Sonenberg N, Meyuhas O 1995. Overexpression of initiation factor eIF-4E does not relieve the translational repression of ribosomal protein mRNAs in quiescent cells. Gene Expr 4: 241–252 [PMC free article] [PubMed] [Google Scholar]
- Sonenberg N 2008. eIF4E, the mRNA cap-binding protein: From basic discovery to translational research. Biochem Cell Biol 86: 178–183 [DOI] [PubMed] [Google Scholar]
- Sonenberg N, Morgan MA, Merrick WC, Shatkin AJ 1978. A polypeptide in eukaryotic initiation factors that crosslinks specifically to the 5′-terminal cap in mRNA. Proc Natl Acad Sci 75: 4843–4847 [DOI] [PMC free article] [PubMed] [Google Scholar]
- Soto-Rifo R, Rubilar PS, Limousin T, de Breyne S, Decimo D, Ohlmann T 2012. DEAD-box protein DDX3 associates with eIF4F to promote translation of selected mRNAs. EMBO J 31: 3745–3756 [DOI] [PMC free article] [PubMed] [Google Scholar]
- Tcherkezian J, Brittis PA, Thomas F, Roux PP, Flanagan JG 2010. Transmembrane receptor DCC associates with protein synthesis machinery and regulates translation. Cell 141: 632–644 [DOI] [PMC free article] [PubMed] [Google Scholar]
- Thoreen CC, Chantranupong L, Keys HR, Wang T, Gray NS, Sabatini DM 2012. A unifying model for mTORC1-mediated regulation of mRNA translation. Nature 485: 109–113 [DOI] [PMC free article] [PubMed] [Google Scholar]
- Wurmbach E, Chen YB, Khitrov G, Zhang W, Roayaie S, Schwartz M, Fiel I, Thung S, Mazzaferro V, Bruix J, et al. 2007. Genome-wide molecular profiles of HCV-induced dysplasia and hepatocellular carcinoma. Hepatology 45: 938–947 [DOI] [PubMed] [Google Scholar]
- Xie C, Huang L, Xie S, Xie D, Zhang G, Wang P, Peng L, Gao Z 2013. LARP1 predict the prognosis for early-stage and AFP-normal hepatocellular carcinoma. J Transl Med 11: 272. [DOI] [PMC free article] [PubMed] [Google Scholar]
- Yu Y, Yoon SO, Poulogiannis G, Yang Q, Ma XM, Villen J, Kubica N, Hoffman GR, Cantley LC, Gygi SP, et al. 2011. Phosphoproteomic analysis identifies Grb10 as an mTORC1 substrate that negatively regulates insulin signaling. Science 332: 1322–1326 [DOI] [PMC free article] [PubMed] [Google Scholar]
- Zhang Y, Ling J, Yuan C, Dubruille R, Emery P 2013. A role for Drosophila ATX2 in activation of PER translation and circadian behavior. Science 340: 879–882 [DOI] [PMC free article] [PubMed] [Google Scholar]