

Abstract
Autosomal dominant polycystic kidney disease (ADPKD) is caused by mutations in PKD1 and PKD2. However, genetic analysis is complicated by six PKD1 pseudogenes, large gene sizes, and allelic heterogeneity. We developed a new clinical assay for PKD gene analysis using paired-end next-generation sequencing (NGS) by multiplexing individually bar-coded long-range PCR libraries and analyzing them in one Illumina MiSeq flow cell. The data analysis pipeline has been optimized and automated with Unix shell scripts to accommodate variant calls. This approach was validated using a cohort of 25 patients with ADPKD previously analyzed by Sanger sequencing. A total of 250 genetic variants were identified by NGS, spanning the entire exonic and adjacent intronic regions of PKD1 and PKD2, including all 16 pathogenic mutations. In addition, we identified three novel mutations in a mutation-negative cohort of 24 patients with ADPKD previously analyzed by Sanger sequencing. This NGS method achieved sensitivity of 99.2% (95% CI, 96.8%–99.9%) and specificity of 99.9% (95% CI, 99.7%–100.0%), with cost and turnaround time reduced by as much as 70%. Prospective NGS analysis of 25 patients with ADPKD demonstrated a detection rate comparable with Sanger standards. In conclusion, the NGS method was superior to Sanger sequencing for detecting PKD gene mutations, achieving high sensitivity and improved gene coverage. These characteristics suggest that NGS would be an appropriate new standard for clinical genetic testing of ADPKD.
CME Accreditation Statement: This activity (“JMD 2014 CME Program in Molecular Diagnostics”) has been planned and implemented in accordance with the Essential Areas and policies of the Accreditation Council for Continuing Medical Education (ACCME) through the joint sponsorship of the American Society for Clinical Pathology (ASCP) and the American Society for Investigative Pathology (ASIP). ASCP is accredited by the ACCME to provide continuing medical education for physicians.
The ASCP designates this journal-based CME activity (“JMD 2014 CME Program in Molecular Diagnostics”) for a maximum of 48 AMA PRA Category 1 Credit(s)™. Physicians should only claim credit commensurate with the extent of their participation in the activity.
CME Disclosures: The authors of this article and the planning committee members and staff have no relevant financial relationships with commercial interests to disclose.
Autosomal dominant polycystic kidney disease (ADPKD) affects 1 in 400 to 1 in 1000 live births worldwide.1 It is the most common inherited kidney disease, accounting for approximately 5% of the end-stage renal disease population.2 ADPKD is initiated by gene mutations in renal tubular epithelial cells, which seem to be more sensitive to haploinsufficiency, resulting in increased proliferation and cyst formation.3 The consequent increase in the number and size of kidney cysts causes progressive chronic kidney disease.4 ADPKD is mainly caused by mutations in two large genes, PKD1 and PKD2, accounting for 75% to 85% and 15% to 25% of cases, respectively, in clinically well-characterized populations. PKD1 spans 46 exons and encodes polycystin-1 with 4303 amino acids.5 PKD2 spans 15 exons, encoding polycystin-2, which consists of 968 amino acids.6 Chromosome 16 includes six homologous genes (ie, pseudogenes) that share 97.7% sequence identity with the PKD1 gene exons 1 to 33.7,8
The clinical diagnosis of ADPKD is established by family history and renal imaging modalities, such as ultrasonography, computed tomography, and magnetic resonance imaging.9 However, these diagnostic test results are often ambiguous, particularly in young individuals. Consequently, genetic testing plays an increasingly important role in the diagnosis and management of patients with ADPKD.10 Moreover, with the development of potentially effective pharmacologic treatments for ADPKD,11 the need for accurate diagnostic genetic tests has become more compelling.
The key step in ADPKD genotyping procedures is amplification of the PKD1 gene region while excluding the pseudogenes. This was traditionally achieved by using long-range PCR (LR-PCR) with primers located to the rare mismatch sites that distinguish PKD1 and the pseudogenes, followed by nested PCR of the individual exons, whereas the single-copy regions of PKD1 and PKD2 were directly amplified from genomic DNA. Amplicons were then directly analyzed by Sanger sequencing or by sequencing coupled with a mutation screening step to lower the testing cost.12,13 However, the genetic analysis of ADPKD is challenging, especially owing to the large size, complex genomic structure, and allelic heterogeneity of PKD1 and PKD2.14 Next-generation sequencing (NGS) technology has revolutionized the field of human genetics and molecular diagnostics.15,16 Recently, Rossetti et al17 reported a mutation screening strategy for analyzing PKD genes using NGS by pooling LR-PCR amplicons and multiplexing bar-coded libraries. This approach was designed to have a high throughput and has been successful for screening mutations in large cohorts. However, the method had low sensitivity and slow turnaround time, mainly because of the sample pooling strategy used.
Herein, we present a new NGS-based genotyping approach for patients with ADPKD that is better tailored to the standard clinical diagnostic setting, where rapid turnaround time and high sensitivity could be achieved by individually bar coding each patient in the run. The diagnostic performance of the new assay was evaluated using a panel of DNA samples previously analyzed by Sanger sequencing.18 The testing strategy, workflow, data analysis pipeline, costs, and other related issues are also discussed.
Materials and Methods
Study Patients
Study patients were participants in The Rogosin Institute Polycystic Kidney Disease Data Repository (http://www.clinicaltrials.gov, Identifier NCT00792155). This is a single-center, prospective, longitudinal study of genotype and phenotype characteristics of individuals with ADPKD. Study samples were randomly selected for analysis. All the participants underwent PKD genotyping by the Weill Cornell Medical College Molecular Pathology Research Laboratory (New York, NY) using direct sequencing or SURVEYOR nuclease–WAVE screening (Transgenomic Inc., Omaha, NE). In addition, we prospectively analyzed a new cohort of patients with ADPKD that has not been previously genotyped. The study was approved by the Institutional Review Board Committees at Weill Cornell Medical College and The Rockefeller University (New York, NY). All the participants provided written informed consent.
Long-Range PCR
Genomic DNA was extracted from peripheral blood lymphocytes using a Gentra Puregene blood kit (Qiagen Inc., Valencia, CA). The entire coding region, the exon-intron boundaries, and most of the 5′ and 3′ untranslated regions of PKD1 and PKD2 were amplified in a total of 10 (five reactions per gene) distinct PCR reactions using primers anchored either in the rare mismatched region with the human homologs or in the single-copy region of PKD1. The LR-PCR primers were designed using Primer3 software version 4.0.0 (http://bioinfo.ut.ee/primer3, last accessed October 25, 2013) (Table 1).19 The LR-PCR primers were modified at the 5′ end with NH2 to prevent overrepresentation of sequences at the amplicon ends in the ligation step and to increase sequence coverage uniformity.20 LR-PCR was performed using either the GeneAmp high fidelity PCR system (Applied Biosystems, Foster City, CA) or the PrimeSTAR GXL DNA polymerase (Takara Bio Inc., Shiga, Japan). PCR amplification conditions for the various LR-PCR fragments are described in Supplemental Table S1. After purification with Agencourt AMPure XP beads (Beckman Coulter, Beverly, MA), the LR-PCR fragments from each patient were quantified using PicoGreen (Quant-iT; Invitrogen, Carlsbad, CA) and were pooled together at equal molar ratio.
Table 1.
LR-PCR Primers for NGS Sequencing
| Fragment | Primers | Sequence | Size (kb) | Genomic location |
|---|---|---|---|---|
| PKD1_Ex1 | PKD1_NGS_1F | 5′-CGCAGCCTTACCATCCACCT-3′ | 2.3 | chr16:2185030-2187307 |
| PKD1_NGS_1R | 5′-TCATCGCCCCTTCCTAAGCA-3′ | |||
| PKD1_Ex2-12 | PKD1_NGS_2-12F | 5′-CCAGCTCTCTGTCTACTCACCTCCGCATC-3′ | 8.7 | chr16:2163080-2171636 |
| PKD1_NGS_2-12R | 5′-CCACGGTTACGTTGTAGTTCACGGTGACG-3′ | |||
| PKD1_Ex13-21 | PKD1_NGS_13-21F | 5′-TGGAGGGAGGGACGCCAATC-3′ | 7.9 | chr16:2155145-2163036 |
| PKD1_NGS_13-21R | 5′-ACACAGGACAGAACGGCTGAGGCTA-3′ | |||
| PKD1_Ex22-34 | PKD1_NGS_22-34F | 5′-ATGCTTAGTGAGGAGGCTGTGGGGGTC-3′ | 7.8 | chr16:2146980-2154794 |
| PKD1_NGS_22-34R | 5′-ATGAGGCTCTTTCCACAGACAACAGAGGTT-3′ | |||
| PKD1_Ex35-46 | PKD1_NGS_35-46F | 5′-CTGTGGGCGATGGGTTTATCAGCAG-3′ | 5.2 | chr16:2139301-2144473 |
| PKD1_NGS_35-46R | 5′-GAGACGGTGCAGGGAGTACGGTAGGA-3′ | |||
| PKD2_Ex1 | PKD2_NGS_ExP-1_F | 5′-GTGGAGACAGAAGCCAACCAAAGAG-3′ | 1.4 | chr4:88928226-88929584 |
| PKD2_NGS_ExP-1_R | 5′-GGATGCGAGATGGAGCCCG-3′ | |||
| PKD2_Ex2 | PKD2_NGS_Exon2_F | 5′-TTTCTTTCCATTTGCAATGTTTCATTC-3′ | 2.5 | chr4:88938491-88940897 |
| PKD2_NGS_Exon2_R | 5′-GGAAGATAGTCAATAAACAAATGCCCAA-3′ | |||
| PKD2_Ex3-6 | PKD2_NGS_Ex3-6_F | 5′-GAGAAGACCTTGTGTGAATTTGTCCA-3′ | 10.9 | chr4:88957246-88968207 |
| PKD2_NGS_Ex3-6_R | 5′-TCATACTCAGCAAAGTTACTCATGCAAA-3′ | |||
| PKD2_Ex7-10 | PKD2_NGS_Ex7-10_F | 5′-TCGGGTAAGTATAATGGTGAGCCCT-3′ | 10.3 | chr4:88973018-88983323 |
| PKD2_NGS_Ex7-10_R | 5′-CATCAAGACTCCAAGATAGGGAACATTT-3′ | |||
| PKD2_Ex11-15 | PKD2_NGS_Ex11-15_F | 5′-CACGTACTTGTTGAATGGCCAATGT-3′ | 10.8 | chr4:88986401-88997197 |
| PKD2_NGS_Ex11-15_R | 5′-ATGAAACTCAGAAGCCCTTTGACAGTT-3′ |
Library Preparation and Indexing
For each patient, 4 μg of LR-PCR products were pooled together in a total reaction volume of 210 μL of Tris-EDTA buffer and were fragmented to approximately 300 bp using adaptive focused acoustics (Covaris S2; LGC Ltd., Teddington, UK) with the following settings: duty cycle, 20%; intensity, 5; and cycles per burst, 200. After shearing, the fragments underwent end repair using the NEBNext end repair module (New England BioLabs Inc., Ipswich, MA) by adding 3′ dA overhangs to the blunt-ended DNA. After purification on AMPure XP beads, unique indexed adaptors were ligated to each patient pool using the NEBNext quick ligation module (New England BioLabs Inc.). Twenty-five different adapters with 5-nt bar codes were used for indexing and library preparation. The bar codes located in the 3′ end of each adapter were designed using a published Python script (create_index_sequences.py)21 with a minimum edit distance, or mutation tolerance, of three. Each adapter sequence began with the paired-read oligonucleotide sequences as specified by Illumina Inc. (San Diego, CA): 5′-GATCGGAAGAGCGGTTCAGCAGGAATGCCGAG-3′ and 5′-ACACTCTTTCCCTACACGACGCTCTTCCGATCT-3′. Annealing of the indexed adaptors was performed at 95°C for 2 minutes, followed by a cooldown to room temperature at a rate of 0.1°C per second using a thermal cycler (Biometra GmbH, Goettingen, Germany). The ligation products were then purified with AMPure XP beads and subjected to size selection using 2% E-Gel SizeSelect (Invitrogen). The selected 500-bp libraries were then amplified by PCR using AccuPrime Taq high fidelity (Invitrogen) with the PCR primers (Illumina Inc.) 5′-AATGATACGGCGACCACCGAGATCTACACTCTTTCCCTACACGACGCTCTTCCGATCT-3′ and 5′-CAAGCAGAAGACGGCATACGAGATCGGTCTCGGCATTCCTGCTGAACCGCTCTTCCGATCT-3′ and the following PCR conditions: 98°C for 3 minutes, 10 cycles at 98°C (80 seconds), and 65°C (90 seconds), followed by a final extension step at 65°C for 10 minutes using a thermal cycler (Biometra GmbH).
Library Pooling and Illumina Sequencing
PCR library products from each patient were purified with AMPure XP beads, quantified, and pooled together at equimolar amounts in groups of 25 samples. The finished libraries were quantified using the PicoGreen method (Invitrogen) and were analyzed using the DNA high-sensitivity chip on an Agilent 2100 Bioanalyzer system (Agilent Technologies Inc., Santa Clara, CA) for quality control purposes and for assessing the library size. Each library pool was then diluted to 10 nmol/L and was loaded onto a flow cell of the MiSeq system (Illumina Inc.) and subjected to cluster generation and sequencing using a paired-end 150-bp cycle protocol according to the manufacturer's instructions. Typically, this read length enables the detection of indels of approximately 1 to 51 bp using the computational pipeline. An average MiSeq run generates 6.14 million reads with 5.74 million pass filter reads, and 77.1% of reads have a high quality score >Q30.
Data Analysis Pipeline
For data analysis, Illumina sequencing reads in FASTQ format were first subjected to quality control checks using the FastQC program (http://www.bioinformatics.babraham.ac.uk/projects/fastqc, last accessed October 25, 2013). The reads were then sorted according to their bar code by FastqMultx22 (https://code.google.com/p/ea-utils/wiki/FastqMultx, last accessed November 3, 2013) or the FASTQ/A barcode splitter program in the FASTX-Toolkit (http://hannonlab.cshl.edu/fastx_toolkit/index.html, last accessed October 25, 2013). Reads were then paired-end aligned using the Burrows-Wheeler Aligner (BWA) program version 0.5.9rc1,23 to a modified version of the human genome assembly hg19, where all the nucleotides outside the PKD1/PKD2 loci are masked and replaced with Ns. This procedure has the advantage of maintaining the genomic coordinates of the variants and enabling subsequent variant annotation using standard NGS analysis software (eg, ANNOVAR). Because the PKD1 pseudogenes are effectively masked, reads cannot be erroneously mapped to these genomic regions. Sequence variants were called using the Genome Analysis Toolkit (GATK) software package version 1.6 (Broad Institute, Cambridge, MA),24 carefully following the best practice guidelines recommended by GATK,25 including initial read mapping, local realignment particularly around indels, followed by base quality score recalibration. Single nucleotide variations (SNVs) and INDELs were called simultaneously on all 25 samples with the default setting of GATK Unified Genotyper on the realigned and recalibrated reads, followed by SNV and INDEL filtering to eliminate false-positive calls. The GATK uses the Phred scaled probability that a reference/alternative (ALT) polymorphism exists at a given site (given sequencing data) as the main metric for calling polymorphic sites. This metric is called QUAL in the GATK output, and we require that QUAL ≥50 together with additional filters based to define a site as PASS. The GATK command line we used is shown in Supplemental Table S2. For each patient, genotyping likelihood was then defined for the AA, A/B, and BB genotypes, and A/B and BB calls were used as variant calls. We did not specify a percentage of ALT allele threshold (defined as second number allelic depth tag in the VCF file divided by depth of coverage); however, we determined in postvariant calling analyses that the percentage of ALT allele was >12% for all variants called. The minimum number of reads supporting the ALT allele for the called variants was 10×. The minimum depth of coverage for the variants was 39×. Given that we obtained excellent sensitivity and specificity using current parameters, as noted in Results, we did not introduce any additional filters based on ALT allele percentage but continue to rely on GATK genotype likelihoods. A variant call was filtered out with any of the following criteria met: i) SNVs in clusters (three SNVs within 10 bp of each other), ii) more than four reads with mapping quality of zero and >10% of reads with mapping quality of zero, iii) strand bias higher than or equal to −1.0, iv) SNV quality score <30, v) quality-by-depth score <1.5, vi) largest contiguous homopolymer run of variant allele >10, and vii) depth of coverage less than fivefold. After filtering, variant calls were annotated using ANNOVAR software version 2012,26 and the final genotyping reports were then generated. The entire data analysis pipeline was automated using Unix shell scripts, with raw lllumina sequencing as input and final genotyping reports as output. In the present study, we restricted analysis to the coding exons and 20 bp of the flanking intronic regions. Statistical computations were performed using R version 3.0.1 software (The R Foundation for Statistical Computing, http://www.r-project.org).
Assay Analytical Characteristics
An evaluation of the assay analytical characteristics was performed using only variants located in regions analyzed by both NGS and Sanger sequencing and compared herein. Positive results were defined as all variant alleles detected by NGS in the 25-patient cohort. Negative results were defined as genotypes identical to the reference sequence at genomic sites where variants are found across the 25 patients. The new assay was evaluated for sensitivity and specificity using the following formulas:
Sensitivity = number of true-positives/(number of true-positives + number of false-negatives),
Specificity = number of true-negatives/(number of true-negatives + number of false-positives).
Reference Sequences, Variant Nomenclature, and Variant of Uncertain Significance Scoring
NCBI RefSeq sequences were used for reference sequence: PKD1, NM_000296.3; PKD2, NM_000279.3. The standard nomenclature recommended by the Human Genome Variation Society (http://www.hgvs.org/mutnomen, last accessed October 25, 2013)27 was used to number nucleotides and name mutations or variants. All sequence variant descriptions were checked for accuracy using the Mutalyzer 2.0 program (http://www.mutalyzer.nl/2.0, last accessed October 25, 2013). Variants of uncertain significance were classified based on computational analysis scores as previously described.18
Results
LR-PCR–Based NGS Analysis of Pooled Control Samples
To improve ADPKD testing and eliminate the need for Sanger sequencing, we used an LR-PCR NGS strategy to specifically amplify and directly sequence the entire coding region of both PKD1 and PKD2 genes for up to 25 patients in a single sequencing reaction. An overview of the NGS workflow is shown in Figure 1, which includes a diagram of the PKD genes and the relative primer pair positions, LR-PCR enrichment and product analysis, and data analysis steps. The unique LR-PCR oligonucleotides have been carefully designed to cover approximately 67.8 kb of genomic sequence, including all exonic sequences and flanking intronic regions (see Materials and Methods). Agarose gel electrophoresis with ethidium bromide staining of the LR-PCR products demonstrated specific fragments ranging in size from 1.4 to 10.8 kb, each covering 1 to 11 exons corresponding to the sequence of PKD1 and PKD2 (Figure 1). For evaluating the NGS workflow, we pooled individually bar-coded sequencing libraries from up to 25 patients onto a single flow cell of the MiSeq system (Illumina Inc.) and subjected it to cluster generation and sequencing using paired-end sequencing. We analyzed the sequencing results using an automated NGS data analysis pipeline combining the FastQC, FASTX-Toolkit, BWA, GATK, and ANNOVAR software packages, as illustrated in Figure 2. The Sanger sequencing–verified gene variations allowed a detailed analysis of read depth (number of reads per known variant), coverage (percentage of the regions of interest adequately covered), sensitivity (proportion of true-positives), and specificity (proportion of true-negatives).
Figure 1.

Visualization of the NGS workflow. PKD1 and PKD2 genes were individually amplified as 10 locus-specific LR-PCR products (1.4 to 10.9 kb in size), with all coding regions and most intronic regions covered, in total, an approximately 68.0 kb genomic region. A: Map of the PKD1 and PKD2 genes showing the position of the 10 pairs of primers used for LR-PCR amplification of the coding regions. The highlighted green and yellow regions correspond to the duplicated and single-copy sequences of PKD1, respectively. B: Amplification quality was verified using agarose gel electrophoresis. C: LR-PCR products from each patient were pooled together at equimolar ratio, followed by fragmentation and library preparation. The finished libraries were quantified and batched together at equimolar amounts in groups of 25 patient samples and were assessed for quality by a high-sensitivity chip using an Agilent Bioanalyzer instrument. D: The pooled libraries were sequenced on an Illumina MiSeq platform. The raw sequencing reads were sorted by bar code first and then were subjected to quality control analysis before proceeding with the mutation analysis. The quality score (Phred-like score) is shown at each position of the reads. E: Reads were then mapped back to the PKD1/PKD2 loci of human genome assembly hg19 using the BWA program. In this example, PKD1 sequencing coverage is shown using the Integrative Genomics Viewer (Broad Institute, Cambridge, MA). Red areas, reads from the plus DNA strands; blue areas, reads from the minus strands. F: Variant callings were made by the GATK software package and were visualized using the Integrative Genomics Viewer. Ex, exon; FU, fluorescence unit.
Figure 2.

Illustration of the data analysis pipelines. Listed are the analysis steps (A) and the corresponding software/application programs involved (B).
Using this approach, 85% of all sequenced reads mapped to the PKD1/2 reference genome. Of these mapped reads, 100% mapped back to the targeted PKD1 and PKD2 regions. Overall, a very high read depth was obtained across all PKD gene target regions, with >93% of targeted sequences covered with >30× for the entire amplicon. Focusing on exonic regions, we calculated the minimum, maximum, and average read depth for all PKD1 and PKD2 exons extending 20 bp from each end. This analysis demonstrated that except for two patients with a failed PCR product encompassing a single exon and PKD1 exon 1 (see below for explanation), all the exons had minimum coverage ≥11×, average coverage ≥103×, and maximum coverage ≥127×. For most exons (53 of 60), minimum coverage was ≥50×. The minimum, maximum, and average read depths as well as quality metrics for all the exons are provided in Supplemental Tables S3 and S4, respectively. For PKD1 exon 1, which contains a highly GC-rich region centered approximately on the start codon, there was a low minimum coverage in several of the patients (down to 0× at one to two nucleotides). The length of the poorly covered region (defined as a region in which one or more patients had <5× coverage) was 156 bp (chr16:2185623-2185778), suggesting that, except for this sequence, accurate variant calling is possible across all the PKD1 and PKD2 exons. Representative read depth and coverage analysis results are shown in Figure 3. For this typical sample, 100% of the targeted region was covered >15-fold depth, and 93% of the targeted region was covered >30-fold depth, with PKD1 exon 1 having the lowest read depth because of its extremely high GC content (approximately 85%) and low complexity.
Figure 3.

Read depth and coverage analysis results. Plot shows the base coverage (y axis) of each LR-PCR amplicon of the PKD1 and PKD2 genes of one patient. The x axis represents the genomic interval. The average read depth for each fragment is indicated under each amplicon. The plots were generated using the Integrative Genomics Viewer. Ex, exon.
Based on these results, SNVs and small insertion/deletion variants (three deletions of 10, 4, and 2 bp in length and one 24-bp-long insertion) (Figure 4) were detected, indicating that multiplexing of LR-PCR libraries did not compromise sensitivity or specificity rates.
Figure 4.

Visualization of typical PKD1 NGS gene variation calls. A nonsense mutation (A) and a 10-bp deletion variant (B) are shown. NGS reads were piled up and are shown on the Integrative Genomics Viewer on top; Sanger sequencing confirmations are shown below.
NGS Variant Analysis
Using this method, we validated a cohort of 25 patients who have been previously genotyped by Sanger sequencing. The samples selected harbored gene variations spanning the entire genetic sequence of PKD1 and PKD2. Data mining has correctly identified all 250 Sanger sequencing changes (corresponding to 83 gene variations), indicating that the NGS method has a diagnostic performance comparable with that of the direct sequencing approach currently used in our laboratory (Weill Cornell Medical College Molecular Pathology Research Laboratory, New York, NY). However, in one of these patients, two changes (PKD1 c. 7165T>C:p.= and PKD1 c. 6598 C>T:p.R2200C) were incorrectly identified as homozygous by NGS rather than as heterozygous. Further investigation using Sanger sequencing of the NGS LR-PCR product revealed that both variants were located in the same amplicon and that the miscalling resulted from allele dropout of the reference allele (data not shown).
Investigation of the distribution of the ALT alleles showed two sharp peaks centered on 50% ALT frequency and near 100% frequency (Figure 5). Most variants (90.5%) were within the expected 40% to 60% or >90% ALT allele frequency range. We identified 16 variants with <40% ALT allele frequency. Of these, two variants had relatively low coverage (56× and 39×), which could have led to inaccurate ALT frequency estimation. The 14 remaining low ALT percentage variants had coverage similar to the other variants and were spread across six distinct patients. Three low ALT percentage variants were repeatedly found in four patients. These three variants are known single nucleotide polymorphisms (SNPs) (rs10960, rs3087632, and rs7203729) and are found in other patients at frequencies in the 40% to 60% or >90% ALT allele frequency range. All three variants are within 700 bp of each other on chromosome 16 (positions 2140010, 2140454, and 2140680). Visual inspection of these low ALT percentage variants did not reveal any sequence artifacts; eg, the regions around these SNPs were neither GC poor nor GC rich, suggesting preferential amplification of the normal allele during LR-PCR. A detailed list of all PKD1 and PKD2 genetic variations identified in this study and an assessment of the pathogenic potential of missense variants in ANNOVAR software are shown in Tables 2 and 3, respectively. Of these 250 variants, 221 (88.4%) were in PKD1 and 29 (11.6%) were in PKD2, and 16 variants were pathogenic (Table 2). The analytic sensitivity and specificity were calculated for 2075 sites in aggregate across the 25 samples (corresponding to 83 target locations in 25 patients), including 250 variants and 1825 normal alleles, that matched the reference genes. The sensitivity of the NGS method was 99.2% (95% CI, 96.8%–99.9%) and the specificity was 99.9% (95% CI, 99.7%–100.0%) compared with Sanger sequencing results (Table 4). Taken together, these results suggest that pooling 25 bar-coded samples in a single Illumina run is feasible, with an expected read depth of approximately 300-fold.
Figure 5.

Distribution of the ALT allele frequencies. The analysis was performed using R software version 3.0.1 (http://www.r-project.org). The results are shown as a function of the ALT allele frequency percentage.
Table 2.
Details of PKD1 and PKD2 Variants Analyzed in the Cohort of 25 Sanger Sequencing–Confirmed Patients with ADPKD Analyzed by NGS
| Chromosome | Position | dbSNP ID | REF | ALT | Gene | Exon/Intron | Function | Variant nomenclature | QUAL | FILTER |
|---|---|---|---|---|---|---|---|---|---|---|
| 16 | 2139875 | rs62038811 | G | A | PKD1 | Exon46 | Synonymous SNV | NM_000296.3:c.12762C>T:p.= | 4925.23 | PASS |
| 16 | 2140010 | rs7203729 | A | G | PKD1 | Exon46 | Synonymous SNV | NM_000296.3:c.12627T>C:p.= | 11,757.62 | PASS |
| 16 | 2140177 | A | C | PKD1 | Exon46 | Nonsynonymous SNV | NM_000296.3:c.12460T>G:p.F4154V | 5601.09 | PASS | |
| 16 | 2140321 | rs79899502 | G | A | PKD1 | Exon45 | Synonymous SNV | NM_000296.3:c.12406C>T:p.= | 10007.98 | PASS |
| 16 | 2140454 | rs3087632 | T | C | PKD1 | Exon45 | Synonymous SNV | NM_000296.3:c.12273A>G:p.= | 28352.74 | PASS |
| 16 | 2140554 | rs3209986 | G | A | PKD1 | Exon45 | Nonsynonymous SNV | NM_000296.3:c.12173C>T:p.A4058V | 11352.25 | PASS |
| 16 | 2140680 | rs10960 | T | C | PKD1 | Exon44 | Nonsynonymous SNV | NM_000296.3:c.12130A>G:p.I4044V | 28827.19 | PASS |
| 16 | 2141454 | G | A | PKD1 | Exon42 | Synonymous SNV | NM_000296.3:c.11679C>T:p.= | 2940.32 | PASS | |
| 16 | 2141522 | C | A | PKD1 | Exon42 | Stopgain SNV | NM_000296.3:c.11611G>T:p.E3871X | 4450.2 | PASS | |
| 16 | 2142573 | C | G | PKD1 | Exon39 | Nonsynonymous SNV | NM_000296.3:c.11174G>C:p.W3725S | 4102.69 | PASS | |
| 16 | 2144026 | GA | G | PKD1 | Intron35 | Intronic deletion | NM_000296.3:c.10616-13delT | 6754.83 | PASS | |
| 16 | 2144123 | G | A | PKD1 | Exon35 | Stopgain SNV | NM_000296.3:c.10585C>T:p.Q3529X | 2175.31 | PASS | |
| 16 | 2144176 | rs34197769 | G | A | PKD1 | Exon35 | Nonsynonymous SNV | NM_000296.3:c.10532C>T:p.A3511V | 6720.4 | PASS |
| 16 | 2147518 | G | A | PKD1 | Intron32 | Intronic SNV | NM_000296.3:c.10218-14C>T | 6194.41 | PASS | |
| 16 | 2150323 | / | A | G | PKD1 | Intron27 | Intronic SNV | NM_000296.3:c.9569-13T>C | 6960.57 | PASS |
| 16 | 2150489 | GCT | G | PKD1 | Exon27 | Frameshift deletion | NM_000296.3:c.9474_9475del:p.3158_3159del | 7103.23 | PASS | |
| 16 | 2152129 | / | A | G | PKD1 | Exon26 | Synonymous SNV | NM_000296.3:c.9330T>C:p.= | 64581.14 | PASS |
| 16 | 2152387 | / | A | G | PKD1 | Exon25 | Nonsynonymous SNV | NM_000296.3:c.9196T>C:p.F3066L | 49993.66 | PASS |
| 16 | 2152388 | / | C | G | PKD1 | Exon25 | Synonymous SNV | NM_000296.3:c.9195G>C:p.= | 50653.93 | PASS |
| 16 | 2152619 | / | C | T | PKD1 | Exon25 | Synonymous SNV | NM_000296.3:c.8964G>A:p.= | 7886.09 | PASS |
| 16 | 2152651 | / | T | C | PKD1 | Intron24 | Intronic SNV | NM_000296.3:c.8949-17A>G | 41146.96 | PASS |
| 16 | 2152847 | / | G | A | PKD1 | Exon24 | Synonymous SNV | NM_000296.3:c.8916C>T:p.= | 7036.67 | PASS |
| 16 | 2153272 | A | See below∗ | PKD1 | Exon23 | Nonframeshift insertion | See below∗ | 33209.17 | PASS | |
| 16 | 2153618 | / | C | T | PKD1 | Exon23 | Nonsynonymous SNV | NM_000296.3:c.8440G>A:p.G2814R | 3477.3 | PASS |
| 16 | 2153619 | / | G | A | PKD1 | Exon23 | Synonymous SNV | NM_000296.3:c.8439C>T:p.= | 4679.38 | PASS |
| 16 | 2153765 | / | G | A | PKD1 | Exon23 | Nonsynonymous SNV | NM_000296.3:c.8293C>T:p.R2765C | 4200.12 | PASS |
| 16 | 2154537 | / | G | A | PKD1 | Exon22 | Nonsynonymous SNV | NM_000296.3:c.8123C>T:p.T2708M | 3605.52 | PASS |
| 16 | 2154565 | G | A | PKD1 | Exon22 | Stopgain SNV | NM_000296.3:c.8095C>T:p.Q2699X | 3154.68 | PASS | |
| 16 | 2155426 | / | T | C | PKD1 | Exon21 | Nonsynonymous SNV | NM_000296.3:c.7913A>G:p.H2638R | 32433.16 | PASS |
| 16 | 2156021 | / | A | G | PKD1 | Exon20 | Synonymous SNV | NM_000296.3:c.7708T>C:p.= | 45989.17 | PASS |
| 16 | 2156447 | / | G | A | PKD1 | Exon18 | Synonymous SNV | NM_000296.3:c.7441C>T:p.= | 39665.05 | PASS |
| 16 | 2156623 | G | T | PKD1 | Exon18 | Nonsynonymous SNV | NM_000296.3:c.7265C>A:p.T2422K | 1634.58 | PASS | |
| 16 | 2156850 | / | A | G | PKD1 | Exon17 | Synonymous SNV | NM_000296.3:c.7165T>C:p.= | 90944.82 | PASS |
| 16 | 2158022 | / | G | A | PKD1 | Exon16 | Synonymous SNV | NM_000296.3:c.6927C>T:p.= | 5649.07 | PASS |
| 16 | 2158570 | / | G | A | PKD1 | Exon15 | Nonsynonymous SNV | NM_000296.3:c.6598C>T:p.R2200C | 28297.7 | PASS |
| 16 | 2158871 | / | C | A | PKD1 | Exon15 | Synonymous SNV | NM_000296.3:c.6297G>T:p.= | 7173.93 | PASS |
| 16 | 2159313 | C | T | PKD1 | Exon15 | Nonsynonymous SNV | NM_000296.3:c.5855G>A:p.G1952D | 8717.56 | PASS | |
| 16 | 2159321 | / | G | A | PKD1 | Exon15 | Synonymous SNV | NM_000296.3:c.5847C>T:p.= | 3863.12 | PASS |
| 16 | 2159391 | G | A | PKD1 | Exon15 | Nonsynonymous SNV | NM_000296.3:c.5777C>T:p.A1926V | 2041.5 | PASS | |
| 16 | 2159405 | / | C | T | PKD1 | Exon15 | Synonymous SNV | NM_000296.3:c.5763G>A:p.= | 6637.77 | PASS |
| 16 | 2159557 | / | C | T | PKD1 | Exon15 | Nonsynonymous SNV | NM_000296.3:c.5611G>A:p.A1871T | 4010.9 | PASS |
| 16 | 2159996 | / | G | A | PKD1 | Exon15 | Synonymous SNV | NM_000296.3:c.5172C>T:p.= | 47423.27 | PASS |
| 16 | 2160280 | G | A | PKD1 | Exon15 | Stopgain SNV | NM_000296.3:c.4888C>T:p.Q1630X | 6618.24 | PASS | |
| 16 | 2160494 | / | C | T | PKD1 | Exon15 | Synonymous SNV | NM_000296.3:c.4674G>A:p.= | 19874.71 | PASS |
| 16 | 2160503 | / | T | G | PKD1 | Exon15 | Synonymous SNV | NM_000296.3:c.4665A>C:p.= | 49280.48 | PASS |
| 16 | 2160622 | / | C | T | PKD1 | Exon15 | Nonsynonymous SNV | NM_000296.3:c.4546G>A:p.A1516T | 3201.27 | PASS |
| 16 | 2160673 | / | G | A | PKD1 | Exon15 | Synonymous SNV | NM_000296.3:c.4495C>T:p.= | 3420.25 | PASS |
| 16 | 2160716 | C | T | PKD1 | Exon15 | Synonymous SNV | NM_000296.3:c.4452G>A:p.= | 3964.01 | PASS | |
| 16 | 2160973 | / | A | G | PKD1 | Exon15 | Nonsynonymous SNV | NM_000296.3:c.T4195C:p.W1399R | 32607.04 | PASS |
| 16 | 2161244 | CTGCGTGGGGA | C | PKD1 | Exon15 | Frameshift deletion | NM_000296.3:c.3914_3923del:p.1305_1308del | 7343.71 | PASS | |
| 16 | 2161443 | G | A | PKD1 | Exon15 | Nonsynonymous SNV | NM_000296.3:c.3725C>T:p.T1242M | 3864.26 | PASS | |
| 16 | 2161655 | / | G | C | PKD1 | Exon15 | Synonymous SNV | NM_000296.3:c.3513C>G:p.= | 2905.22 | PASS |
| 16 | 2161793 | / | G | A | PKD1 | Exon15 | Synonymous SNV | NM_000296.3:c.3375C>T:p.= | 33353.67 | PASS |
| 16 | 2161796 | / | G | A | PKD1 | Exon15 | Synonymous SNV | NM_000296.3:c.3372C>T:p.= | 33778.82 | PASS |
| 16 | 2161874 | T | G | PKD1 | Intron14 | Splicing SNV | NM_000296.3:c.3296-2A>C | 3192.03 | PASS | |
| 16 | 2162361 | / | A | G | PKD1 | Exon14 | Nonsynonymous SNV | NM_000296.3:c.3275T>C:p.M1092T | 31648.89 | PASS |
| 16 | 2162839 | / | T | C | PKD1 | Exon13 | Synonymous SNV | NM_000296.3:c.3111A>G:p.= | 11160.46 | PASS |
| 16 | 2162887 | / | A | G | PKD1 | Exon13 | Synonymous SNV | NM_000296.3:c.3063T>C:p.= | 22392.19 | PASS |
| 16 | 2164294 | / | G | A | PKD1 | Exon11 | Synonymous SNV | NM_000296.3:c.2730C>T:p.= | 11471.01 | PASS |
| 16 | 2164324 | / | C | T | PKD1 | Exon11 | Synonymous SNV | NM_000296.3:c.2700G>A:p.= | 11,448.82 | PASS |
| 16 | 2164330 | / | T | G | PKD1 | Exon11 | Synonymous SNV | NM_000296.3:c.2694A>C:p.= | 4682.76 | PASS |
| 16 | 2164808 | / | C | T | PKD1 | Exon11 | Nonsynonymous SNV | NM_000296.3:c.2216G>A:p.R739Q | 279070.57 | PASS |
| 16 | 2165630 | / | T | C | PKD1 | Intron9 | intronic SNV | NM_000296.3:c.1850-4A>G | 50257.02 | PASS |
| 16 | 2166061 | A | T | PKD1 | Exon9 | Nonsynonymous SNV | NM_000296.3:c.1781T>A:p.F594Y | 4476.37 | PASS | |
| 16 | 2167874 | G | A | PKD1 | Exon5 | Synonymous SNV | NM_000296.3:c.1119C>T:p.= | 268925.84 | PASS | |
| 16 | 2167970 | G | A | PKD1 | Exon5 | Synonymous SNV | NM_000296.3:c.1023C>T:p.= | 12263.35 | PASS | |
| 16 | 2169178 | C | A | PKD1 | Exon3 | Nonsynonymous SNV | NM_000296.3:c.296G>T:p.S99I | 8791.34 | PASS | |
| 16 | 2185509 | G | A | PKD1 | Exon1 | Nonsynonymous SNV | NM_000296.3:c.182C>T:p.P61L | 750.13 | PASS | |
| 16 | 2185584 | G | T | PKD1 | Exon1 | Nonsynonymous SNV | NM_000296.3:c.107C>A:p.P36H | 127.59 | PASS | |
| 4 | 88928968 | rs1805044 | G | C | PKD2 | Exon1 | Nonsynonymous SNV | NM_000297.3:c.83G>C:p.R28P | 41620.06 | PASS |
| 4 | 88929080 | G | GGACC | PKD2 | Exon1 | Frameshift insertion | NM_000297.3:c.195_196insGACC:p.R65fs | 10644.57 | PASS | |
| 4 | 88929082 | A | AC | PKD2 | Exon1 | Frameshift insertion | NM_000297.3:c.197_198insC:p.D66fs | 4694.47 | PASS | |
| 4 | 88929305 | rs2728118 | G | A | PKD2 | Exon1 | Synonymous SNV | NM_000297.3:c.420G>A:p.= | 5295.98 | PASS |
| 4 | 88929453 | rs117078377 | G | A | PKD2 | Exon1 | Nonsynonymous SNV | NM_000297.3:c.568G>A:p.A190T | 4083.65 | PASS |
| 4 | 88940594 | rs62310565 | C | T | PKD2 | Intron1 | Intronic SNV | NM_000297.3:c.596-16C>T | 2722.03 | PASS |
| 4 | 88959475 | C | T | PKD2 | Exon4 | Stopgain SNV | NM_000297.3:c.916C>T:p.R306X | 5216.94 | PASS | |
| 4 | 88959479 | GT | G | PKD2 | Exon4 | Frameshift deletion | NM_000297.3:c.921delT:p.S307fs | 10175.19 | PASS | |
| 4 | 88959517 | C | T | PKD2 | Exon4 | Stopgain SNV | NM_000297.3:c.958C>T:p.R320X | 3946.43 | PASS | |
| 4 | 88959653 | CGTAA | C | PKD2 | Intron4 | Splicing deletion | NM_000297.3:c.1094+1_1094+4del | 8740.89 | PASS | |
| 4 | 88964610 | G | A | PKD2 | Intron5 | Splicing SNV | NM_000297.3:c.1319+1G>A | 8073.4 | PASS | |
| 4 | 88967919 | rs75762896 | T | G | PKD2 | Exon6 | Nonsynonymous SNV | NM_000297.3:c.1445T>G:p.F482C | 6455.92 | PASS |
| 4 | 88977424 | G | A | PKD2 | Intron8 | Intronic SNV | NM_000297.3:c.1898+5G>A | 7426.45 | PASS | |
| 4 | 88996055 | C | T | PKD2 | Exon14 | Stopgain SNV | NM_000297.3:c.2614C>T:p.R872X | 3914.06 | PASS |
Pathogenic mutations are denoted in bold.
REF, reference; /, there was entry in dbSNP but was removed because it was located in PKD1 duplicated region thus could be contamination from pseudogenes.
AGCAGCGTATAGTTGAGCTGCAGAT; variant nomenclature, NM_000296.3:c.8786_8787insATCTGCAGCTCAACTATACGCTGC:p.L2929delinsHLQLNYTLL.
Table 3.
Assessment of the Pathogenic Potential of Missense Variants in the ANNOVAR Program
| Gene | Amino acid change | Frequency in 1000 Genome Project | dbSNP132 | SIFT prediction | PolyPhen-2 prediction | MutationTaster prediction | Overall prediction |
|---|---|---|---|---|---|---|---|
| PKD1 | NM_000296.3:c.296G>T:p.S99I | D | D | D | PP | ||
| PKD1 | NM_000296.3:c.7265C>A:p.T2422K | D | D | D | PP | ||
| PKD1 | NM_000296.3:c.8123C>T:p.T2708M | D | D | D | PP | ||
| PKD1 | NM_000296.3:c.12460T>G:p.F4154V | D | D | D | PP | ||
| PKD1 | NM_000296.3:c.11174G>C:p.W3725S | D | D | D | PP | ||
| PKD1 | NM_000296.3:c.7913A>G:p.H2638R | T | B | N | NE | ||
| PKD1 | NM_000296.3:c.4546G>A:p.A1516T | T | B | N | NE | ||
| PKD1 | NM_000296.3:c.12130A>G:p.I4044V | 0.23 | rs10960 | T | B | N | NE |
| PKD1 | NM_000296.3:c.2216G>A:p.R739Q | T | B | N | NE | ||
| PKD1 | NM_000296.3:c.10532C>T:p.A3511V | 0.06 | rs34197769 | T | B | N | NE |
| PKD1 | NM_000296.3:c.3275T>C:p.M1092T | T | B | N | NE | ||
| PKD1 | NM_000296.3:c.5777C>T:p.A1926V | T | B | N | NE | ||
| PKD1 | NM_000296.3:c.4195T>C:p.W1399R | T | B | N | NE | ||
| PKD1 | NM_000296.3:c.8440G>A:p.G2814R | T | P | N | PN | ||
| PKD1 | NM_000296.3:c.107C>A:p.P36H | T | NA | N | NE | ||
| PKD1 | NM_000296.3:c.5855G>A:p.G1952D | D | P | N | PN | ||
| PKD1 | NM_000296.3:c.182C>T:p.P61L | D | P | N | PN | ||
| PKD1 | NM_000296.3:c.12173C>T:p.A4058V | 0.03 | rs3209986 | T | D | N | PN |
| PKD1 | NM_000296.3:c.1781T>A:p.F594Y | T | D | N | PN | ||
| PKD1 | NM_000296.3:c.5611G>A:p.A1871T | T | D | N | PN | ||
| PKD1 | NM_000296.3:c.9196T>C:p.F3066L | T | D | N | PN | ||
| PKD1 | NM_000296.3:c.8293C>T:p.R2765C | D | D | N | PN | ||
| PKD1 | NM_000296.3:c.3725C>T:p.T1242M | D | D | N | PN | ||
| PKD1 | NM_000296.3:c.6598C>T:p.R2200C | D | D | N | PN | ||
| PKD2 | NM_000297.3:c.1445T>G:p.F482C | 0.003 | rs75762896 | D | D | D | D |
| PKD2 | NM_000297.3:c.568G>A:p.A190T | 0.07 | rs117078377 | T | P | N | NE |
| PKD2 | NM_000297.3:c.83G>C:p.R28P | 0.14 | rs1805044 | D | P | N | PN |
B, benign; D, deleterious; N, neutral; NA, not available; NE, neutral (sequence changes scored as benign by all three software applications18); P, possibly damaging; PP, probably pathogenic (sequence changes scored as deleterious by all three computational analysis tools18); PN, probably neutral (sequence changes scored as benign by only one or two of the software applications18); T, tolerant.
Table 4.
NGS Analytic Sensitivity and Specificity (Variants Detection)
| NGS | Sanger sequencing |
||
|---|---|---|---|
| Variant alleles (positive) | Reference alleles (negative) | Total | |
| Variant alleles (positive) | 248 | 0 | 248 |
| Reference alleles (negative) | 2 | 1825 | 1827 |
| Total | 250 | 1825 | 2075 |
Compared with the Sanger sequencing assay: sensitivity = 99.2% (95% CI, 96.8%–99.9%); specificity = 99.9% (95% CI, 99.7%–100.0%).
Mutation Analyses of Pathogenic Mutation-Negative and Novel Patients with ADPKD by Bar-Coded and Multiplexed NGS
Based on these proof-of-principle results, we analyzed an additional 24 ADPKD cases that tested negative for a pathogenic mutation by Sanger sequencing. The NGS method identified PKD1 pathogenic variants in three patients for whom variants were not previously detected (NM_000296.3:c.3296-2A>T; NM_000296.3:c. 7288 C>T:p.R2430X; and NM_000296.3:c. 1937 G>A:p.W646X), which were then further confirmed by Sanger sequencing. One of these variants, NM_000296.3:c.3296-2A>T, was previously missed because of a technologist's error, whereas the other two were mainly due to allele dropout during the LR-PCR step. Careful analysis of the original Sanger sequencing data demonstrated very low signal (<10% to 20%) for the mutant alleles, leading to miscalled sequences.
To further evaluate the sensitivity and specificity of the NGS assay, we analyzed an additional cohort of 25 patients with ADPKD that had not been previously genotyped. Of the 25 patients, 16 (64%) had a pathogenic or probably pathogenic mutation, whereas no mutations were identified in the remainder of the patient cohort (Table 5). All the positive results and the mutation-negative cases were confirmed by Sanger sequencing, suggesting sensitivity and specificity of 100% for detecting ADPKD mutations in this sample.
Table 5.
Details of PKD1 and PKD2 Mutations in a Cohort of 25 Novel Patients
| No. | Chr. | Position | REF | ALT | Exon | Gene | Exonic function | Amino acid change | QUAL | FILTER |
|---|---|---|---|---|---|---|---|---|---|---|
| 1 | 16 | 2141440 | CAGCG | C | 42 | PKD1 | Frameshift deletion | NM_000296.3:c.11690_11693del:p.3897_3898del | 11,229.66 | PASS |
| 2 | 16 | 2157900 | CT | C | 16 | PKD1 | Frameshift deletion | NM_000296.3:c.7049delA:p.E2350fs | 16754.66 | PASS |
| 3 | 16 | 2144151 | GCCCCAGCTCC | G | 35 | PKD1 | Frameshift deletion | NM_000296.3:c.10548_10557del:p.3516_3519del | 32720.66 | PASS |
| 4 | 16 | 2168287 | G | A | 5 | PKD1 | Stopgain SNV | NM_000296.3:c. 706C >T:p.Q236X | 6574.71 | PASS |
| 5 | 16 | 2164185 | G | A | 11 | PKD1 | Stopgain SNV | NM_000296.3:c. 2839 C>T:p.Q947X | 9480.71 | PASS |
| 6 | 16 | 2156600 | G | A | 18 | PKD1 | Stopgain SNV | NM_000296.3:c. 7288 C>T:p.R2430X | 4314.5 | PASS |
| 7 | 16 | 2140782 | G | A | 44 | PKD1 | Stopgain SNV | NM_000296.3:c. 12028 C>T:p.Q4010X | 13180.82 | PASS |
| 8 | 16 | 2160674 | G | T | 15 | PKD1 | Stopgain SNV | NM_000296.3:c. 4494 C>A:p.Y1498X | 9530.5 | PASS |
| 9 | 16 | 2166531 | T | A | 8 | PKD1 | Nonsynonymous SNV∗† | NM_000296.3:c. 1721 A>T:p.E574V | 6856.71 | PASS |
| 10 | 16 | 2156912 | A | G | 17 | PKD1 | Nonsynonymous SNV∗ | NM_000296.3:c. 7103 T>C:p.L2368S | 16,133.71 | PASS |
| 11 | 16 | 2164844 | A | G | 11 | PKD1 | Nonsynonymous SNV∗ | NM_000296.3:c. 2180 T>C:p.L727P | 7176.71 | PASS |
| 12 | 4 | 88929082 | A | AC | 1 | PKD2 | Frameshift insertion | NM_000297.3:c.197_198insC:p.D66fs | 10197.45 | PASS |
| 13 | 4 | 88959475 | C | T | 4 | PKD2 | Stopgain SNV | NM_000297.3:c. 916 C>T:p.R306X | 11,046.71 | PASS |
| 14 | 4 | 88959517 | C | T | 4 | PKD2 | Stopgain SNV | NM_000297.3:c. 958 C>T:p.R320X | 18,191.71 | PASS |
| 15 | 4 | 88929145 | G | A | 1 | PKD2 | Stopgain SNV | NM_000297.3:c. 260 G>A:p.W87X | 4583.71 | PASS |
| 16 | 4 | 88959536 | T | G | 4 | PKD2 | ∗Nonsynonymous SNV | NM_000297.3:c. 977 T>G:p.V326G | 11,941.71 | PASS |
Chr, chromosome; REF, reference.
Classified as probably pathogenic based on SIFT, Polyphen-2, and MutationTaster predictions as specified in Materials and Methods.
Predicted to affect exon splicing by computational analysis by distrusting an exonic splice enhancer.
NGS Cost Analysis
We also evaluated the costs of reagents and sequencing for the NGS-based approach. By pooling 25 patient samples in a single NGS Illumina MiSeq run, the cost of the test was reduced by approximately 70% compared with Sanger sequencing, from approximately $271 per patient to approximately $82 per patient (Table 6). Moreover, although the hands-on time required for setting up the LR-PCR reactions, preparing the library, and sequencing still requires approximately 1 week, data analysis is considerably faster with NGS than with the Sanger method and can be completed in only a few hours. Therefore, a 25-patient cohort could be analyzed in 1 to 2 weeks compared with ≥4 weeks with the Sanger method.
Table 6.
Comparison of Reagents, Sequencing Costs, and Time of Labor for Sanger Sequencing and NGS
| Method | Purpose | Quantity | Cost ($) |
Labor time (days) | ||
|---|---|---|---|---|---|---|
| Per sample | Per run | Per subject | ||||
| Sanger sequencing (N = 25) | LR-PCR (PKD1) | 250 | 2.40 | 600.00 | 24.00 | 5 |
| Standard PCR (PKD2) | 400 | 1.50 | 600.00 | 24.00 | 4 | |
| Purification | 200 | 2.40 | 480.00 | 19.20 | 1 | |
| Sequencing primers | 3050 | 0.10 | 305.00 | 12.20 | NA | |
| Sanger sequencing | 1600 | 3.00 | 4800.00 | 192.00 | 5 | |
| Data analysis | NA | NA | NA | NA | 4 | |
| Total | 6785.00 | 271.40 | 19 | |||
| NGS (N = 25) | LR-PCR (PKD1 and PKD2) | 250 | 1.45 | 362.50 | 14.50 | 2 |
| LR-PCR product quantification | 250 | 0.12 | 30.00 | 1.20 | 0.5 | |
| DNA fragmentation | 25 | 6.50 | 162.50 | 6.50 | 0.5 | |
| Library preparation | 25 | 20.00 | 500.00 | 20.00 | 3 | |
| Library quality assessment | 25 | 0.20 | 5.00 | 0.20 | 0.25 | |
| NGS sequencing (MiSeq) | 1 | 990.00 | 990.00 | 39.60 | 1 | |
| Data analysis | NA | NA | NA | NA | 1 | |
| Total | 2050.00 | 82.00 | 8.25 | |||
NA, not applicable.
Discussion
NGS technology has revolutionized genomic and genetic research and the field of clinical genomics. Sample bar coding and multiplexing capabilities and the availability of simpler workflows and faster turnaround time instruments, such as Illumina MiSeq, have made this method attractive to clinical laboratories. Rossetti et al17 recently developed an original approach for PKD gene mutation detection in large cohorts by coupling LR-PCR with NGS analysis with sensitivity of 78% and specificity of 100%. Herein, we describe a new NGS PKD genotyping approach with analytical sensitivity of 99.2% and specificity of 99.9% compared with the Sanger sequencing method. This approach is based on LR-PCR amplification of both the PKD1 and PKD2 genes using 10 pairs of carefully designed PCR primers covering approximately 68.0 kb of PKD genomic region, corresponding to 31.9 kb (68.8%) and 35.8 kb (51.0%) of the PKD1 and PKD2 genomic regions, respectively, particularly tailored to relatively small cohorts and clinical diagnostic applications. This improvement in sensitivity is mainly due to two factors. First, we individually bar coded LR-PCR products by patient rather than pooling of DNA samples or LR-PCR amplicons from different patients before sample bar coding.17 In contrast, Rossetti et al17 pooled DNA samples or PCR products before library generation, leading to a substantial loss of sensitivity and specificity due primarily to lack of coverage. The strategy used in the present study allows for improved coverage of individual patient samples by increasing read depth and decreasing background noise, thus allowing variant calls with high confidence. Second, we used longer reads on the MiSeq platform (150 bp × 2 as opposed to 101 bp/75 bp × 2) compared with Rossetti et al,17 ensuring higher genome mapping accuracy by reducing mapping errors.
We used the GATK software package to refine the BAM (Binary Alignment/Map) file generated by the BWA program; this step can improve accuracy in variant calls, particularly for indels. Variant calling of NGS data is prone to a high error rate owing to the following factors: many reads spanning insertion/deletion sites are misaligned because each read is aligned independently, and the raw base quality scores often vary with instrument features, such as the platform used, machine cycle, and sequence context, and, thus, cannot reflect the true base calling error rates.25 These errors in alignments and base calling will be translated into variant and genotype inference, leading to false sequence calls. The local realignment around indels and base quality score recalibration function in the GATK package can decrease the false-positive calls around indels, increasing base quality at the end of the reads and enabling overall higher accuracy of the sequence data.25 Furthermore, the multiple sample–calling feature of GATK enabled processing of multiple samples simultaneously, allowing the use of sequencing information across all samples, further increasing the accuracy of variant call. Liu et al28 conducted a systematic assessment of several variant calling packages and found that GATK in combination with the BWA aligner performed better compared with other software applications for high coverage of Illumina data (≥20×). The present NGS data had average coverage of 103×, far above the threshold, making it suitable for these analyses.
The alignment algorithm in the analysis pipeline, BWA, is a fast and memory-efficient short read aligner,23 allowing implementation on a standard desktop computer without the need for expensive computer clusters and making it attractive to the standard diagnostic laboratory. In our experience, data from 25 patients could be efficiently analyzed (within several hours) using an iMac desktop computer with two processors and a 3.06-GHz CPU and 16 GB of memory (Apple Inc., Cupertino, CA). The data analysis pipelines have been fully automated with Unix shell scripts, significantly reducing the hands-on time required for quality checks of the sequencing data. This is a major improvement compared with the labor-intensive pipeline required for analyzing Sanger sequencing data, even when using automated applications, such as Mutation Surveyor (SoftGenetics LLC., State College, PA),13 for variant calling. Moreover, ANNOVAR genomic annotator can readily access several prediction programs, including SIFT,29 PolyPhen-2,30 and Mutation Taster (http://www.mutationtaster.org, last accessed October 25, 2013),31 used for evaluating the pathogenic potential of missense change, providing important information about the pathogenicity of the variants analyzed. In this study, of 27 missense variants, six were classified as deleterious by all three prediction algorithms, which is in agreement with the results obtained by the present standard bioinformatics procedures (Table 3).18
Taken together, the workflow reported herein can be easily adapted to a routine clinical diagnostic setting. The LR-PCR and library preparation steps have been automated using a liquid handler (Corbett 1200; Qiagen Inc.), standardizing the reaction setup process. Similarly, the individual bar coding of patient samples and the simultaneous processing of 25 samples, together with the automated data analysis pipeline, have greatly reduced the number of test reactions, decreasing technologist's errors and increasing the overall precision and accuracy of the sequencing data obtained. Consequently, up to 25 patients can be genotyped in 1 to 2 weeks at reagent costs of $82 per patient compared with $271 per patient with the current Sanger sequencing method.
Overall, the present method detected all 250 Sanger sequencing–verified gene variations, including single nucleotide changes, splice site alterations, and indel mutations, except for two PKD1 changes residing in the same amplicon that were ascertained as homozygous by NGS rather than as heterozygous. In contrast, of the 24 patients with Sanger sequencing–negative ADPKD, 3 were found to harbor a pathogenic mutation in PKD1 by the NGS method, subsequently confirmed by Sanger sequencing, using different primers. Except for PKD1 c.3296-2A>T, previously missed by Sanger sequencing owing a technologist's error, the two other discrepancies were due to allele dropout during the LR-PCR amplification step. Allele dropout or reduction to homozygosity has been well documented, particularly for PKD1, which is highly polymorphic, and it is likely due to the presence of an SNP in the primer binding sites in one of the two alleles, leading to unequal PCR amplification of the two heterozygous alleles.17,18 This phenomenon is less likely to occur with NGS because deep sequencing has a significantly higher level of analytical sensitivity of at least 5%32,33 compared with the Sanger method for detection of mutations in impure populations of DNAs. Preferential amplification of one allele versus the other can also explain the lower-than-expected (50%) percentage ALT alleles observed for approximately 10% of the variants in this study. In addition, NGS requires only a limited number of primer pairs, as opposed to >80 pairs with Sanger sequencing, thereby considerably reducing the chances for mispriming. Nevertheless, in all cases with homozygous mutations, subsequent confirmatory sequencing analysis must be performed to rule out false-positive results.18 Note that the greater analytical sensitivity achieved by high-depth sequencing can be particularly suitable for detecting low-abundance mutations in rare cases of mosaicism. Although false-positive results have not been seen in this study, we propose that as a part of a routine clinical workflow, all mutations should be confirmed by Sanger sequencing. The low coverage of the GC-rich exon 1 found in this study for multiple samples may lead to false-negative results. To overcome this problem, we suggest that follow-up Sanger sequencing be used as an alternative method for negative cases with low coverage (<5×).34
One potential limitation of this NGS-based ADPKD genotyping approach is that the target enrichment process still requires LR-PCR, and setting up LR-PCR is cumbersome and complicated, especially when large numbers of samples are analyzed. Qi et al35 used hybridization-based exon capture as an approach to ADPKD genotyping. However, although target enrichment is considerably easier to perform compared with LR-PCR, this approach is not suitable for distinguishing PKD1 from the pseudogenes, with a true-positive mutation detection rate of only 28.6%.35 Low coverage of GC-rich DNA regions due to the unexpected secondary structure of the DNA template may also be a limitation and an underestimated cause for missed variants, particularly in exon 1 of PKD1, which is 85% GC rich.17,36 This phenomenon of base composition bias has been well documented for Illumina sequencing and is primarily attributed to the enrichment PCR step during library construction.36 Amplification with AccuPrime Taq high fidelity enzyme blend at a low primer extension temperature of 65°C has been shown to improve the overall coverage of high–GC-rich areas.36 In our hands, there was still very good average read coverage of PKD1 exon 1 (15×), allowing for confident variant calling. However, we identified a 156-bp-long region in exon 1 (chr16:2185623-2185778) in which we observed <5× coverage at one nucleotide or more and in at least one patient in the cohort. Unequal and sometimes low coverage in this region indicates that variants occurring in this region might be missed, suggesting that this amplicon should be added in an excess molar ratio compared with all other amplicons when pooling to provide sufficient read depth for a confident mutation call.17 We note, however, that Sanger sequencing did not detect any variants in this region in the present cohort despite the high quality of the Sanger traces (not shown).
Finally, large deletions have been shown to play an important role in ADPKD in 1% to 3% of cases.37,38 Although the paired-end mapping feature in the genotyping protocol makes it possible to detect such mutations, it requires that the deletion is located in the LR-PCR amplicon (Figure 6). The method will not detect any deletion that is outside the LR-PCR primer range, requiring the continuing need for methods such as multiplex ligation-dependent probe amplification.38
Figure 6.
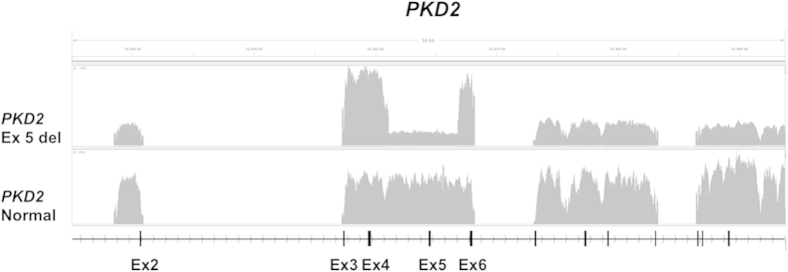
Coverage plot illustrating the identification of a large-sized deletion in PKD2. The patient had an approximately 6-kb deletion that included PKD2 exon (Ex) 5 and adjacent intronic regions compared with the control sample.
In summary, NGS-based ADPKD genetic analysis is a highly accurate and reliable approach for mutation analysis, achieving high sensitivity and improved intronic coverage with a faster turnaround time and lower cost. Optimization of the workflow and the stepwise process quality control metrics for data analysis will likely become routine for clinical genetic testing, and NGS would be an appropriate new standard for clinical genetic testing of ADPKD.
Acknowledgment
We thank Dr. Peter C. Harris (Mayo Clinic, Rochester, MN) for providing a DNA control positive for a PKD2 deletion mutation.
Footnotes
Supported by The Rockefeller University Center for Clinical Translational Science (J.B.), National Center for Research Resources/NIH grant UL1 RR024143-01 (J.B.), the NIH Roadmap for Medical Research (J.B.), and by the Starr Foundation (J.B.).
Disclosures: None declared.
Supplemental Data
References
- 1.Peters D.J., Sandkuijl L.A. Genetic heterogeneity of polycystic kidney disease in Europe. Contrib Nephrol. 1992;97:128–139. doi: 10.1159/000421651. [DOI] [PubMed] [Google Scholar]
- 2.Harris P.C. 2008 Homer W. Smith Award: insights into the pathogenesis of polycystic kidney disease from gene discovery. J Am Soc Nephrol. 2009;20:1188–1198. doi: 10.1681/ASN.2009010014. [DOI] [PubMed] [Google Scholar]
- 3.Torres V.E., Harris P.C., Pirson Y. Autosomal dominant polycystic kidney disease. Lancet. 2007;369:1287–1301. doi: 10.1016/S0140-6736(07)60601-1. [DOI] [PubMed] [Google Scholar]
- 4.Braun W.E. Autosomal dominant polycystic kidney disease: emerging concepts of pathogenesis and new treatments. Cleve Clin J Med. 2009;76:97–104. doi: 10.3949/ccjm.76a.gr001. [DOI] [PubMed] [Google Scholar]
- 5.Hughes J., Ward C.J., Peral B., Aspinwall R., Clark K., San Millan J.L., Gamble V., Harris P.C. The polycystic kidney disease 1 (PKD1) gene encodes a novel protein with multiple cell recognition domains. Nat Genet. 1995;10:151–160. doi: 10.1038/ng0695-151. [DOI] [PubMed] [Google Scholar]
- 6.Mochizuki T., Wu G., Hayashi T., Xenophontos S.L., Veldhuisen B., Saris J.J., Reynolds D.M., Cai Y., Gabow P.A., Pierides A., Kimberling W.J., Breuning M.H., Deltas C.C., Peters D.J., Somlo S. PKD2, a gene for polycystic kidney disease that encodes an integral membrane protein. Science. 1996;272:1339–1342. doi: 10.1126/science.272.5266.1339. [DOI] [PubMed] [Google Scholar]
- 7.Harris P.C., Rossetti S. Molecular diagnostics for autosomal dominant polycystic kidney disease. Nat Rev Nephrol. 2010;6:197–206. doi: 10.1038/nrneph.2010.18. [DOI] [PMC free article] [PubMed] [Google Scholar]
- 8.The International Polycystic Kidney Disease Consortium Polycystic kidney disease: the complete structure of the PKD1 gene and its protein. Cell. 1995;81:289–298. doi: 10.1016/0092-8674(95)90339-9. [DOI] [PubMed] [Google Scholar]
- 9.Chapman A.B., Wei W. Imaging approaches to patients with polycystic kidney disease. Semin Nephrol. 2011;31:237–244. doi: 10.1016/j.semnephrol.2011.05.003. [DOI] [PMC free article] [PubMed] [Google Scholar]
- 10.Blumenfeld J.D. Pretransplant genetic testing of live kidney donors at risk for autosomal dominant polycystic kidney disease. Transplantation. 2009;87:6–7. doi: 10.1097/TP.0b013e318191965d. [DOI] [PMC free article] [PubMed] [Google Scholar]
- 11.Torres V.E., Chapman A.B., Devuyst O., Gansevoort R.T., Grantham J.J., Higashihara E., Perrone R.D., Krasa H.B., Ouyang J., Czerwiec F.S. Tolvaptan in patients with autosomal dominant polycystic kidney disease. N Engl J Med. 2012;367:2407–2418. doi: 10.1056/NEJMoa1205511. [DOI] [PMC free article] [PubMed] [Google Scholar]
- 12.Rossetti S., Strmecki L., Gamble V., Burton S., Sneddon V., Peral B., Roy S., Bakkaloglu A., Komel R., Winearls C.G., Harris P.C. Mutation analysis of the entire PKD1 gene: genetic and diagnostic implications. Am J Hum Genet. 2001;68:46–63. doi: 10.1086/316939. [DOI] [PMC free article] [PubMed] [Google Scholar]
- 13.Tan Y.C., Michaeel A., Blumenfeld J., Donahue S., Parker T., Levine D., Rennert H. A novel long-range PCR sequencing method for genetic analysis of the entire PKD1 gene. J Mol Diagn. 2012;14:305–313. doi: 10.1016/j.jmoldx.2012.02.007. [DOI] [PMC free article] [PubMed] [Google Scholar]
- 14.Rossetti S., Chauveau D., Walker D., Saggar-Malik A., Winearls C.G., Torres V.E., Harris P.C. A complete mutation screen of the ADPKD genes by DHPLC. Kidney Int. 2002;61:1588–1599. doi: 10.1046/j.1523-1755.2002.00326.x. [DOI] [PubMed] [Google Scholar]
- 15.Kuhlenbaumer G., Hullmann J., Appenzeller S. Novel genomic techniques open new avenues in the analysis of monogenic disorders. Hum Mutat. 2011;32:144–151. doi: 10.1002/humu.21400. [DOI] [PubMed] [Google Scholar]
- 16.Metzker M.L. Sequencing technologies: the next generation. Nat Rev Genet. 2010;11:31–46. doi: 10.1038/nrg2626. [DOI] [PubMed] [Google Scholar]
- 17.Rossetti S., Hopp K., Sikkink R.A., Sundsbak J.L., Lee Y.K., Kubly V., Eckloff B.W., Ward C.J., Winearls C.G., Torres V.E., Harris P.C. Identification of gene mutations in autosomal dominant polycystic kidney disease through targeted resequencing. J Am Soc Nephrol. 2012;23:915–933. doi: 10.1681/ASN.2011101032. [DOI] [PMC free article] [PubMed] [Google Scholar]
- 18.Tan Y.C., Blumenfeld J.D., Anghel R., Donahue S., Belenkaya R., Balina M., Parker T., Levine D., Leonard D.G., Rennert H. Novel method for genomic analysis of PKD1 and PKD2 mutations in autosomal dominant polycystic kidney disease. Hum Mutat. 2009;30:264–273. doi: 10.1002/humu.20842. [DOI] [PubMed] [Google Scholar]
- 19.Rozen S., Skaletsky H. Primer3 on the WWW for general users and for biologist programmers. Methods Mol Biol. 2000;132:365–386. doi: 10.1385/1-59259-192-2:365. [DOI] [PubMed] [Google Scholar]
- 20.Harismendy O., Frazer K. Method for improving sequence coverage uniformity of targeted genomic intervals amplified by LR-PCR using Illumina GA sequencing-by-synthesis technology. Biotechniques. 2009;46:229–231. doi: 10.2144/000113082. [DOI] [PubMed] [Google Scholar]
- 21.Meyer M., Kircher M. Illumina sequencing library preparation for highly multiplexed target capture and sequencing. Cold Spring Harb Protoc. 2010;2010 doi: 10.1101/pdb.prot5448. pdb prot5448. [DOI] [PubMed] [Google Scholar]
- 22.Aronesty E. Comparison of sequencing utility programs. Open Bioinformatics J. 2013 http://dx.doi.org/10.2174/1875036201307010001 [Google Scholar]
- 23.Li H., Durbin R. Fast and accurate short read alignment with Burrows-Wheeler transform. Bioinformatics. 2009;25:1754–1760. doi: 10.1093/bioinformatics/btp324. [DOI] [PMC free article] [PubMed] [Google Scholar]
- 24.McKenna A., Hanna M., Banks E., Sivachenko A., Cibulskis K., Kernytsky A., Garimella K., Altshuler D., Gabriel S., Daly M., DePristo M.A. The Genome Analysis Toolkit: a MapReduce framework for analyzing next-generation DNA sequencing data. Genome Res. 2010;20:1297–1303. doi: 10.1101/gr.107524.110. [DOI] [PMC free article] [PubMed] [Google Scholar]
- 25.DePristo M.A., Banks E., Poplin R., Garimella K.V., Maguire J.R., Hartl C., Philippakis A.A., del Angel G., Rivas M.A., Hanna M., McKenna A., Fennell T.J., Kernytsky A.M., Sivachenko A.Y., Cibulskis K., Gabriel S.B., Altshuler D., Daly M.J. A framework for variation discovery and genotyping using next-generation DNA sequencing data. Nat Genet. 2011;43:491–498. doi: 10.1038/ng.806. [DOI] [PMC free article] [PubMed] [Google Scholar]
- 26.Wang K., Li M., Hakonarson H. ANNOVAR: functional annotation of genetic variants from high-throughput sequencing data. Nucleic Acids Res. 2010;38:e164. doi: 10.1093/nar/gkq603. [DOI] [PMC free article] [PubMed] [Google Scholar]
- 27.den Dunnen J.T., Antonarakis S.E. Mutation nomenclature extensions and suggestions to describe complex mutations: a discussion. Hum Mutat. 2000;15:7–12. doi: 10.1002/(SICI)1098-1004(200001)15:1<7::AID-HUMU4>3.0.CO;2-N. [DOI] [PubMed] [Google Scholar]
- 28.Liu Q., Guo Y., Li J., Long J., Zhang B., Shyr Y. Steps to ensure accuracy in genotype and SNP calling from Illumina sequencing data. BMC Genomics. 2012;13(Suppl 8):S8. doi: 10.1186/1471-2164-13-S8-S8. [DOI] [PMC free article] [PubMed] [Google Scholar]
- 29.Ng P.C., Henikoff S. Predicting deleterious amino acid substitutions. Genome Res. 2001;11:863–874. doi: 10.1101/gr.176601. [DOI] [PMC free article] [PubMed] [Google Scholar]
- 30.Adzhubei I., Jordan D.M., Sunyaev S.R. Predicting functional effect of human missense mutations using PolyPhen-2. Curr Protoc Hum Genet. 2013 doi: 10.1002/0471142905.hg0720s76. Chapter 7: Unit7.20. [DOI] [PMC free article] [PubMed] [Google Scholar]
- 31.Schwarz J.M., Rodelsperger C., Schuelke M., Seelow D. MutationTaster evaluates disease-causing potential of sequence alterations. Nat Methods. 2010;7:575–576. doi: 10.1038/nmeth0810-575. [DOI] [PubMed] [Google Scholar]
- 32.Chin E.L., da Silva C., Hegde M. Assessment of clinical analytical sensitivity and specificity of next-generation sequencing for detection of simple and complex mutations. BMC Genet. 2013;14:6. doi: 10.1186/1471-2156-14-6. [DOI] [PMC free article] [PubMed] [Google Scholar]
- 33.Huang T. Next generation sequencing to characterize mitochondrial genomic DNA heteroplasmy. Curr Protoc Hum Genet. 2011 doi: 10.1002/0471142905.hg1908s71. Chapter 19: Unit19.18. [DOI] [PMC free article] [PubMed] [Google Scholar]
- 34.Rehm H.L., Bale S.J., Bayrak-Toydemir P., Berg J.S., Brown K.K., Deignan J.L., Friez M.J., Funke B.H., Hegde M.R., Lyon E. ACMG clinical laboratory standards for next-generation sequencing. Genet Med. 2013;15:733–747. doi: 10.1038/gim.2013.92. [DOI] [PMC free article] [PubMed] [Google Scholar]
- 35.Qi X.P., Du Z.F., Ma J.M., Chen X.L., Zhang Q., Fei J., Wei X.M., Chen D., Ke H.P., Liu X.Z., Li F., Chen Z.G., Su Z., Jin H.Y., Liu W.T., Zhao Y., Jiang H.L., Lan Z.Z., Li P.F., Fang M.Y., Dong W., Zhang X.N. Genetic diagnosis of autosomal dominant polycystic kidney disease by targeted capture and next-generation sequencing: utility and limitations. Gene. 2012;2012:01590–01599. doi: 10.1016/j.gene.2012.12.060. [DOI] [PubMed] [Google Scholar]
- 36.Aird D., Ross M.G., Chen W.S., Danielsson M., Fennell T., Russ C., Jaffe D.B., Nusbaum C., Gnirke A. Analyzing and minimizing PCR amplification bias in Illumina sequencing libraries. Genome Biol. 2011;12:R18. doi: 10.1186/gb-2011-12-2-r18. [DOI] [PMC free article] [PubMed] [Google Scholar]
- 37.Audrezet M.P., Cornec-Le Gall E., Chen J.M., Redon S., Quere I., Creff J., Benech C., Maestri S., Le Meur Y., Ferec C. Autosomal dominant polycystic kidney disease: comprehensive mutation analysis of PKD1 and PKD2 in 700 unrelated patients. Hum Mutat. 2012;33:1239–1250. doi: 10.1002/humu.22103. [DOI] [PubMed] [Google Scholar]
- 38.Consugar M.B., Wong W.C., Lundquist P.A., Rossetti S., Kubly V.J., Walker D.L., Rangel L.J., Aspinwall R., Niaudet W.P., Ozen S., David A., Velinov M., Bergstralh E.J., Bae K.T., Chapman A.B., Guay-Woodford L.M., Grantham J.J., Torres V.E., Sampson J.R., Dawson B.D., Harris P.C. Characterization of large rearrangements in autosomal dominant polycystic kidney disease and the PKD1/TSC2 contiguous gene syndrome. Kidney Int. 2008;74:1468–1479. doi: 10.1038/ki.2008.485. [DOI] [PMC free article] [PubMed] [Google Scholar]
Associated Data
This section collects any data citations, data availability statements, or supplementary materials included in this article.