

Background: Myeloperoxidase activity is commonly assessed in vivo by the accumulation of 3-chlorotyrosine.
Results: Myeloperoxidase-derived chlorinating species specifically converted hydroethidine to 2-chloroethidium with efficiency superior to that of the corresponding conversion of tyrosine to 3-chlorotyrosine.
Conclusion: Hydroethidine is useful to assess myeloperoxidase activity in vivo, in parallel with its simultaneous use to detect superoxide.
Significance: 2-Chloroethidium is a useful additional marker of myeloperoxidase activity.
Keywords: HPLC, Inflammation, Mass Spectrometry (MS), Neutrophil, Oxidative Stress, 3-Chlorotyrosine, Chloramines, Dihydroethidium, Hypochlorous Acid
Abstract
Oxidants derived from myeloperoxidase (MPO) contribute to inflammatory diseases. In vivo MPO activity is commonly assessed by the accumulation of 3-chlorotyrosine (3-Cl-Tyr), although 3-Cl-Tyr is formed at low yield and is subject to metabolism. Here we show that MPO activity can be assessed using hydroethidine (HE), a probe commonly employed for the detection of superoxide. Using LC/MS/MS, 1H NMR, and two-dimensional NOESY, we identified 2-chloroethidium (2-Cl-E+) as a specific product when HE was exposed to hypochlorous acid (HOCl), chloramines, MPO/H2O2/chloride, and activated human neutrophils. The rate constant for HOCl-mediated conversion of HE to 2-Cl-E+ was estimated to be 1.5 × 10⁵ m−1s−1. To investigate the utility of 2-Cl-E+ to assess MPO activity in vivo, HE was injected into wild-type and MPO-deficient (Mpo−/−) mice with established peritonitis or localized arterial inflammation, and tissue levels of 2-Cl-E+ and 3-Cl-Tyr were then determined by LC/MS/MS. In wild-type mice, 2-Cl-E+ and 3-Cl-Tyr were detected readily in the peritonitis model, whereas in the arterial inflammation model 2-Cl-E+ was present at comparatively lower concentrations (17 versus 0.3 pmol/mg of protein), and 3-Cl-Tyr could not be detected. Similar to the situation with 3-Cl-Tyr, tissue levels of 2-Cl-E+ were decreased substantially in Mpo−/− mice, indicative of the specificity of the assay. In the arterial inflammation model, 2-Cl-E+ was absent from non-inflamed arteries and blood, suggesting that HE oxidation occurred locally in the inflamed artery. Our data suggest that the conversion of exogenous HE to 2-Cl-E+ may be a useful selective and sensitive marker for MPO activity in addition to 3-Cl-Tyr.
Introduction
Reactive oxygen and nitrogen species, including superoxide anion radical (O2⨪), hydrogen peroxide (H2O2), hypochlorous acid (HOCl) and peroxynitrite (ONOO−) are implicated in physiological and pathological processes (1), although the nature of the reactive species involved often remains unknown. A major reason for this is the continued difficulty in detecting and identifying individual reactive species.
Reactive oxygen and nitrogen species have a number of distinct characteristics that renders their detection in biological systems challenging. First, they are highly reactive and hence have a short half-life. Second, they are commonly formed at low concentrations, and endogenous antioxidants readily scavenge and hence further lower the effective concentration of the reactive species. Third, their presence is limited to certain cellular compartments or organelles, in part as a consequence of their limited diffusion. For example, O2⨪ does not readily cross membranes and, therefore, likely reacts with its targets in the compartment in which it is formed (2).
Electron spin resonance is one of the few methods suitable for the direct detection of radicals. This technique is particularly suited for non-cellular in vitro experiments, whereas its application to cellular and in vivo systems is subject to a number of potential pitfalls that make interpretation of the data difficult (3). As a result, reactive species are most often detected indirectly using different probes that, upon reaction with the reactive oxygen or nitrogen species, produce stable products with fluorescent or chemiluminescent properties. One such probe is dihydroethidium or hydroethidine (4), hereafter referred to as HE.3 HE is one of the most widely used probes for the detection of reactive species in biological systems, and it has been referred to as the “gold standard” for the detection of O2⨪ in cardiovascular research (3).
For much of the last 20 years, the red fluorescence of ethidium (E+), an oxidation product of HE, has been used as a measure of O2⨪ in biological systems (4). More recently, however, Kalyanaraman and co-workers (5, 6) identified 2-hydroxy-ethidium (2-OH-E+) rather than E+ as the specific product of the reaction of HE with O2⨪. They reported HE to be converted initially to a radical cation by a one-electron oxidant other than O2⨪ and this intermediate radical to then specifically react with O2⨪ to form the fluorescent 2-OH-E+ (7, 8) (Scheme 1). In the absence of O2⨪, other oxidants, including H2O2 and ferricytochrome c, convert the intermediate cation radical to E+ and E+-E+ dimers (9). In addition, HE is oxidized to currently unidentified products upon reaction with hydroxyl radical, ONOO− and HOCl (4). In the case of HOCl, the products formed have been suggested to possess fluorescence properties similar to E+ (10), although they have not been characterized.
SCHEME 1.
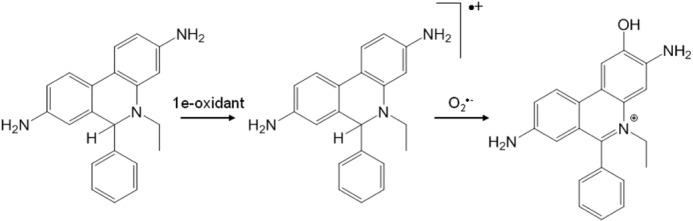
Mechanism of the formation of 2-OH-E+ from the reaction of O2⨪ with HE. Adapted from Zielonka and Kalyanaraman (4).
HOCl is a strong oxidant formed by the oxidation of chloride by H2O2 catalyzed by myeloperoxidase (MPO). MPO-derived oxidants are part of the innate immune response against invading microbes. However, MPO and MPO-derived oxidants, particularly HOCl, are also implicated in causing damage to host tissue and thereby contribute to inflammatory diseases such as atherosclerosis and related vascular disease (11). This is thought to occur via multiple mechanisms including the oxidative inactivation of endothelial nitric oxide synthase, the attenuation of the ability of high density lipoproteins to enhance reverse cholesterol transport, and the promotion of foam cell formation by low density lipoprotein (for review, see Ref. 12). Indeed, MPO- and HOCl-modified LDL and HDL are present in human atherosclerotic lesions (12) as indicated, e.g. by the presence of HOCl-modified proteins (13) and 3-chlorotyrosine (3-Cl-Tyr) (14). At present, 3-Cl-Tyr is the most commonly used surrogate for in vivo MPO/HOCl activity (15–17).
However, there are limitations to using 3-Cl-Tyr as a biomarker for MPO activity. These include the low rate of reaction of tyrosine and peptidyl-tyrosyl residues with HOCl, with an estimated rate constant of ∼40 m−1s−1 (18). Also, 3-Cl-Tyr can be oxidized further to 3,5-dichlorotyrosine and mono- and dichlorinated 4-hydroxyphenylacetaldehydes (19, 20). Furthermore, in biological systems, 3-Cl-Tyr is subject to metabolism and dechlorination (21). In light of these findings and the knowledge that HE readily reacts with different reactive species including HOCl, we have established a method for the detection of MPO/HOCl activity using the conversion of HE by HOCl to the specific product 2-chloroethidium (2-Cl-E+). To assess the utility of 2-Cl-E+ as a surrogate for MPO/HOCl activity, we compared tissue levels of 3-Cl-Tyr versus 2-Cl-E+ in in vitro and in vivo models of inflammation using liquid chromatography/mass spectrometry (LC/MS/MS). The results show that 2-Cl-E+ is as specific and perhaps more sensitive than 3-Cl-Tyr for measurement of MPO/HOCl activity in vivo.
EXPERIMENTAL PROCEDURES
Materials
HPLC grade H2O, methanol, acetonitrile, ethanol, and formic acid were obtained from Labscan (Poland). Neutral buffered formalin (10%) was from Fronine (Australia). HE was purchased from Molecular Probes or Sigma, whereas its analog N-ethyl-1,2,3,4-tetrahydro-7-quinolinamine hydrochloride (NETQ) was purchased from Manchester Organics (Manchester, UK). 2-OH-E+ and E+-E+ were synthesized, extracted, and purified as described previously (22). Diethyl (6-phenyl-10,10a-dihydrophenanthridine-3,8-diyl)dicarbamate was synthesized from 3,8-diamino-6-phenylphenanthridine (Sigma) as described previously (23). Authentic ONOO− was synthesized as described previously (24) using sodium nitrite and acidified H2O2 and then stored at −80 °C. Dextran T500 was obtained from GE Healthcare, and Percoll was from GE Healthcare Biosciences AB (Uppsala, Sweden). 3-Chloro-[13C9,15N]tyrosine was a gift from Dr. Michael Davies (Heart Research Institute, Sydney, Australia) and was prepared by an adaptation of a previously described method (25) from l-[13C9,15N]tyrosine (Sigma). All other reagents and chemicals were obtained from Sigma unless stated otherwise. The concentration of H2O2 was determined using ϵ240 nm = 43.6 m−1cm−1 and H2O2 and then diluted to the concentration indicated in the text. The concentration of reagent NaOCl (4% v/v) was determined by measuring absorbance at pH 12 using ϵ292 nm = 350 m−1cm−1 and then diluted to the concentrations indicated under “Results” and the figure legends.
Synthesis of Dimethyl-NETQ
To a solution of NETQ (20 mg, 0.11 mmol) in methanol (1 ml) at room temperature, glacial acetic acid (30 μl, 0.55 mmol) was added, followed by aqueous formaldehyde (40 μl of 37% w/v solution, 0.55 mmol), and the resulting mixture was allowed to stir for 10 min. Sodium cyanoborohydride (35 mg, 0.55 mmol) was then added to the mixture, and the reaction was stirred for 1 h. The solvent was removed in vacuo, and the resulting residue was dissolved in dichloromethane (2 ml) and washed with H2O (2 ml), dried (Na2SO4), and concentrated in vacuo. The crude product was purified by flash chromatography (silica gel, 10:90 v/v ethyl acetate/hexane) to afford dimethyl-NETQ as a colorless oil (8 mg, 39% yield).
Synthesis of Ethidium Iodide-d5-diethyl Carbamate (23)
To a solution of diethyl (6-phenyl-10,10a-dihydrophenanthridine-3,8-diyl)dicarbamate (415 mg, 0.96 mmol) in nitromethane, iodoethane-d5 (0.78 ml, 9.60 mmol) was added under constant stirring, and the reaction mixture was heated at 100 °C for 7 days. The reaction mixture was then cooled to room temperature, and the bright yellow precipitate formed was filtered, washed with dichloromethane (3 × 20 ml), and dried in vacuo to give ethidium iodide-d5-diethyl carbamate as a bright yellow solid (385 mg, 58% yield); Rf, 0.41 (10:90, MeOH/dichloromethane); m.p. 264–266 °C; IR vmax (cm−1), 1723, 1713, 1548, 1517, 1225, 1206, 1077, 1060, 829; 1H NMR (300 MHz, CD3OD) δH 10.9 (s, 1H), 10.5 (s, 1H), 9.06 (d, 1H, J 9.2 Hz), 9.00 (d, 1H, J 9.2 Hz), 8.74 (d, 1H, J 1.5 Hz), 8.23 (dd, 1H, J 1.9, 9.2 Hz), 8.05 (dd, 1H, J 1.9, 9.2 Hz), 7.83–7.78 (m, 6H), 4.24 (q, 2H, J 7.0 Hz), 4.10 (q, 2H, J 7.0 Hz), 1.31 (t, 3H, J 7.1 Hz), 1.19 (t, 3H, J 7.1 Hz); 13C NMR (75 MHz, CD3OD) δC 163.4, 154.1, 153.7, 142.5, 140.2, 134.1, 131.8, 131.6, 130.3, 129.7, 129.0, 128.6, 126.0, 125.7, 124.0, 121.8, 121.4, 117.8, 106.8, 73.8, 61.5, 61.2, 14.8 (2); high resolution mass spectrometry (ESI+ve) calculated for C27H23D5N3O4 (M+): 463.23882, found 463.23891.
Synthesis of Ethidium Bromide-d5 (26)
Ethidium iodide-d5-diethyl carbamate (300 mg, 0.50 mmol) was refluxed overnight in 48% w/v hydrobromic acid (10 ml, Ajax Australia), cooled to room temperature, and basified with ammonium hydroxide solution (28% w/v, Ajax Australia). The reaction mixture was then extracted with dichloromethane (3 × 100 ml), and the combined organic extract was dried (MgSO4) and evaporated, and the resulting dark brown residue was purified by flash column chromatography over silica gel (230–400 mesh, Scharlau, Spain) using a gradient of 0:100–20:80 (methanol/dichloromethane) to give ethidium bromide-d5 as a bright orange solid (201 mg, 89% yield); Rf, 0.22 (10:90, methanol/dichloromethane); m.p. 258–260 °C; IR vmax (cm−1), 3404, 2808, 2537, 1620, 1613, 1484, 1452, 1443, 1245, 1059, 821; 1H NMR (300 MHz, CD3OD) δH 8.90 (d, 1H, J 7.1 Hz), 8.81 (d, 1H, J 7.6 Hz), 7.93 (d, 1H, J 6.2 Hz), 7.80–7.65 (m, 6H), 7.50 (d, 1H, J 6.9 Hz), 7.29 (s, 1H); 13C NMR (75 MHz, CD3OD) δC 161.0, 149.9, 141.0, 136.4, 134.4, 131.4, 131.0, 130.5, 129.6, 128.7, 126.4, 124.6, 124.3, 123.3, 121.3, 119.1, 102.0, 73.9; high resolution mass spectrometry (ESI+ve): calculated for C21H15D5N3 (M+) 319.19656, found 319.19673.
Synthesis of Hydroethidine-d5 (27)
To a solution of ethidium bromide-d5 (80 mg, 0.17 mmol) in methanol (5 ml, Merck), sodium borohydride (20 mg, 0.53 mmol, Ajax Australia) was added under constant stirring, and the reaction mixture was stirred at room temperature for 10 min. The color of the reaction mixture changed from orange to colorless. The solvent was removed in vacuo, and the resulting residue was dissolved in dichloromethane (50 ml) and washed with water (3 × 50 ml). The organic layer was then dried (MgSO4), filtered, and evaporated, and the resulting residue was purified by flash column chromatography over silica gel using a gradient of 20:80 to 60:40 (methanol/dichloromethane) to give hydroethidine-d5 as a purple solid (40 mg, 70% yield); Rf, 0.46 (20:80, hexane/dichloromethane; m.p. 128–130 °C; IR vmax (cm−1): 3275, 1723, 1713, 1548, 1517, 1485, 1225, 1077, 1038, 829; 1H NMR (400 MHz, CDCl3) δH 7.49 (d, 1H, J 8.5 Hz) 7.46 (d, 1H, J 8.2 Hz), 7.35–7.10 (m, 5H), 6.60 (dd, 1H, J 1.7, 8.2 Hz), 6.39 (d, 1H, J 1.4 Hz), 6.18 (dd, 1H, J 1.7, 8.2 Hz), 6.06 (d, 1H, J 1.4 Hz), 5.33 (s, 1H); 13C NMR (100 MHz, CDCl3) δC 146.4, 144.3, 143.8, 135.4, 128.4, 128.0, 127.2, 126.6, 123.3, 122.6, 122.2, 115.1, 114.0, 113.1, 104.5, 99.1, 65.6, 29.7; high resolution mass spectrometry (ESI+ve): calculated for C21H17D5N3 (M+H+) 321.20636, found 321.20653.
Cellular Studies
Polymorphonuclear leukocytes (PMN) were isolated from human blood obtained from healthy donors as described previously (28) with informed consent and approval from the institutional ethics committee. PMN were suspended in HBSS at 5 × 10⁶ cells/ml. Cells were incubated for 1 h in a humidified atmosphere of 5% CO2 and 95% air at 37 °C with or without 200 ng/ml of phorbol 12-myristate 13-acetate (PMA). HE (10 μm) was then added, and the cells were incubated for a further hour. Cells were then washed, pelleted (200 × g, 5 min), and lysed in 200 μl of ice-cold 80% (v/v) ethanol by vigorous mixing for 1 min. Samples were then incubated on ice for 20 min before centrifugation (16,000 × g, 20 min, 4 °C). Supernatants were then subjected to LC/MS/MS to quantify HE and selected oxidation products as described below.
For measurement of tyrosine and 3-Cl-Tyr in PMN, cells were stimulated for 1 h with PMA as above and then washed, pelleted (200 × g, 5 min), and lysed in 400 μl of H2O by two cycles of freeze/thaw. Lysates were transferred to glass vials (Grace Davidson Discovery Sciences; catalogue #88610), then 50 μl of 0.3% (w/v) sodium deoxycholate and 100 μl of 50% (w/v) trichloroacetic acid were added, and samples were incubated on ice for 5 min. Proteins were then pelleted by centrifugation (7500 × g, 2 min, 4 °C) and washed twice with 400 μl of ice-cold acetone before drying under a gentle argon stream and hydrolysis for tyrosine and 3-Cl-Tyr analysis by LC/MS/MS as described below.
Mouse Model of Peritonitis
Peritonitis was induced in 6-week-old wild-type C75BL/6J or Mpo−/− mice (C75BL/6J background, breeding pairs were obtained originally from Dr. Aldons J. Lusis, University of California, Los Angeles, CA) by intraperitoneal injection of 250 μl of Zymosan A (5 mg/ml saline) from Saccharomyces cerevisiae. Five hours after injection, mice were sacrificed by cardiac puncture. Blood was collected into lithium heparin tubes, and plasma was isolated. The peritoneal cavity was lavaged with 5 ml of ice-cold phosphate-buffered saline. Peritoneal exudate cells were pelleted by centrifugation (300 × g, 5 min) and then lysed in 400 μl water by 2 cycles of freeze/thaw. Lysates were then processed as above for tyrosine and 3-Cl-Tyr analysis by LC/MS/MS.
For detection of HE and its oxidation products in peritoneal cells, 80 μl of HE (20 mm in DMSO/saline, 1/1, v/v) was administered to mice by intraperitoneal injection 1 h before cell collection. Animals were sacrificed by cardiac puncture, blood was collected into lithium heparin tubes, and plasma was isolated. The peritoneal cavity was then lavaged with 5 ml of ice-cold phosphate-buffered saline. Peritoneal exudate cells were centrifuged (200 × g, 5 min), and cell numbers were determined. After lysis of cells in 100 μl of nitrogen-bubbled ice-cold 80% v/v ethanol containing 1 μm HE-d5 by vigorous mixing for 1 min, samples were incubated on ice for 20 min before centrifugation (16,000 × g, 20 min, 4 °C). Supernatants were then subjected to LC/MS/MS to quantify HE and selected oxidation products as described below.
Femoral Artery Cuff
Cuff placement was performed as described previously (29). Briefly, wild-type C57BL/6J and Mpo−/− mice (6 weeks old) were anesthetized using isoflurane. The left femoral artery was isolated from surrounding tissue, loosely sheathed with a 2.0-mm polyethylene cuff (inner diameter, 0.6 mm), and tied in place with an 8–0 suture (Ethicon, Inc.), and the wound was sutured. The inner diameter of the cuff was larger than the outer diameter of the artery and, hence, did not obstruct blood flow. The right femoral artery (sham) was dissected from surrounding tissue, and the wound was sutured without placing a cuff around the vessel. After recovery under a heat source, the animals were given rodent chow and water ad libitum for up to 14 days.
At days 1, 2, 5, 7, and 14 post-surgery, mice were injected intravenously (retro-orbital route) with 20 mm HE in 80 μl of DMSO/saline (1/1, v/v) and sacrificed after 1 h by cardiac puncture. Blood was collected into lithium heparin tubes, and plasma was isolated. Animals were then perfused with PBS at a constant pressure of 100 mm Hg, and a section (∼3 mm) of the left femoral artery spanning the cuff was collected, snap-frozen in liquid N2, and stored at −80 °C. For the right (sham) femoral artery, tissue was collected from a position similar to where the cuff was placed in the left cuffed artery, snap-frozen in liquid N2, and stored at −80 °C.
Before LC/MS/MS analysis, arteries were thawed, cut into small pieces, and placed in 100 μl of ice-cold and argon-bubbled 80% (v/v) ethanol. After three cycles of freeze/thaw (in liquid N2) samples were mixed vigorously for 1 min and incubated on ice for 20 min before centrifugation (16,000 × g, 20 min, 4 °C). Supernatants were then subjected to LC/MS/MS to quantify HE and selected oxidation products as described below.
All animal experiments were performed in accordance with relevant guidelines and regulations provided by the National Health and Medical Research of Australia. The animal experimental protocols described here were approved by the institutional Animal Ethics Committees.
Arterial Histology
At days 1, 2, 5, 7, and 14 post-surgery, animals were sacrificed, and femoral arteries were harvested for histological staining. Vessels were fixed in situ by pressure perfusion fixation at 100 mm Hg with 10% neutral buffered formalin through the left ventricle (30). Both left and right femoral arteries were harvested, placed in 10% formalin overnight, and then stored in 70% (v/v) ethanol. Arteries were embedded in paraffin, sectioned (5 μm), mounted on slides, and stained with hematoxylin and eosin.
Chromatography and LC/MS/MS Conditions for Detection of HE and Oxidation Products
HE and its oxidation products were detected and quantified using an Agilent 1290 UHPLC system connected to an Agilent 6490 triple-quadrupole mass spectrometer. Samples were separated on a Synergi Polar-RP column (2.1 × 250 mm; 5 μm; Phenomenex) by gradient elution using mobile phase A (0.1% v/v formic acid in H2O) and mobile phase B (0.1% v/v formic acid in acetonitrile/H2O, 9/1, v/v) at 0.2 ml/min. The gradient consisted of 55–75% mobile phase B from 0 to 10 min, 75–100% from 10 to 12 min, and 100% mobile phase B for 2 min. The column was returned to initial conditions over 2 min and re-equilibrated for a further 5 min.
The mass spectrometer was operated in positive electrospray ion mode, and parameters employed were as follows: capillary voltage of +4.0 kV; nitrogen, the sheath gas, was set at 11 liters/min and heated to 350 °C; nebulizer pressure at 20 p.s.i. and scan range of 50–1000 m/z with the fragmentor voltage set at 140 V.
Quantification of HE, E+, 2-OH-E+, E+-E+, and 2-Cl-E+ was by multiple reaction monitoring using the above general mass spectrometry parameters. In each case the largest fragment ion generated by collision-induced dissociation of the [M+H]+ ion was used for quantification. Settings for the target analytes were (parent ion → fragment ion); HE (m/z 316.2 → 287.1) with fragmentor voltage (FV) = 130 V and collision energy (CE) = 17 V; E+ (314.2 → 285.1), FV = 155 V, CE = 25 V; 2-OH-E+ (330.2 → 300), FV = 170 V, CE = 37 V; E+-E+ (313.4 → 299.1), FV = 140 V, CE = 17 V and 2-Cl-E+ (348 → 320.1), FV = 135 V, CE = 35 V. The limit of detection for the analysis of 2-Cl-E+ was estimated to be 1.4 fmol with a signal-to-noise ratio of 10.
Measurement of Uric Acid by HPLC
Uric acid was determined in competition reactions for HOCl between HE, E+ or 2-OH-E+, and uric acid. Typically, HOCl (100 μm) was added to solutions containing 100 μm uric acid, 100 μm diethylene triamine pentaacetic acid (DTPA), and 0–200 μm HE in 10 mm sodium phosphate buffer, pH 7.4. Reactions were incubated at room temperature in the dark for 5 min and centrifuged at 16,000 × g and 4 °C for 5 min, and supernatants were subjected to HPLC for analysis of uric acid as described previously (31). Briefly, analytes were separated on a Superlosil-C18 column (4.6 × 250 mm; 5 μm; Supelco) by isocratic elution at a flow rate of 0.9 ml/min using a mobile phase consisting of 23.77 mm sodium acetate, 0.5 mm EDTA, 1.25 mm dodecyl triethyl ammonium phosphate, and 7.5% v/v methanol, pH 4.75. Uric acid was detected at 292 nm and measured against an authentic standard.
Measurement of Chloramines
Chloramines were determined in competition reactions for HOCl between HE and taurine or glycine. Chloramine concentrations were determined with thionitrobenzoic acid, which was prepared by hydrolysis of dithionitrobenzoic acid as described previously (32).
Competition between taurine or glycine and HE for HOCl was measured in a final volume of 0.5 ml of 100 mm phosphate buffer, pH 7.4. The molar ratio of amine:HOCl was ∼1:1, whereas the concentration of HE varied from 0 to 500 μm. Reactions were started by the slow addition of HOCl under vigorous mixing and then left in the dark at room temperature. After 2 min, thionitrobenzoic acid (40 μm) was added to measure the remaining chloramines using ϵ412 nm = 14,100 m−1cm−1. IC50 values for HE were then calculated from fitting curves (exponential decay) to the data.
NMR Studies
One- and two-dimensional NMR spectra were recorded at 300 K using a Bruker Avance NMR spectrometer at a frequency of 300, 400, and 500 MHz or a Bruker AVIII NMR spectrometer equipped with a triple resonance TCI cryoprobe at a frequency of 800 MHz. 1H NMR chemical shifts are reported in parts per million (ppm) and are referenced to the solvent residual signal of acetone (δ = 2.05 ppm) or chloroform (7.26 ppm).
Fluorescence Measurements
Excitation and emission spectra of oxidation and chlorination products of HE were recorded on a QuantaMaster 40 UV-visible spectrofluorometer (Photon Technology International). Typically, for emission spectra, excitation was set at 470 nm, and emission spectra were recorded over 500–750 nm. For excitation spectra, emission was set at 600 nm, and spectra were recorded over 325–575 nm.
Detection of 3-Cl-Tyr
Measurement of 3-Cl-Tyr was determined by LC/MS/MS as described previously (33), with slight modifications for analysis of cells and arteries. Cells were prepared and delipidated, and protein was precipitated before acid hydrolysis as described above. Arteries were cut into small pieces and directly hydrolyzed as described below. 3-Cl-[13C9,15N]tyrosine (0.5 nmol), and [13C9,15N]tyrosine (0.5 nmol) were added as internal standards to each sample before hydrolysis using 150 μl of 4 m methanesulfonic acid containing 0.2% (w/v) tryptamine. To control for artifactual chlorination during sample workup, [13C9,15N]-labeled tyrosine was added to cell lysates before hydrolysis with methanesulfonic acid and LC/MS/MS analysis. Under these conditions, 3-Cl[13C9,15N]tyrosine was not detected (data not shown), indicating that artifactual chlorination of tyrosine did not occur during sample workup.
The tyrosine residues and products were purified by solid-phase extraction using 3 ml of ENVI-chromP cartridges (Supelco). The columns were activated with 2 ml of methanol before preconditioning with 2 × 2 ml of 0.1% v/v trifluoroacetic acid in H2O. The hydrolyzed samples were loaded onto the column and washed with 2 ml of 0.1% v/v trifluoroacetic acid in H2O. The tyrosine products were then eluted with 1.6 ml of 80% v/v methanol, dried at 60 °C under a vacuum, dissolved in 50 μl of 0.1% v/v formic acid, and spun for 5 min at 14,000 × g.
5 μl of supernatant was then injected onto an Agilent 1290 UHPLC system connected to an Agilent 6490 triple-quadrupole mass spectrometer in positive ion electrospray mode to determine the levels of tyrosine and 3-Cl-Tyr. Samples were separated on a Zorbax Eclipse XDB-C18 column (4.6 × 50 mm; 1.8 μm) by gradient elution using mobile phase A (0.1% v/v formic acid in H2O) and mobile phase B (0.1% formic acid in acetonitrile/H2O, 9/1, v/v). The gradient (flow rate of 0.6 ml/min) consisted of 0–2% mobile phase B from 0 to 0.5 min, 2–10% from 0.5 to 3 min, then a linear gradient change from 10 to 95% mobile phase B for 3–7 min. The column was returned to initial conditions over 3 min and re-equilibrated using 100% mobile phase A for 5 min. The mass spectrometer parameters employed were similar to those reported previously (33), with the optimal fragmentor voltage set at 70 and 85 V for tyrosine and 3-Cl-Tyr, respectively, and collision energy voltage (9 V) obtained by flow injection analysis in MS2 scan mode. Tyr residues were quantified using external calibration curves constructed using each Tyr residue and its corresponding isotopically labeled enriched form as an internal standard. The peak area for each Tyr residue relative to its internal standard was a linear function of the unlabeled Tyr residues.
Quantification of tyrosine, 3-Cl-Tyr, and their isotopically labeled internal standards was achieved by multiple reaction monitoring using positive electrospray ionization mass spectrometry. In each case the largest fragment ion generated by collision-induced dissociation of the [M+H]+ ion was used for quantification. Settings for the target analytes were (parent ion → fragment ion); tyrosine (m/z 182 → 136.1), [13C9,15N]tyrosine (m/z 192 → 145.1), 3-Cl-Tyr (m/z 216 → 170), 3-Cl[13C9,15N]tyrosine (m/z 226 → 179). The limit of detection for the analysis of 3-Cl-Tyr was estimated to be 37 fmol (signal to noise ratio of 10).
Statistical Analysis
Data are shown as the mean ± S.E. Where S.E. cannot be seen they are smaller than the symbol. Statistical differences between control and PMA-stimulated PMN as well as between wild-type and Mpo−/− mice were examined by the Mann-Whitney rank sum test. Differences between sham and cuff-injured arteries were examined using a two-way analysis of variance with post-hoc Bonferroni test. Significance was accepted at p < 0.05.
RESULTS
Chlorination of HE by HOCl
HE reacts with many biological oxidants, but the products of the reaction of HE with HOCl have not been identified previously. Therefore, we first characterized the products of HE oxidation by HOCl and chloramines, the principle oxidants produced by MPO. Several products formed upon the addition of substoichiometric amounts of HOCl to HE, which could be separated and detected by LC/MS (peaks 2, 3, 4, and 5, Fig. 1A). Peak 2, eluting at 6.7 min, contained m/z 330, previously assigned to 2-OH-E+ (34). Peak 3 (7.2 min) contained m/z of 364 and 314, with the latter corresponding to E+. Peak 4 (9.2 min) contained m/z 348, whereas peak 5 (9.5 min) was identified as E+-E+ (m/z 313). The two un-identified ions of m/z 348 and 364 had an isotopic ratio of 3:1 with a difference of 2 molecular units (Fig. 1B), characteristic of the presence of chlorine. The generation of these chlorinated ions was confirmed by incubating HE with MPO/H2O2/Cl− (Fig. 1C, bottom chromatogram), a system used commonly to generate HOCl in vitro. Formation of m/z 348 and 364 required the presence of chloride, strongly suggestive of chlorinated products.
FIGURE 1.
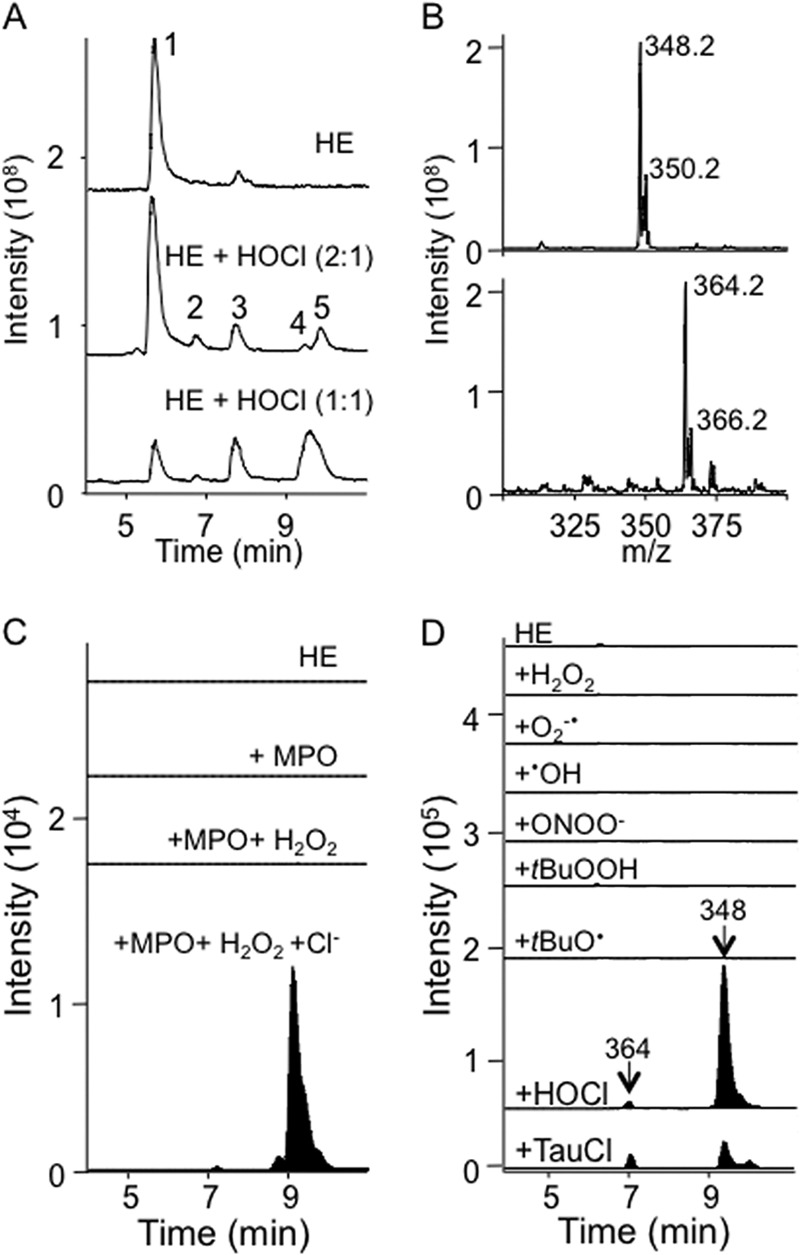
Reaction of HOCl or chloramines with HE yields chlorinated species. A, LC/MS total ion chromatograms of HE (100 μm) in 100 mm phosphate buffer, pH 7.4, containing 100 μm DTPA ± the addition of 50 or 100 μm HOCl. B, MS spectrum of peaks at 7.2 and 9.2 min containing m/z 364 and 348, respectively. C, selected ion LC/MS chromatograms of HE (100 μm) in 100 mm phosphate buffer containing 100 μm DTPA ± the addition of MPO (10 nm) or MPO (10 nm) + H2O2 (50 μm) showing single ion monitoring for m/z 348 and 364. The latter reaction was also performed in PBS instead of phosphate buffer to add chloride ions to the reaction (MPO + H2O2 + Cl−), i.e. conditions that resulted in the formation of peaks containing m/z 348 and 364 at 9.2 and 7.2 min. D, selected ion LC/MS chromatograms showing m/z 348 and 364 for the reaction of HE (50 μm) in 75 mm phosphate buffer, pH 7.4, ± various oxidants: H2O2 (250 μm in presence of 100 μm DTPA); O2⨪ (1 mm hypoxanthine, 0.05 units/ml xanthine oxidase in the presence of 100 μm DTPA); •OH (250 μm H2O2 plus excess Fe(II) sulfate); ONOO− (250 μm); tBuOOH (250 μm in presence of 100 μm DTPA); tBuOO• (250 μm tBuOOH plus excess Fe(II) sulfate); 250 μm HOCl or 250 μm taurine chloramines (TauCl). Reaction mixtures were incubated for 30 min in the dark at room temperature, then centrifuged at 16,000 × g for 10 min at 4 °C. 5 μl were then subjected to LC/MS analysis with m/z 348 and 364 shown only.
To determine if the putative chlorinated HE derivatives were specific for HOCl, we oxidized HE (50 μm) with various biologically relevant oxidants. Reactions were carried out in phosphate buffer, pH 7.4, in the dark and at room temperature for 30 min, after which the reaction mixtures were subjected to LC/MS/MS analysis. Chlorinated ions (m/z 364 and 348) were not detected in the reaction of HE with H2O2, hydroxyl radical, t-butyl hydroperoxide, t-butyl peroxyl radical, authentic ONOO−, or enzymatically generated O2⨪ (Fig. 1D). However, small amounts of both ions were detected upon reaction of HE with taurine chloramine (Fig. 1D, bottom chromatogram) or glycine chloramine (data not shown).
Estimation of the Rate Constant of the Reaction of HOCl with HE
To estimate the rate constant of the reaction of HOCl with HE, we initially carried out experiments in which HE at varying concentrations was competing with glycine or taurine for HOCl. The concentration of HE required for 50% inhibition of maximal formation of taurine chloramine (IC50Tau) or glycine chloramine (IC50Gly) was determined by fitting a curve to the data. The rate of reaction of HOCl with HE was then calculated using Equations 1 or 2, the known rate of reaction of HOCl with taurine, kTau (35), and glycine, kGly (18), and the respective IC50 values.
This gave estimated rates of reaction of HE and HOCl of 4.1 ± 0.3 × 10⁵ and 1.6 ± 0.2 × 10⁵ m−1s−1 when competing against taurine and glycine, respectively. However, as taurine and glycine chloramines also showed some reactivity toward HE (see above), we repeated competition experiments with urate. This provided a value of 1.5 × 10⁵ m−1s−1 for the rate of reaction of HE with HOCl as well as the corresponding values for the rate of reaction of HOCl with E+ (i.e. 2.9 × 10⁴ m−1s−1) and 2-OH-E+ (2.6 × 10⁵ m−1s−1) (Table 1).
TABLE 1.
Estimated rate constants for the reaction of HOCl with HE and oxidation products
The rate constants were determined by competition reaction with urate as described under “Experimental Procedures.” Means ± S.E. are shown for three separate experiments carried out on different days.
| HE and oxidation products | Rate constant |
|---|---|
| m−1s−1 | |
| HE | 1.5 ± 0.03 × 10⁵ |
| E+ | 2.9 ± 0.2 × 10⁴ |
| 2-OH-E+ | 2.6 ± 0.3 × 10⁵ |
We then examined the spectral changes during HE oxidation by HOCl in phosphate buffer, pH 7.4, over 12 min at room temperature in the dark. The addition of substoichiometric amounts of HOCl led to a time-dependent decrease in absorbance at 342 nm, concomitant with a shift in the absorption maxima to 344 nm and a small increase in absorbance at 470–520 nm (Fig. 2A). With stoichiometric amounts of HOCl and HE, the decrease at 342 nm and shift to 344 nm were more pronounced and coincided with the formation of a distinct peak at 480 nm (Fig. 2B). The addition of a 5-fold molar excess of HOCl over HE (Fig. 2C) resulted in the disappearance of the peak at 342 nm and the initial appearance of the 480 nm peak that then decreased over time, suggesting consumption of the initial product(s) formed. This interpretation was supported by the observation that upon addition of a 5-fold molar excess of HOCl, the colorless HE solution initially turned pink and then bleached to a faintly yellow colored solution (data not shown).
FIGURE 2.

Characteristics of the reaction of HE with HOCl. HOCl at 10 μm (A), 50 μm (B), or 125 μm (C) was added to 50 μm HE in 100 mm phosphate buffer, pH 7.4. Spectra were recorded at 1-min intervals for 12 min after starting the reaction with the addition of HOCl while mixing vigorously. Gray lines represent HE before the addition of HOCl. Dashed arrows indicate the first spectrum after the addition of HOCl. ↑/↓ indicate a increase/decrease in peak maxima with time. Data are representative of three independent experiments. AUFS, absorbance units at full scale. D, effect of HOCl concentration on LC/MS/MS peak areas of HE and oxidation products from the reaction of HE (50 μm) with HOCl (0–200 μm) in 100 mm phosphate buffer, pH 7.4, containing 100 μm DTPA. E, repeat of experiment in D with inclusion of superoxide dismutase (200 units). F, LC/MS/MS peak area of 2-OH-E+ from the reaction of HE (100 μm) with HOCl (50 μm) in 100 mm phosphate buffer, pH 7.4, containing increasing concentrations of DTPA (0–500 μm). G, effect of taurine chloramine (TauCl) on LC/MS/MS peak areas of selected analytes measured from the reaction of HE (50 μm) with taurine chloramine (0–200 μm) in 100 mm phosphate buffer, pH 7.4, containing 100 μm DTPA. Reaction mixtures were incubated in the dark for 30 min at room temperature before centrifugation at 16,000 × g for 10 min. The supernatants were then analyzed by LC/MS/MS as described under “Experimental Procedures” for the detection of HE (■), m/z 348 (●), m/z 364 (○), 2-OH-E+ (◆), E+ (□) and E+-E+ (♦). Data are representative of three separate experiments, except for F, where they represent two separate experiments.
We next characterized oxidation of HE with HOCl by LC/MS/MS. We observed that commercial HE was partially oxidized, indicated by the presence of small amounts of E+ and 2-OH-E+. Attempts to purify HE by HPLC were not successful (data not shown), suggesting that oxidation occurred during sample workup/preparation, possibly due to air- or residual light-induced oxidation. The addition of increasing amounts of HOCl resulted in consumption of HE, with complete loss occurring at equimolar amounts of oxidant and substrate (Fig. 2D). Concomitant with HE consumption, different products were detected. As judged by peak area, the major products were E+ and E+-E+, although the latter formed only at high concentrations of HOCl (Fig. 2D, inset). In addition, m/z 348 formed and reached a maximum at equimolar amounts of HOCl and HE. With excess HOCl, m/z 348 decreased. A m/z 364 signal was detected with increasing HOCl:HE ratios, but its intensity was substantially lower than that of m/z 348 (data not shown) and, therefore, was not characterized further.
Reaction of HE (50 μm) with HOCl also yielded 2-OH-E+, although this product decreased at HOCl concentrations >50 μm (Fig. 2D, inset). As 2-OH-E+ is the specific product of the reaction of HE with O2⨪ (5), we repeated the reaction in the presence of Cu/Zn-superoxide dismutase. As expected, this inhibited formation of 2-OH-E+ (Fig. 2E, inset). As these results suggested the generation of O2⨪ during HOCl-mediated oxidation of HE, we considered DTPA as the source of O2⨪. This is because DTPA was added in these experiments to prevent adventitious metal-dependent reactions (1) and DTPA-derived radicals can react with O2 to give O2⨪ (7). Indeed, DTPA caused a concentration-dependent increase in 2-OH-E+ (Fig. 2F), indicating that 2-OH-E+ was the product of DTPA-derived O2⨪ rather than resulting from HOCl reacting with HE. In contrast to 2-OH-E+, the accumulation of m/z 348, m/z 364, E+ and E+-E+ was unaffected by the addition of superoxide dismutase, indicating that these products were formed as a direct result of HE oxidation by HOCl.
Similar to the situation with HOCl, the addition of taurine chloramine led to a concentration-dependent decrease in HE, although this occurred at a comparatively slower rate than observed with HOCl (Fig. 2G), and only small amounts of m/z 348 and 364 were formed, mainly at supra-stoichiometric amounts of the oxidant. Formation of E+-E+ was not observed, and comparatively (with HOCl) lower and higher yields of E+ and 2-OH-E+, respectively, were observed (Fig. 2D).
Identification of m/z 348 as 2-Cl-E+
After purification by semipreparative HPLC, isolated m/z 348 was subjected to tandem mass spectrometry analysis. We suspected m/z 348 to be a chlorinated E+ compound, as the m/z of the compound was 34 units larger than E+ (m/z 314), as expected for the addition of Cl− and loss of H+. Collision-induced dissociation of m/z 348 yielded a number of fragments, including m/z 320.2, 303, and 284.1, which we assigned to a loss of C2H4, NH3, and HCl, respectively (Fig. 3A and inset).
FIGURE 3.

Structural determination of the chlorinated product formed from the reaction of HOCl with HE. A, MS/MS spectrum of the HPLC purified chlorinated product (m/z 348) from the reaction of HOCl with HE in 100 mm phosphate buffer with 100 μm DTPA (the inset shows theoretical MS/MS fragments of m/z 348). Shown are high resolution 1H NMR (B) and two-dimensional NMR (NOESY) spectra (C) of the HPLC-purified chlorinated product (m/z 348) showing through space correlations.
Assignment of the 1H NMR signals (Fig. 3B) was facilitated by the corresponding two-dimensional COSY spectrum. Identification of the position of Cl− in chlorinated E+ was deduced after the analysis of the two-dimensional NOESY spectrum (Fig. 3C). In particular, the two NH2 signals in the 1H NMR spectrum displayed several distinctive NOESY cross-peaks (indicating protons that are close in space). The resulting NOESY correlation peaks could be attributed only to chlorination at the 2-position on the ring. Together, these results unambiguously identified m/z 348 as 2-Cl-E+.
Finally, we determined the fluorescence properties of 2-Cl-E+, as HE oxidation is commonly assessed by fluorescence. Compared with 2-OH-E+ and E+, 2-Cl-E+ was weakly fluorescent irrespective of whether it was in solution (Fig. 4A) or bound to DNA (Fig. 4B). The emission and excitation maxima of 2-Cl-E+ mirrored those of E+, and they overlapped with those of 2-OH-E+ (Table 2). These results suggest that fluorescence is not suitable to detect 2-Cl-E+, nor can it be used to distinguish 2-Cl-E+ from other HE oxidation products.
FIGURE 4.
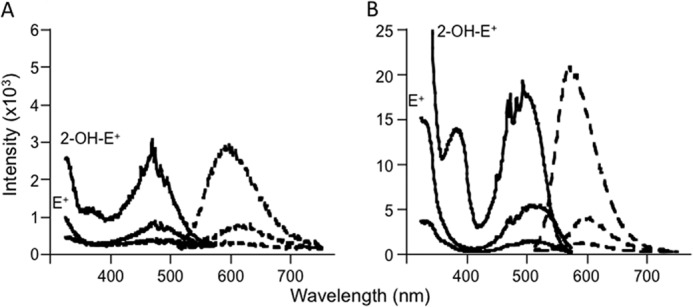
Fluorescence spectral characterization of 2-Cl-E+. A, fluorescence spectra of 10 μm 2-OH-E+ (top lines), E+ (middle lines), and 2-Cl-E+ (bottom lines) in 10 mm Tris buffer, pH 7.4, containing 1 mm EDTA. B, fluorescence spectra of 1 μm 2-OH-E+, E+, or 2-Cl-E+ in the presence of 1 mg/ml DNA (calf thymus) in 10 mm Tris buffer, pH 7.4, containing 1 mm EDTA. Solid lines represent fluorescence excitation spectra, whereas dashed lines represent emission spectra.
TABLE 2.
Fluorescence spectral characteristics of 2-Cl-E+ compared to 2-OH-E+ and E+
Conditions are as described in the legend to Fig. 4.
| HE oxidation products | Excitation maximum |
Excitation maximum |
||
|---|---|---|---|---|
| −DNA | +DNA | −DNA | +DNA | |
| nm | nm | |||
| E+ | 482 | 494 | 615 | 598 |
| 2-OH-E+ | 469 | 511 | 598 | 572 |
| 2-Cl-E+ | 472 | 509 | 605 | 598 |
Mechanistic Studies Related to HOCl-mediated Oxidation of HE to 2-Cl-E+
Although HOCl is a 2e-oxidant, it can also give rise to radicals, e.g. via initial reaction with an amino group followed by homolytic cleavage of the resulting N-Cl bond (36). Therefore, we examined the effect of adding the radical scavenger Trolox® on product formation during HOCl-mediated oxidation of HE. Trolox® does not react efficiently with HOCl. The presence of Trolox® slowed the consumption of HE, but it did not inhibit formation of 2-Cl-E+ (Fig. 5, A and B). However, Trolox® almost completely blocked formation of 2-OH-E+ and E+-E+ (Fig. 5, A and B, insets), confirming previous studies (4) that intermediate radical species are involved in the formation of these HE oxidation products. Similar to the situation with HOCl, the addition of Trolox® to a solution containing taurine chloramine and HE decreased the consumption of HE without affecting 2-Cl-E+ accumulation (Fig. 5, C and D). In this case, however, Trolox® significantly increased the yields of E+ and only slightly decreased 2-OH-E+ (Fig. 5, C and D, insets). Together, these results suggest that formation of 2-Cl-E+ from the reaction of HE with HOCl does not involve a radical mechanism.
FIGURE 5.
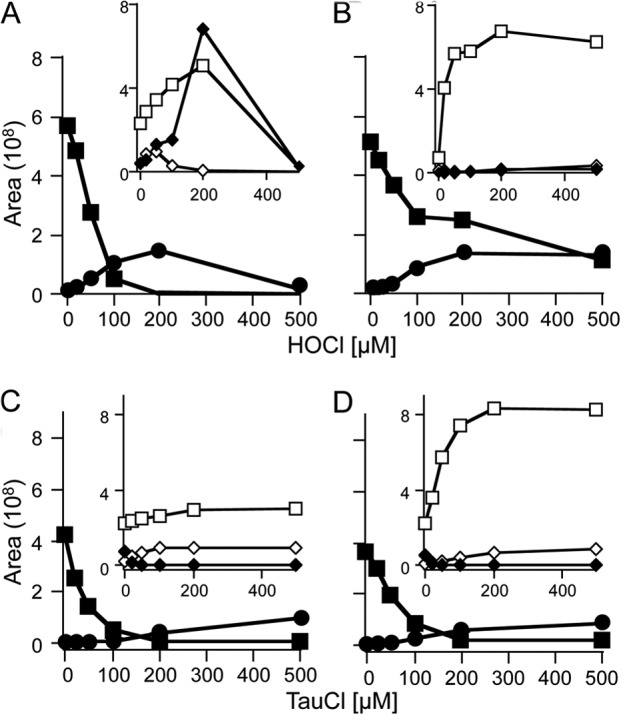
Mechanistic studies related to the formation of 2-Cl-E+ from the reaction of HE with HOCl. HOCl (0–500 μm) was added to HE (100 μm) in 100 mm phosphate buffer, pH 7.4, in the absence (A) or presence (B) of 1 mm Trolox®. Taurine chloramine (TauCl; 0–500 μm) was added to HE (100 μm) in 100 mm phosphate buffer, pH 7.4, in the absence (C) or presence (D) of 1 mm Trolox®. Reaction mixtures were incubated in the dark for 30 min at room temperature before centrifugation at 16,000 × g for 10 min. The resulting supernatants were then analyzed by LC/MS/MS as described under “Experimental Procedures” to determine the areas of HE (■), 2-Cl-E+ (●), 2-OH-E+ (◆), E+ (□), and E+-E+ (♦). Data are representative of three separate experiments.
As HE contains two primary amines, we assessed whether HOCl-mediated formation of 2-Cl-E+ could involve intermediary chloramines. Unfortunately, we were unable to block both amines of HE via methylation. Therefore, we instead used the HE analog NETQ that contains a primary and a tertiary amine and resembles part of HE (Fig. 6A). The addition of HOCl to NETQ (m/z 177.2) resulted in several products, including a peak (peak 4) eluting at ∼9 min that contained m/z 211.1 and 213.2 at a 3:1 ratio (Fig. 6. B and C), indicative of chlorinated NETQ. We then synthesized dimethyl-NETQ (Fig. 6A) in which methyl groups replaced the primary amine hydrogens to generate a tertiary amine. The addition of HOCl to dimethyl-NETQ (peak 1, 6 min in Fig. 6D) resulted in formation of multiple products including a major peak (peak 3) at ∼7 min. MS spectra of peak 3 (bottom spectra, Fig. 6E) indicated that it contained chlorinated products due to its distinct 3:1 isotopic ratio and difference of two mass units of m/z 239.1, 224.1, and 209.1. These ions corresponded to chlorinated dimethyl-NETQ, chlorinated methyl-NETQ, and chlorinated NETQ, respectively, with the latter two ions possibly formed due to in-source fragmentation in the mass spectrometer. These results argue against initial chlorination of the primary amines of HE as the underlying mechanism for formation of 2-Cl-E+ during HOCl-mediated oxidation.
FIGURE 6.

Reaction of HOCl with HE analog. A, Structures of HE, NETQ, and the dimethyl analog of NETQ. B, LC/MS chromatograms of NETQ (100 μm) in 100 mm phosphate buffer containing 100 μm DTPA before (top) and after the addition of 100 μm HOCl (bottom). C, MS spectra of NETQ (top) and of peak 4 at 9 min from the reaction of NETQ with HOCl (bottom). D, LC/MS chromatograms of dimethyl-NETQ (100 μm) in 100 mm phosphate buffer containing 100 μm DTPA (top) and upon the addition of 100 μm HOCl (bottom). E, MS spectra of dimethyl-NETQ (top) and of peak 3 at 7.2 min from the reaction of dimethyl-NETQ with HOCl (bottom).
Assessment of 2-Cl-E+ as a Surrogate Marker for MPO/HOCl Activity
We first compared the accumulation of 2-Cl-E+ with that of 3-Cl-Tyr as a marker for cellular MPO/HOCl activity. 3-Cl-Tyr is commonly considered the gold standard for assessing MPO/HOCl activity (25, 37–39). For this, we activated isolated human PMN and determined the conversion of added HE to 2-Cl-E+ in parallel with cellular levels of 3-Cl-Tyr. Such analyses revealed a 12-fold increase in the levels in 3-Cl-Tyr in activated versus non-activated PMN (Fig. 7, A and C). Similarly, activation of PMN resulted in a 20-fold increase in the content of 2-Cl-E+ (Fig. 7, B and D).
FIGURE 7.

Formation of 2-Cl-E+ by stimulated human PMN. A, isolated human PMN (107) were stimulated with PMA or ethanol (vehicle control) for 1 h at 37 °C. Cells were then lysed, and proteins were precipitated and then hydrolyzed. Tyrosine and 3-Cl-Tyr were measured by LC/MS/MS. The top chromatogram represents vehicle-treated PMN, whereas the middle chromatogram is from PMA-stimulated PMN. The bottom chromatogram represents 3-Cl-Tyr standard. B, isolated human PMN (5–10 × 106) were incubated in HBSS containing 200 ng/ml PMA for 1 h at 37 °C before the addition of 10 μm HE for a further 1 h. Cells were then washed twice with PBS and lysed with 200 μl of 80% v/v ice-cold argon-bubbled ethanol. Five μl of supernatant were then analyzed by LC/MS/MS for 2-Cl-E+ (m/z transition 348 to 320) (middle chromatogram). The top chromatogram represents control cells treated with vehicle (8 μl ethanol) for 1 h at 37 °C, whereas the bottom chromatogram represents purified 2-Cl-E+ standard. C, quantification of 3-Cl-Tyr in PMN (107) stimulated with PMA or ethanol (vehicle control) for 1 h at 37 °C as in B, with data representing the mean ± S.E. of three independent experiments done in duplicate. D, quantification of 2-Cl-E+ in control or stimulated PMN as in A with data representing the mean ± S.E. of three independent experiments. *, p < 0.05 (control versus PMA treatment); Mann Whitney rank sum test. Protein levels were based on levels of 0.1 mg of protein/106 cells, measured in a separate set of samples that was not analyzed for 3-Cl-Tyr or 2-Cl-E+.
We next compared the accumulation of 3-Cl-Tyr with that of 2-Cl-E+ in two mouse models of inflammation. Specificity for MPO was assessed by comparing results from wild-type versus Mpo−/− mice. In the first model inflammation was induced by intraperitoneal injection of zymosan, which causes the recruitment of activated leukocytes within the peritoneum (40). 3-Cl-Tyr was detected in peritoneal cells from all but one wild-type animal at ∼7 pmol/mg of protein, whereas it was absent in cells from Mpo−/− mice (Fig. 8, A and C). The observed extent of tyrosine chlorination, i.e. ∼0.2 3-Cl-Tyr/1000 tyrosine residues, is comparable to that reported previously by others for zymosan-induced peritonitis (41). For the measurement of 2-Cl-E+, mice were injected with HE after recruitment of activated leukocytes into the peritoneum. Peritoneal cells were harvested 60 min after HE administration and then subjected to LC/MS/MS analysis. Similar to the situation with 3-Cl-Tyr, 2-Cl-E+ was detected in phagocytes recruited to the peritoneum of wild-type mice at 17.2 ± 1.5 pmol/mg of protein (Fig. 8, B and D). Formation of 2-Cl-E+ was inhibited by 75% in cells from Mpo−/− mice (Fig. 8, B and D), indicating that it was highly specific for MPO. Activated cells from Mpo−/− mice contained higher levels of 2-OH-E+ than the corresponding wild-type cells (615 ± 197 versus 268 ± 27 pmol/mg of protein, for Mpo−/− and wild-type cells, respectively), indicating that the leukocytes in Mpo−/− mice were as active as those in wild-type animals.
FIGURE 8.
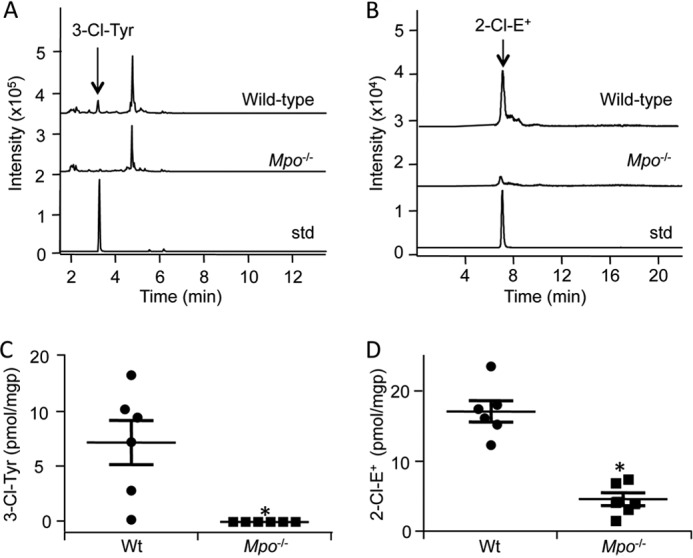
Decrease in the formation of 2-Cl-E+ in peritoneal phagocytes from Zymosan A-treated Mpo−/− mice. To induce peritonitis, wild-type C57BL/6J or Mpo−/− mice were injected intraperitoneally with 250 μl of 5 mg/ml Zymosan A solution in PBS. A, 5 h after induction of peritonitis, peritoneal phagocytes were collected by lavage as under “Experimental Procedures.” Cells were then lysed, and proteins were precipitated and hydrolyzed for LC/MS/MS detection of Tyr and 3-Cl-Tyr. The top, middle, and bottom chromatograms are representative of wild-type peritoneal cells, Mpo−/− peritoneal cells, and 3-Cl-Tyr standard, respectively. B, 4 h after induction of peritonitis, mice were injected intraperitoneally with 80 μl of 20 mm HE, and peritoneal phagocytes were collected 1 h later by lavage as described under “Experimental Procedures.” Cells were then lysed in 80% ice-cold argon-bubbled ethanol, and the supernatant was analyzed by LC/MS/MS for 2-Cl-E+. The top, middle, and bottom chromatograms are representative of wild-type peritoneal cells, Mpo−/− peritoneal cells, and purified 2-Cl-E+ standard, respectively. C and D, quantification of 3-Cl-Tyr (C) and 2-Cl-E+ (D) in peritoneal phagocytes from wild-type (●) or Mpo−/− (■) mice treated as described in A and B, respectively. Protein levels were calculated based on 0.032 ± 0.005 mg of protein/106 cells, measured in a separate set of samples that was not analyzed for 3-Cl-Tyr or 2-Cl-E+. Data represent the mean ± S.E. of n ≥ 5. *, p < 0.05 (wild-type versus Mpo−/−); Mann Whitney rank sum test.
As a second model of inflammation, we applied a non-occlusive cuff to the femoral artery, known to cause acute and then sustained vascular inflammation characterized by arterial infiltration of predominantly PMN (29, 42, 43). Indeed, within 24 h large numbers of inflammatory cells infiltrated the left femoral artery around which a cuff was placed, and leukocytes remained present in the “cuffed” artery for up to 14 days (Fig. 9A). Such an inflammatory response was absent in the corresponding sham-operated right femoral artery. Despite the strong inflammatory response, arterial levels of 3-Cl-Tyr did not increase significantly. Indeed, 3-Cl-Tyr could not be detected in most cuffed or sham arteries of wild-type and Mpo−/− mice, especially at days 5, 7, and 14 post-surgery (Fig. 9B).
FIGURE 9.

Detection of 2-Cl-E+ in a mouse model of arterial inflammation. A non-occlusive cuff was placed around the femoral artery of wild-type C57BL/6J mice for 1, 2, 5, 7, or 14 days before HE (80 μl of 20 mm) was administered by intravenous injection. A, hematoxylin and eosin-stained sections of sham (left) and cuff-injured (right) femoral arteries from wild-type mice at days 1, 2, 5, 7, and 14 post-surgery. Inflammatory cell infiltration is seen in the adventitia (arrows). B, levels (pmol/mg of protein) of 3-Cl-Tyr, 2-Cl-E+, 2-OH-E+, and E+ in sham (●) and cuff-injured (○) arteries were analyzed by LC/MS/MS as described under “Experimental Procedures.” ▵ represents levels of 2-Cl-E+ in plasma of wild-type mice after cuff-surgery. Protein levels were based on levels of 0.039 ± 0.005 mg of protein/1-mg arterial tissue wet weight, measured in a separate set of samples. C, levels of 2-Cl-E+ (pmol/mg of protein) in sham (black columns) and cuff-injured (gray columns) femoral artery sections of wild-type and Mpo−/− mice at day 14 post-surgery were analyzed by LC/MS/MS as described under “Experimental Procedures.” D, hematoxylin and eosin-stained sections of cuff-injured femoral arteries from wild-type and Mpo−/− mice at day 14 post-surgery. E, levels of 2-OH-E+ (pmol/mg of protein) in sham (black columns) and cuff-injured (gray columns) femoral artery sections of wild-type and Mpo−/− mice at day 14 post-surgery were analyzed by LC/MS/MS as described under “Experimental Procedures.” F, representative LC/MS/MS chromatograms of cuff-operated femoral artery homogenate (day 14 after surgery) showing a clear peak for 2-Cl-E+ (top chromatogram). No peak was visible for 2-Cl-E+-d5 (m/z 353 → 318) in the same sample (bottom chromatogram). Data represent the mean ± S.E. of n ≥ 5. *, p < 0.05, using two-way analysis of variance with Bonferroni post-hoc analysis.
The above results suggested that the leukocytes infiltrating the cuffed artery were either not activated or that the resulting increase in MPO/HOCl activity was insufficient to be detected by measuring tissue 3-Cl-Tyr. We, therefore, administered HE to mice via intravenous injection on different days after cuff placement, isolated blood and arteries, and analyzed these for 2-Cl-E+ and 2-OH-E+. Such analyses showed that no or little 2-Cl-E+ was detected in plasma or sham artery (Fig. 9B). In contrast, 2-Cl-E+ was present in inflamed arterial segments of wild-type mice, and levels increased and reached significance at 5, 7, and 14 days post cuff placement (Fig. 9B). 2-OH-E+ also increased in inflamed compared with control arteries (Fig. 9B), reaching significance at days 7 and 14. In contrast, there was no significant difference in the concentration of E+ between inflamed and non-inflamed sham arteries (Fig. 9B). Importantly, 2-Cl-E+ was not detected in inflamed (or non-inflamed) arterial segments of Mpo−/− mice (Fig. 9C), although arterial inflammation was comparable with that seen in wild-type mice (Fig. 9D). In addition, arterial leukocytes were activated, as indicated by the comparable levels of tissue 2-OH-E+ between wild-type and Mpo−/− mice (Fig. 9E).
We then examined whether the 2-Cl-E+ detected in inflamed arteries could be an artifact arising as a result of tissue processing. For this we synthesized deuterated HE (HE-d5) (Scheme 2). LC/MS analysis confirmed that the reaction of HOCl with HE-d5 (m/z 321) yields 2-Cl-E+-d5 (m/z 353) (data not shown). Next, HE-d5 was added to inflamed femoral arteries after isolation from wild-type mice 14 days after cuff placement, and the tissue was then processed and subjected to LC/MS/MS analysis. 2-Cl-E+-d5 (transition, m/z 353 → 318) was not detected in such samples even though 2-Cl-E+ (transition, m/z 348 → 318) and 2-OH-E+ (transition, m/z 330→300) were present (Fig. 9F). These results indicate that 2-Cl-E+ was not formed ex vivo during tissue processing.
SCHEME 2.
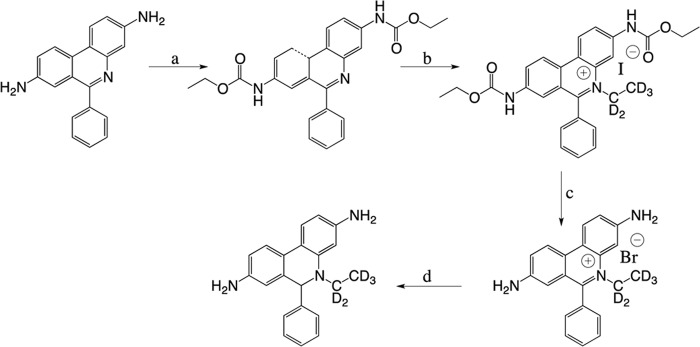
Synthesis of HE-d5. a, ethyl chloroformate, pyridine, room temperature, 5 h, 99% yield. b, iodoethane-d5, nitromethane, 100 °C, 7 days, 58% yield. c, 48% HBr, reflux, 16 h, 89% yield. d, NaBH4, methanol, room temperature, 10 min, 70% yield.
Finally, we examined the time course of 2-Cl-E+ formation and its possible metabolism in the arterial inflammation model by varying the time of tissue collection after HE administration. Seven days post cuff placement, HE was administered to wild-type mice, and tissue was collected 30, 45, or 60 min later. Arterial levels of 2-Cl-E+ increased modestly (Fig. 10A), whereas 2-OH-E+ persisted at comparable concentrations over this time period (Fig. 10B). Importantly, 2-Cl-E+ was not detected in plasma or sham control arteries irrespective of when tissue was collected (Fig. 10A). In contrast, 2-OH-E+ was detected in plasma and sham arteries (Fig. 10B). As expected, HE was detected in plasma, but it was undetectable in arteries (control or inflamed; data not shown). The reason for this is not clear, although one interpretation is that the rate with which HE “enters” arteries is exceeded by the rate at which arterial HE becomes oxidized to E+, 2-OH-E+, and 2-Cl-E+. Together, these results indicate that leukocyte infiltration into the cuffed artery was associated with their activation and resulting formation of O2⨪ and HOCl and that the 2-Cl-E+ detected was likely formed in the inflamed artery rather than the circulation.
FIGURE 10.
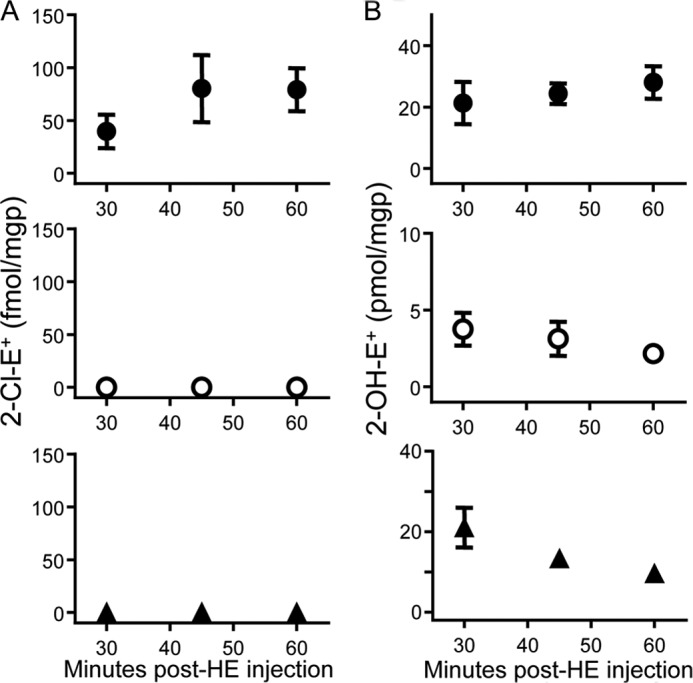
Time course of formation of 2-Cl-E+ and 2-OH-E+ in a mouse model of arterial inflammation. A non-occlusive cuff was placed around the femoral artery of wild-type C57BL/6J mice for 7 days before HE (80 μl of 20 mm) was administered by intravenous injection. Blood and cuffed (inflamed) and contralateral non-cuffed (sham, non-inflamed) arteries were then collected after the time indicated and analyzed for 2-Cl-E+ (A) and 2-OH-E+ (B) in inflamed arteries (●), sham arteries (○), and plasma (▴) by LC/MS/MS as described under “Experimental Procedures.” Data represent the mean ± S.E. of n ≥ 4.
DISCUSSION
Currently, 3-Cl-Tyr is the gold standard for the assessment of MPO activity in vivo, although the rate of oxidation of tyrosine by HOCl is low and the product of the reaction, 3-Cl-Tyr, subject to further oxidation as well as metabolism. Here we show that 2-Cl-E+ is the specific product of the reaction of HE with HOCl and chloramines and that the conversion of added HE to 2-Cl-E+ is a specific and sensitive additional measure of MPO activity in vivo.
The present study for the first time identifies 2-Cl-E+ as the major chlorinated species formed upon reaction of HE with HOCl and chloramines. Mechanistic studies with reagent HOCl suggest that formation of 2-Cl-E+ likely occurs via direct electrophilic attack on the ortho C2 position of HE (Scheme 3). Radical intermediates are unlikely involved, as the addition of the radical scavenger Trolox® did not inhibit 2-Cl-E+ formation. This is consistent with our results from experiments with the HE analog NETQ (Fig. 6) that argue against the formation of primary chloramines being required for HOCl-mediated conversion of HE to 2-Cl-E+. Halogenation commonly occurs at carbon atoms positioned ortho or para to an aromatic unsubstituted amine (aniline) (44). In the case of HE, the ortho positions are doubly activated for electrophilic attack due to the presence of the primary and tertiary amines, and the para position cannot be substituted. Chlorination at the ortho position closest to the N-ethyl group (C4) is less likely to occur compared with C2 substitution due to steric hindrance. However, from our experiments with NETQ, we cannot exclude initial chlorination of the tertiary amine during the conversion of HE to 2-Cl-E+. Indeed, tertiary chloramines have been proposed as intermediates in HOCl-mediated chlorination of guanosine (45), although in the case of HE a tertiary chloramine may deactivate the ring for subsequent chlorination at the C2 position to the primary amine.
SCHEME 3.
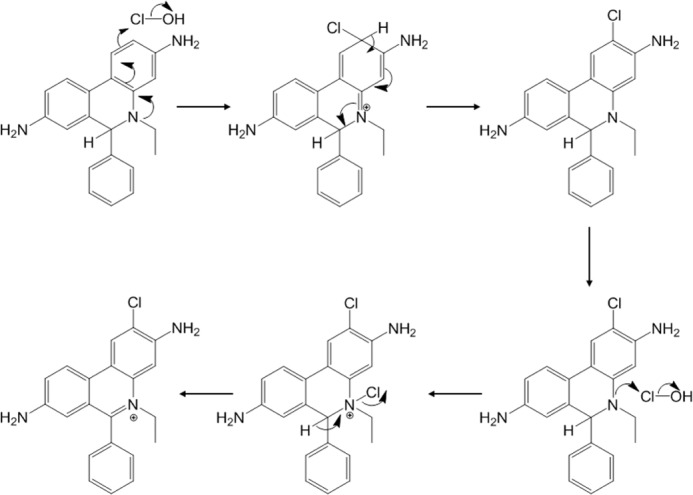
Proposed mechanism for the formation of 2-Cl-E+ from the reaction of HOCl with HE.
Our results suggest that the formation of 2-Cl-E+ from HE is specific for the chlorinating activity of MPO, the major source of HOCl and chloramines in mammalian systems. This is because 2-Cl-E+ was not detected when HE was exposed to other biologically relevant oxidants. Furthermore, applying the inflammation models to wild-type and Mpo−/− mice identified 2-Cl-E+ as a specific marker for MPO activity/HOCl in vivo. Thus, compared with wild-type animals, formation of 2-Cl-E+ was either absent (arterial inflammation) or substantially decreased (peritonitis) in Mpo−/− mice. The low level of 2-Cl-E+ remaining in the Mpo−/− mice in the peritonitis model was surprising, although previous studies reported remaining iodination activity in neutrophils and monocytes of MPO-deficient subjects (46–48) and very low levels of 3-Cl-Tyr (49). Thus, peritoneal cells from Mpo−/− mice may contain a halogenating enzyme(s) other than MPO capable to convert HE to 2-Cl-E+. Vascular peroxidase-1 (VPO1) has recently been reported to be a new member of peroxidases able to form hypohalous acids, including HOCl (50). We did not further investigate the apparent MPO-independent chlorinating activity in the peritonitis model. However, our results indicate that VPO1 is not likely an important source of chlorinating activity in the vascular inflammation model because MPO deficiency resulted in complete absence of detectable 2-Cl-E+ in the inflamed arteries despite the apparent presence of O2⨪-generating leukocytes.
Measuring MPO activity in vivo is important to understanding its effects in health and disease, and different strategies have been employed to detect MPO activity/HOCl. A recently published method (51) uses an antibody to capture MPO from tissues and then assesses peroxidase activity using Amplex® Red as peroxidase substrate. However, this method at best detects MPO activity only ex vivo, and its specificity is questionable because oxidation of Amplex® Red is facilitated by peroxidases other than MPO. For example, horseradish peroxidase (52) and the peroxidase activity of cytochrome c in apoptotic cells (53) readily oxidize Amplex® Red. The above illustrates the complexities and pitfalls associated with the determination of MPO/HOCl activity in vivo. In addition to specificity, several factors need to be considered. These include: (i) the “availability” of the oxidant and the “probe” used to detect the oxidant; (ii) the rate of reaction of the oxidant with the probe; (iii) the stability of the products with regard to additional chemical oxidation as well as in vivo metabolism.
In addition to tyrosine, a number of endogenous probes have been used to assess MPO activity/HOCl in vivo, including chlorinated DNA bases (39) and lipids such as chlorohydrins (39) and chlorinated plasmalogen (54). A major focus of the present study was to compare the “endogenous probe” tyrosine with exogenously added HE in conjunction with the LC/MS/MS analysis of 3-Cl-Tyr and 2-Cl-E+, respectively, as surrogate measures of MPO activity. We limited our comparison to 3-Cl-Tyr, as this biomarker is widely regarded as the gold standard for detection of in vivo MPO activity. Overall, this comparison gave comparable results as judged by employing three models of inflammation. Most importantly, substantially higher concentrations of chlorinated products of both probes were detected in wild-type compared with Mpo−/− mice. This confirms (for 3-Cl-Tyr) and establishes (for 2-Cl-E+) biological specificity in vivo. In activated human PMN, cellular concentrations of 3-Cl-Tyr reached ∼25 pmol/mg of protein compared with ∼200 pmol of 2-Cl-E+ per mg of protein (Fig. 7). Somewhat lower concentrations of both markers were measured in the peritonitis model in vivo. In inflamed arteries 2-Cl-E+ was detected at substantially lower levels (i.e. fmol/mg of protein), whereas 3-Cl-Tyr was barely detectable, i.e. in only 10% of arteries irrespective of whether they were inflamed or not (Fig. 9). We interpret the findings as indicative of the 2-Cl-E+ method having greater sensitivity than the 3-Cl-Tyr method. This interpretation is consistent with the lower limit of detection for 2-Cl-E+ (1.4 fmol) than 3-Cl-Tyr (37 fmol). It is also consistent with (i) our observation (Table 1) that HOCl reacts with HE about 4 orders of magnitude faster than it oxidizes tyrosine (18) and (ii) consistent with the arterial concentration of tyrosine, determined to be only 2 orders greater than the concentration of the probe, estimated from the sum of arterial E+, 2-OH-E+, and 2-Cl-E+. The kinetic differences between tyrosine and HE may become particularly relevant in conditions of low chlorinating activity, as in the arterial inflammation model. Under such conditions, endogenous substrates other than tyrosine may simply “outcompete” the amino acid for reaction with HOCl. Indeed, it has been suggested previously that tissue levels of 3-Cl-Tyr underestimate MPO/HOCl activity (18).
In addition to these kinetic arguments, other processes such as hyperoxidation (19, 20) and de-chlorination or metabolism (21, 55) could have conceivably contributed to our inability to detect 3-Cl-Tyr in inflamed arteries. Examination of inflamed arterial tissue for dichlorinated species and 4-hydroxyphenylacetaldehydes (19, 20) may be useful to assess a potential contribution of tyrosine hyperoxidation. We have not investigated the possible presence of dechlorinating activity in our model, just as we currently cannot exclude the possibility that 2-Cl-E+ is subject to dechlorination in vivo, similar to 3-Cl-Tyr. However, it is important to recollect that tissue concentrations of 3-Cl-Tyr reflect a steady state situation that is determined by the rates of formation and removal of 3-Cl-Tyr. Also, they do not necessarily reflect “ongoing chlorination activity” at the time of tissue sampling, and this could be particularly relevant in conditions of chronic inflammation as is the case in the cuff model of arterial inflammation. By comparison, oxidation of hydroethidine to 2-Cl-E+ occurring within the 60-min time window between probe administration and tissue collection, reflects a more acute process and thus more likely assesses ongoing chlorinating activity. For models of chronic inflammation, the presence for 60 min of exogenously added hydroethidine is not expected to impact on the underlying inflammatory processes. For models of more acute inflammation (that develop within 60 min), hydroethidine could conceivably interfere with underlying inflammatory processes. To assess this possibility we determined O2 consumption by PMA-stimulated human PMN ± 20 μm HE as a measure of NADPH oxidase activity. The presence of HE did not materially affect the increase in O2 consumption (data not shown), indicating that under the conditions tested, the probe did not interfere with this key redox process of inflammation.
A considerable advantage of the LC/MS/MS assay described for HE oxidation is that it can simultaneously provide information on the presence of several different reactive species in vivo. The latter include HOCl, chloramines (2-Cl-E+), and O2⨪ (2-OH-E+) and may extend to hypobromous acid and peroxynitrite. This is because preliminary studies suggest that these oxidants convert HE to bromo- and nitro-ethidium, respectively (data not shown).
However, the method described here also has a number of limitations and pitfalls that need to be considered carefully for different applications. First, the low fluorescence of 2-Cl-E+ combined with the overlap of its fluorescence spectra with that of 2-OH-E+ and E+ eliminates fluorescence as a suitable method for detecting 2-Cl-E+ in biological samples. Also, the in vivo metabolism of 2-Cl-E+ has not been fully examined, although our data in the vascular inflammation model (Fig. 10) suggest that within the 60 min that tissues are subjected to HE, levels of 2-Cl-E+ do not decrease with time. However, it is likely that at high HOCl to HE ratios (Fig. 5A) HE is oxidized beyond 2-Cl-E+, as has also been reported for 3-Cl-Tyr (55, 56). In addition, care needs to be taken in evaluating the possibility that administered HE is oxidized during its transport to, rather than in, the tissue of interest. Systemic oxidation of HE to 2-Cl-E+ is, however, not apparent in the arterial inflammation model (see above) and in the peritonitis model, where HE was administered directly into the peritoneum. Furthermore, the concentrations of 2-Cl-E+ detected in the tissue of interest are relative rather than absolute, as they depend on both local MPO activity and HE concentrations. Therefore, it is important to measure HE as well as 2-Cl-E+ to account for differences in tissue uptake, bioavailability, and perfusion of the probe. Finally, HE cannot be used in humans, as its major oxidation product, ethidium (bromide), is considered mutagenic. This limits the use of HE for the detection of MPO/HOCl activity to cellular, tissue, and animal studies.
In summary, our studies show that 2-Cl-E+ is a specific and sensitive marker of MPO activity/HOCl in vivo. When applied carefully, it offers advantages over the 3-Cl-Tyr assay that will likely allow assessing the contribution of chlorinating activity to inflammatory diseases at an advanced level. Our studies also show that in combination with LC/MS/MS, HE can be used as a multipurpose probe suitable for detection of O2⨪ as well as other biologically relevant oxidants, including HOCl. We suggest the in vitro and in vivo use of multipurpose probes like HE as a useful alternative to using probes aimed at measuring a single specific reactive oxygen or nitrogen species.
Acknowledgments
We thank Dr. Ben Wu, Elaine Chew, and Elaine Lee for technical assistance in H&E staining, tissue processing, and animal surgery, respectively. We also thank Prof. Peter Southwell-Keely for helpful discussions related to the mechanism of HE oxidation by HOCl as well as the Victor Chang Cardiac Research Institute and the University of New South Wales for infrastructure support.
This work was supported by Australian Research Council Discovery Project Grant DP 110102135 (to G. J. M.) and by National Health and Medical Research Council of Australia Program Grant 455395 and Project Grants 1020776 and 1037879 (to R. S.).
- HE
- hydroethidine
- HE-d5
- deuterated hydroethidine
- E+
- ethidium
- 2-Cl-E+
- 2-chloroethidium
- d5-2-Cl-E+
- deuterated 2-chloroethidium
- 3-Cl-Tyr
- 3-chlorotyrosine
- E+-E+
- diethidium
- DTPA
- diethylene triamine pentaacetic acid
- 2-OH-E+
- 2-hydroxyethidium
- •OH
- hydroxyl radical
- MPO
- myeloperoxidase
- Mpo−/−
- myeloperoxidase gene knockout
- NETQ
- N-ethyl-1,2,3,4-tetrahydro-7-quinolinamine hydrochloride
- ONOO−
- peroxynitrite
- PMA
- phorbol 12-myristate 13-acetate
- PMN
- polymorphonuclear leukocytes
- O2⨪
- superoxide anion radical
- tBuOO•
- t-butyl-peroxyl radical
- tBuOOH
- t-butyl-hydroperoxide.
REFERENCES
- 1. Halliwell B., Gutheridge J. M. C. (2007) Free Radicals in Biology and Medicine, 4th Ed., pp. 46–69, Oxford University Press, Oxford, UK [Google Scholar]
- 2. Winterbourn C. C. (2008) Reconciling the chemistry and biology of reactive oxygen species. Nat. Chem. Biol. 4, 278–286 [DOI] [PubMed] [Google Scholar]
- 3. Dikalov S., Griendling K. K., Harrison D. G. (2007) Measurement of reactive oxygen species in cardiovascular studies. Hypertension 49, 717–727 [DOI] [PMC free article] [PubMed] [Google Scholar]
- 4. Zielonka J., Kalyanaraman B. (2010) Hydroethidine- and MitoSOX-derived red fluorescence is not a reliable indicator of intracellular superoxide formation. Another inconvenient truth. Free Radic. Biol. Med. 48, 983–1001 [DOI] [PMC free article] [PubMed] [Google Scholar]
- 5. Zhao H., Joseph J., Fales H. M., Sokoloski E. A., Levine R. L., Vasquez-Vivar J., Kalyanaraman B. (2005) Detection and characterization of the product of hydroethidine and intracellular superoxide by HPLC and limitations of fluorescence. Proc. Natl. Acad. Sci. U.S.A. 102, 5727–5732 [DOI] [PMC free article] [PubMed] [Google Scholar]
- 6. Zhao H., Kalivendi S., Zhang H., Joseph J., Nithipatikom K., Vásquez-Vivar J., Kalyanaraman B. (2003) Superoxide reacts with hydroethidine but forms a fluorescent product that is distinctly different from ethidium. Potential implications in intracellular fluorescence detection of superoxide. Free Radic. Biol. Med. 34, 1359–1368 [DOI] [PubMed] [Google Scholar]
- 7. Zielonka J., Sarna T., Roberts J. E., Wishart J. F., Kalyanaraman B. (2006) Pulse radiolysis and steady-state analyses of the reaction between hydroethidine and superoxide and other oxidants. Arch. Biochem. Biophys. 456, 39–47 [DOI] [PMC free article] [PubMed] [Google Scholar]
- 8. Zielonka J., Zhao H., Xu Y., Kalyanaraman B. (2005) Mechanistic similarities between oxidation of hydroethidine by Fremy's salt and superoxide. Stopped-flow optical and EPR studies. Free Radic. Biol. Med. 39, 853–863 [DOI] [PubMed] [Google Scholar]
- 9. Zielonka J., Srinivasan S., Hardy M., Ouari O., Lopez M., Vasquez-Vivar J., Avadhani N. G., Kalyanaraman B. (2008) Cytochrome c-mediated oxidation of hydroethidine and mito-hydroethidine in mitochondria. Identification of homo- and heterodimers. Free Radic. Biol. Med. 44, 835–846 [DOI] [PMC free article] [PubMed] [Google Scholar]
- 10. Patsoukis N., Papapostolou I., Georgiou C. D. (2005) Interference of non-specific peroxidases in the fluorescence detection of superoxide radical by hydroethidine oxidation. A new assay for H2O2. Anal. Bioanal. Chem. 381, 1065–1072 [DOI] [PubMed] [Google Scholar]
- 11. Daugherty A., Dunn J. L., Rateri D. L., Heinecke J. W. (1994) Myeloperoxidase, a catalyst for lipoprotein oxidation, is expressed in human atherosclerotic lesions. J. Clin. Invest. 94, 437–444 [DOI] [PMC free article] [PubMed] [Google Scholar]
- 12. Stocker R., Keaney J. F., Jr. (2004) Role of oxidative modifications in atherosclerosis. Physiol. Rev. 84, 1381–1478 [DOI] [PubMed] [Google Scholar]
- 13. Hazell L. J., Arnold L., Flowers D., Waeg G., Malle E., Stocker R. (1996) Presence of hypochlorite-modified proteins in human atherosclerotic lesions. J. Clin. Invest. 97, 1535–1544 [DOI] [PMC free article] [PubMed] [Google Scholar]
- 14. Hazen S. L., Heinecke J. W. (1997) 3-Chlorotyrosine, a specific marker of myeloperoxidase-catalyzed oxidation, is markedly elevated in low density lipoprotein isolated from human atherosclerotic intima. J. Clin. Invest. 99, 2075–2081 [DOI] [PMC free article] [PubMed] [Google Scholar]
- 15. O'Donnell C., Newbold P., White P., Thong B., Stone H., Stockley R. A. (2010) 3-Chlorotyrosine in sputum of COPD patients. Relationship with airway inflammation. COPD 7, 411–417 [DOI] [PubMed] [Google Scholar]
- 16. Buss I. H., Senthilmohan R., Darlow B. A., Mogridge N., Kettle A. J., Winterbourn C. C. (2003) 3-Chlorotyrosine as a marker of protein damage by myeloperoxidase in tracheal aspirates from preterm infants. Association with adverse respiratory outcome. Pediatr. Res. 53, 455–462 [DOI] [PubMed] [Google Scholar]
- 17. Kettle A. J., Chan T., Osberg I., Senthilmohan R., Chapman A. L., Mocatta T. J., Wagener J. S. (2004) Myeloperoxidase and protein oxidation in the airways of young children with cystic fibrosis. Am. J. Respir. Crit. Care. Med. 170, 1317–1323 [DOI] [PubMed] [Google Scholar]
- 18. Pattison D. I., Davies M. J. (2001) Absolute rate constants for the reaction of hypochlorous acid with protein side chains and peptide bonds. Chem. Res. Toxicol. 14, 1453–1464 [DOI] [PubMed] [Google Scholar]
- 19. Kettle A. J. (1996) Neutrophils convert tyrosyl residues in albumin to chlorotyrosine. FEBS Lett. 379, 103–106 [DOI] [PubMed] [Google Scholar]
- 20. Fu S., Wang H., Davies M., Dean R. (2000) Reactions of hypochlorous acid with tyrosine and peptidyl-tyrosyl residues give dichlorinated and aldehydic products in addition to 3-chlorotyrosine. J. Biol. Chem. 275, 10851–10858 [DOI] [PubMed] [Google Scholar]
- 21. Mani A. R., Ippolito S., Moreno J. C., Visser T. J., Moore K. P. (2007) The metabolism and dechlorination of chlorotyrosine in vivo. J. Biol. Chem. 282, 29114–29121 [DOI] [PubMed] [Google Scholar]
- 22. Zielonka J., Hardy M., Kalyanaraman B. (2009) HPLC study of oxidation products of hydroethidine in chemical and biological systems. Ramifications in superoxide measurements. Free Radic. Biol. Med. 46, 329–338 [DOI] [PMC free article] [PubMed] [Google Scholar]
- 23. Vivero-Escoto J. L., Slowing I. I., Lin V. S. (2010) Tuning the cellular uptake and cytotoxicity properties of oligonucleotide intercalator-functionalized mesoporous silica nanoparticles with human cervical cancer cells HeLa. Biomaterials 31, 1325–1333 [DOI] [PubMed] [Google Scholar]
- 24. Radi R., Beckman J. S., Bush K. M., Freeman B. A. (1991) Peroxynitrite oxidation of sulfhydryls. The cytotoxic potential of superoxide and nitric oxide. J. Biol. Chem. 266, 4244–4250 [PubMed] [Google Scholar]
- 25. Gaut J. P., Byun J., Tran H. D., Heinecke J. W. (2002) Artifact-free quantification of free 3-chlorotyrosine, 3-bromotyrosine, and 3-nitrotyrosine in human plasma by electron capture-negative chemical ionization gas chromatography mass spectrometry and liquid chromatography-electrospray ionization tandem mass spectrometry. Anal. Biochem. 300, 252–259 [DOI] [PubMed] [Google Scholar]
- 26. Ross S. A., Pitie M., Meunier B. (2000) A straightforward preparation of primary alkyl triflates and their utility in the synthesis of derivatives of ethidium. J. Chem. Soc. Perkin Trans. 1 4, 571–574 [Google Scholar]
- 27. Kundu K., Knight S. F., Lee S., Taylor W. R., Murthy N. (2010) A significant improvement of the efficacy of radical oxidant probes by the kinetic isotope effect. Angew. Chem. Int. Ed. 49, 6134–6138 [DOI] [PMC free article] [PubMed] [Google Scholar]
- 28. Stocker R., Winterhalter K. H., Richter C. (1982) Increased fluorescence polarization of 1,6-diphenyl-1,3,5-hexatriene in the phorbol myristate acetate-stimulated plasma membrane of human neutrophils. FEBS Lett. 144, 199–203 [DOI] [PubMed] [Google Scholar]
- 29. Moroi M., Zhang L., Yasuda T., Virmani R., Gold H. K., Fishman M. C., Huang P. L. (1998) Interaction of genetic deficiency of endothelial nitric oxide, gender, and pregnancy in vascular response to injury in mice. J. Clin. Invest. 101, 1225–1232 [DOI] [PMC free article] [PubMed] [Google Scholar]
- 30. Witting P. K., Pettersson K., Letters J., Stocker R. (2000) Site-specific antiatherogenic effect of probucol in apolipoprotein E-deficient mice. Arterioscler. Thromb. Vasc. Biol. 20, E26–E33 [DOI] [PubMed] [Google Scholar]
- 31. Suarna C., Dean R. T., May J., Stocker R. (1995) Human atherosclerotic plaque contains both oxidized lipids and relatively large amounts of α-tocopherol and ascorbate. Arterioscler. Thromb. Vasc. Biol. 15, 1616–1624 [DOI] [PubMed] [Google Scholar]
- 32. Kettle A. J., Winterbourn C. C. (1994) Assays for the chlorination activity of myeloperoxidase. Methods Enzymol. 233, 502–512 [DOI] [PubMed] [Google Scholar]
- 33. Talib J., Pattison D. I., Harmer J. A., Celermajer D. S., Davies M. J. (2012) High plasma thiocyanate levels modulate protein damage induced by myeloperoxidase and perturb measurement of 3-chlorotyrosine. Free Radic. Biol. Med. 53, 20–29 [DOI] [PubMed] [Google Scholar]
- 34. Zielonka J., Vasquez-Vivar J., Kalyanaraman B. (2008) Detection of 2-hydroxyethidium in cellular systems. A unique marker product of superoxide and hydroethidine. Nat. Protoc. 3, 8–21 [DOI] [PubMed] [Google Scholar]
- 35. Folkes L. K., Candeias L. P., Wardman P. (1995) Kinetics and mechanisms of hypochlorous acid reactions. Arch. Biochem. Biophys. 323, 120–126 [DOI] [PubMed] [Google Scholar]
- 36. Hawkins C. L., Davies M. J. (1999) Hypochlorite-induced oxidation of proteins in plasma. Formation of chloramines and nitrogen-centred radicals and their role in protein fragmentation. Biochem. J. 340, 539–548 [PMC free article] [PubMed] [Google Scholar]
- 37. Podrez E. A., Abu-Soud H. M., Hazen S. L. (2000) Myeloperoxidase-generated oxidants and atherosclerosis. Free Radic. Biol. Med. 28, 1717–1725 [DOI] [PubMed] [Google Scholar]
- 38. Winterbourn C. C., Kettle A. J. (2000) Biomarkers of myeloperoxidase-derived hypochlorous acid. Free Radic. Biol. Med. 29, 403–409 [DOI] [PubMed] [Google Scholar]
- 39. Kettle A. J., Albrett A. M., Chapman A. L., Dickerhof N., Forbes L. V., Khalilova I., Turner R. (2014) Measuring chlorine bleach in biology and medicine. Biochim. Biophys. Acta 1840, 781–793 [DOI] [PubMed] [Google Scholar]
- 40. Cash J. L., White G. E., Greaves D. R. (2009) Zymosan-induced peritonitis as a simple experimental system for the study of inflammation. Methods Enzymol. 461, 379–396 [DOI] [PubMed] [Google Scholar]
- 41. Brennan M.-L., Wu W., Fu X., Shen Z., Song W., Frost H., Vadseth C., Narine L., Lenkiewicz E., Borchers M. T., Lusis A. J., Lee J. J., Lee N. A., Abu-Soud H. M., Ischiropoulos H., Hazen S. L. (2002) A tale of two controversies. Defining both the role of peroxidases in nitrotyrosine formation in vivo using eosinophil peroxidase and myeloperoxidase deficient mice, and the nature of peroxidase-generated reactive nitrogen species. J. Biol. Chem. 277, 17415–17427 [DOI] [PubMed] [Google Scholar]
- 42. Van Put D. J., Van Osselaer N., De Meyer G. R., Andries L. J., Kockx M. M., De Clerck L. S., Bult H. (1998) Role of polymorphonuclear leukocytes in collar-induced intimal thickening in the rabbit carotid artery. Arterioscler. Thromb. Vasc. Biol. 18, 915–921 [DOI] [PubMed] [Google Scholar]
- 43. Kockx M. M., De Meyer G. R., Andries L. J., Bult H., Jacob W. A., Herman A. G. (1993) The endothelium during cuff-induced neointima formation in the rabbit carotid artery. Arterioscler. Thromb. Vasc. Biol. 13, 1874–1884 [DOI] [PubMed] [Google Scholar]
- 44. Clayden J., Greeves N., Warren S., Wothers P. (2006) Organic Chemistry, 6th Ed., Oxford University Press, Oxford [Google Scholar]
- 45. Masuda M., Suzuki T., Friesen M. D., Ravanat J.-L., Cadet J., Pignatelli B., Nishino H., Ohshima H. (2001) Chlorination of guanosine and other nucleosides by hypochlorous acid and myeloperoxidase of activated human neutrophils. J. Biol. Chem. 276, 40486–40496 [DOI] [PubMed] [Google Scholar]
- 46. Pincus S. H., Klebanoff S. J. (1971) Quantitative leukocyte iodination. N. Engl. J. Med. 284, 744–750 [DOI] [PubMed] [Google Scholar]
- 47. Lehrer R. I. (1972) Functional aspects of a second mechanism of candidacidal activity by human neutrophils. J. Clin. Invest. 51, 2566–2572 [DOI] [PMC free article] [PubMed] [Google Scholar]
- 48. Locksley R. M., Wilson C. B., Klebanoff S. J. (1983) Increased respiratory burst in myeloperoxidase-deficient monocytes. Blood 62, 902–909 [PubMed] [Google Scholar]
- 49. Brennan M.-L., Anderson M. M., Shih D. M., Qu X.-D., Wang X., Mehta A. C., Lim L. L., Shi W., Hazen S. L., Jacob J. S., Crowley J. R., Heinecke J. W., Lusis A. J. (2001) Increased atherosclerosis in myeloperoxidase-deficient mice. J. Clin. Invest. 107, 419–430 [DOI] [PMC free article] [PubMed] [Google Scholar]
- 50. Li H., Cao Z., Zhang G., Thannickal V. J., Cheng G. (2012) Vascular peroxidase 1 catalyzes the formation of hypohalous acids. Characterization of its substrate specificity and enzymatic properties. Free. Radic. Biol. Med. 53, 1954–1959 [DOI] [PMC free article] [PubMed] [Google Scholar]
- 51. Pulli B., Ali M., Forghani R., Schob S., Hsieh K. L., Wojtkiewicz G., Linnoila J. J., Chen J. W. (2013) Measuring myeloperoxidase activity in biological samples. PLoS ONE 8, e67976. [DOI] [PMC free article] [PubMed] [Google Scholar]
- 52. Zhou M., Diwu Z., Panchuk-Voloshina N., Haugland R. P. (1997) A stable nonfluorescent derivative of desorufin for the fluorometric determination of trace hydrogen peroxide. Applications in detecting the activity of phagocyte NADPH oxidase and other oxidases. Anal. Biochem. 253, 162–168 [DOI] [PubMed] [Google Scholar]
- 53. Kapralov A. A., Kurnikov I. V., Vlasova I. I., Belikova N. A., Tyurin V. A., Basova L. V., Zhao Q., Tyurina Y. Y., Jiang J., Bayir H., Vladimirov Y. A., Kagan V. E. (2007) The hierarchy of structural transitions induced in cytochrome c by anionic phospholipids determines its peroxidase activation and selective peroxidation during apoptosis in cells. Biochemistry 46, 14232–14244 [DOI] [PubMed] [Google Scholar]
- 54. Wang W.-Y., Albert C. J., Ford D. A. (2013) Approaches for the analysis of chlorinated lipids. Anal. Biochem. 443, 148–152 [DOI] [PMC free article] [PubMed] [Google Scholar]
- 55. Whiteman M., Spencer J. P. (2008) Loss of 3-chlorotyrosine by inflammatory oxidants. Implications for the use of 3-chlorotyrosine as a bio-marker in vivo. Biochem. Biophys. Res. Commun. 371, 50–53 [DOI] [PubMed] [Google Scholar]
- 56. Curtis M. P., Hicks A. J., Neidigh J. W. (2011) Kinetics of 3-chlorotyrosine formation and loss due to hypochlorous acid and chloramines. Chem. Res. Toxicol. 24, 418–428 [DOI] [PubMed] [Google Scholar]