

Background: HCN channels influence neuronal excitability.
Results: Filamin-A (FLNa) facilitated selective, reversible dynamin-dependent internalization of HCN1 and reduced Ih. In hippocampal neurons, dominant-negative FLNa enhanced native HCN1, and decoy peptides disrupting HCN1-FLNa binding reduced channel clustering and augmented endogenous Ih.
Conclusion: FLNa modulates neuronal excitability via dynamin-mediated HCN1 endocytosis.
Significance: Novel roles for FLNa in mature neuronal function are presented.
Keywords: Actin, Endocytosis, Ion Channels, Neurons, Trafficking, HCN, Ih, Filamin A
Abstract
The actin-binding protein filamin A (FLNa) regulates neuronal migration during development, yet its roles in the mature brain remain largely obscure. Here, we probed the effects of FLNa on the regulation of ion channels that influence neuronal properties. We focused on the HCN1 channels that conduct Ih, a hyperpolarization-activated current crucial for shaping intrinsic neuronal properties. Whereas regulation of HCN1 channels by FLNa has been observed in melanoma cell lines, its physiological relevance to neuronal function and the underlying cellular pathways that govern this regulation remain unknown. Using a combination of mutational, pharmacological, and imaging approaches, we find here that FLNa facilitates a selective and reversible dynamin-dependent internalization of HCN1 channels in HEK293 cells. This internalization is accompanied by a redistribution of HCN1 channels on the cell surface, by accumulation of the channels in endosomal compartments, and by reduced Ih density. In hippocampal neurons, expression of a truncated dominant-negative FLNa enhances the expression of native HCN1. Furthermore, acute abrogation of HCN1-FLNa interaction in neurons, with the use of decoy peptides that mimic the FLNa-binding domain of HCN1, abolishes the punctate distribution of HCN1 channels in neuronal cell bodies, augments endogenous Ih, and enhances the rebound-response (“voltage-sag”) of the neuronal membrane to transient hyperpolarizing events. Together, these results support a major function of FLNa in modulating ion channel abundance and membrane trafficking in neurons, thereby shaping their biophysical properties and function.
Introduction
Filamin A (FLNa)2 is an actin-binding protein that stabilizes the cytoskeleton by cross-linking filamentous actin (1, 2). FLNa has been studied extensively at early stages of brain development, when it plays crucial roles in structural organization and neuronal migration (3, 4). However, despite its wide distribution in the adult brain (5, 6), very little is known about the function of FLNa in mature neurons.
Interestingly, interaction of FLNa with several ion channels and receptors has been described, leading to altered trafficking and function in several cell types (7). Here, we explored the nature, mechanisms, and relevance of FLNa to neuronal function by focusing on its interaction with the hyperpolarization-activated cyclic nucleotide-gated (HCN) channels.
HCN channels are a distinct class of ion channels that are widely distributed across the mammalian brain. By conducting the sub-threshold current Ih, these channels regulate neuronal functions such as signal integration in dendrites, oscillatory behavior, and synaptic release (8–12). In view of their pivotal influence on neuronal excitability, it is perhaps not surprising that trafficking and expression of HCN channels are highly regulated. Distinct subcellular distribution patterns of HCN channels characterize different neuronal populations (13, 14), and up- or down-regulation of HCN channel abundance and membrane expression are central to processes of neuronal plasticity (15–19) as well as to pathological conditions (20–22).
In cell lines, a direct, specific interaction between FLNa and the HCN1 channel isoform (the most abundant HCN subunit in the forebrain) has been described. This interaction occurs via a 22-amino acid sequence in the channel C′ terminus, which is absent in all other members of the HCN channel family (23). Overexpression of HCN1 in melanoma cell lines devoid of FLNa resulted in higher Ih amplitude and facilitated gating, implying a restrictive role for FLNa on HCN1 channels (23). Whereas the regulation of HCN1 channels by FLNa in neurons should constitute a novel signaling mechanism between the actin network and ion channels, the presence of such regulation, its mechanisms, and its physiological relevance remain unknown.
Here, we examined the cellular pathways that govern neuronal HCN1 regulation by FLNa and their physiological implications to neuronal function. Our findings support a novel role for FLNa in neurons. By promoting selective dynamin-dependent internalization, FLNa acts to remove HCN1 channels from the membrane and direct them to the endocytic pathway, thereby constraining Ih and altering membrane responses to voltage fluctuations. Thus, FLNa emerges as a potent modulator of neuronal properties by controlling the molecular composition and dynamics of select ion channels on the membrane.
EXPERIMENTAL PROCEDURES
Plasmid cDNA Constructs
A plasmid cDNA construct containing the EGFP sequence at the C terminus of the mouse HCN1 DNA (inserted between amino acids 885 and 886, see Refs. 24, 25) was a gift from Dr. Chetkovich (Northwestern University). The N′-terminal EGFP-fused mouse HCN1 and HCN2 cDNA constructs (HCN1GFP-N′ and HCN2GFP) were gifts from Drs. Santoro and Siegelbaum (Columbia University). An HCN1GFP channel construct lacking the filamin-binding domain (HCN1(Δ22)GFP) was generated by deleting the 22-amino acid sequence (694SPPIQSPLATRTFHYASPTASQ715) in the mouse HCN1 C′ terminus that was previously reported to form the interaction domain (23). The final construct was confirmed by sequencing and yielded functional Ih upon expression in HEK293 cells. Human FLNa with an N-terminal fusion of monomeric DsRed (FLNaDsRed) (26), as obtained via pDsRed-monomer-C1 plasmid (Clontech), was a gift from Dr. Nakamura (Harvard Medical School). This FLNaDsRed plasmid was used as a template to isolate Ig-like domains 23 and 24 of FLNa by PCR with the following primers: 5′-GTGCTCGAGGGGACCCAGGCTTGGTGTC-3′ (FLNa Ig23 forward; possessing an XhoI site, underlined before the start of Ig-like domain 23); 5′-CTTCAATTGAATTCAGGGCACCACAACGCGG-3′ (FLNa Ig24 reverse; containing an EcoRI site, italic, at the regular filamin A stop codon, in bold, followed by an MfeI site, underlined).
The corresponding PCR fragment was restricted with XhoI and MfeI and inserted into the FLNaDsRed plasmid that had been previously cut with XhoI and MfeI. This resulted in plasmid FLNa(23–24)DsRed where monomeric DsRed (225 amino acids) is coupled via a two-amino acid linker (Ser-Arg) to the C-terminal 220 amino acids of human FLNa (encompassing Ig-like domains 23–24). All cDNA constructs used in this study and their nomenclatures are summarized in Table 1.
TABLE 1.
DNA constructs used in this study
| Name | Description | Fluorophore fusion site |
|---|---|---|
| HCN1GFP | EGFP-fused, full-length mouse HCN1 | C′ terminus |
| HCN1GFP-N′ | EGFP-fused, full-length mouse HCN1 | N′ terminus |
| HCN1(Δ22)GFP | EGFP-fused, mouse HCN1 sequence lacking the 22 amino acids that constitute the FLNa-binding domain (amino acids 694–715) | C′ terminus |
| HCN2GFP | EGFP-fused, full-length mouse HCN2 | N′ terminus |
| FLNaDsRed | Monomeric DsRed-fused, full-length human FLNa | N′ terminus |
| FLNamyc | Myc-tagged, full-length human FLNa | N′ terminus |
| FLNa(23–24)DsRed | Monomeric DsRed-fused, truncated human FLNa, containing only the C′ terminus-located Ig-like domains 23 and 24 (consisting of the HCN1-binding region and dimerization domain but lacking the actin-binding domains) | N′ terminus |
HEK293 Cell Culture and Transfection with Plasmid cDNA
Human embryonic kidney 293 (HEK293) cells were maintained in minimum essential medium supplemented with 100 μg/ml penicillin/streptomycin, 2 mm glutamine, and 10% fetal bovine serum. The cells were kept in a humidified atmosphere, at 37 °C and 5% CO2, refreshed every 2–3 days, and passaged upon confluence. All culture reagents were from Invitrogen. Transfection of HEK293 cells with cDNA constructs was performed using the TransIT-LT1 method (Mirus), following the manufacturer's protocol. Briefly, 1–2 days prior to transfection, cells were plated on a 12-mm glass coverslip. Cells were co-transfected with HCN and FLNa constructs using 1.5 μl of Transit-LT1 reagent and 0.3 μg of plasmid cDNA per construct per coverslip (resulting in a 1:1 DNA ratio). All experiments were performed 24–48 h post-transfection. In a subset of experiments, cells were transfected using the calcium-phosphate precipitation method as described previously (27), with the same amounts of plasmid cDNA as detailed above. Notably, the expression patterns of HCN channels and their influence by FLNa were reproducible using either transfection protocol.
Primary Hippocampal Neurons
Primary hippocampal neurons were prepared from brains of postnatal day 0 (P0) Sprague-Dawley rat pups as described previously (25). Following decapitation, hippocampi were dissected and incubated with the protease papain (Worthington) for 30 min at 36 °C. Papain was removed in a series of washes in the presence of the protease inhibitor ovomucoid (Sigma), followed by mechanical trituration. Dissociated cells were plated on 12-mm glass coverslips at a density of 400–600 cells/mm2 and grown at 36 °C (5% CO2). The cultures were maintained in neurobasal medium (NBM) supplemented with B27 (Invitrogen), which was preconditioned for 24 h in glial culture. All experiments were in compliance with National Institutes of Health and University of California at Irvine animal care regulations.
Immunocytochemistry
Cells were fixed by 15-min incubations with PBS solution containing 4% paraformaldehyde on ice, followed by a series of washes with PBS (five times for 5 min). The cell membrane was subsequently permeabilized using a10-min incubation with 0.1% Triton X-100 (with the exception of LAMP1 labeling, in which cells were fixed and permeabilized in methanol for 5 min at −20 °C). Nonspecific interactions were blocked by a 1-h incubation with PBS + 5% normal goat serum + 1% bovine serum albumin (BSA) at room temperature. Primary antibodies were diluted in PBS + 1% BSA and applied overnight at 4 °C. The antibody was removed by a series of washes (three times for 5 min with PBS) followed by incubation with secondary, Alexa (385/488/568/635)-conjugated antibodies (Invitrogen). The secondary antibodies were removed by a series of washes with PBS (three times for 5 min), and cells were mounted on glass microscope slides using Fluoromount G mounting medium (Southern Biotech). Antibodies used in this study included mouse monoclonal anti-LAMP1 (Abcam; clone H4A3; 1:500), mouse monoclonal anti-EEA1 (clone 13; BD Transduction Laboratories; 1:2000), mouse monoclonal anti-FLNa (clone PM6/317; Millipore; 1:1000), guinea pig anti-HCN1 (1:6000) (28), guinea pig anti-HCN2 (a gift from Dr. R. Shigemoto; 1:2000), monoclonal mouse anti-GluA2 (clone 6C2; Pharmingen; 1:250), monoclonal mouse anti-MAP2 (Clone HM-2; Sigma; 1:15,000), and rabbit anti-DsRed (Clontech; 1:500).
Transferrin Uptake Assay
To label recycling endosomes, HEK293 cells expressing HCN1 and FLNa constructs were first starved of transferrin by a 15-min incubation with serum-deficient minimum essential medium, followed by a 1-h incubation with 50 μg/ml Alexa-conjugated transferrin (Invitrogen) at 37 °C. Cells were quickly rinsed with ice-cold PBS, and fixed in 4% paraformaldehyde as described above.
Lentiviral Transduction of FLNa(23–24)DsRed
To generate lentiviral particles, FLNa(23–24)DsRed was excised using AgeI and EcoRI and subcloned into the lentiviral vector plasmid FCK(1.3)GW (29) from which the GFP cDNA had been removed using AgeI and EcoRI. The resulting vector plasmid was co-transfected with pCMV-Δ8.9 and pCMV-VSVg constructs (29) in HEK293T cells using the calcium-phosphate method. Two days post-transfection, the virus-containing supernatant was collected and purified using the Fast-Trap purification kit (Millipore). Hippocampal neurons were transduced by incubation with 10 μl of purified virus for 5 h and fixed at 8–13 days post-infection (>21 DIV).
Confocal Imaging and Analyses
Confocal imaging was performed using an LSM-510 confocal microscope (Zeiss) equipped with an Apochromat 63× oil objective (numeric aperture = 1.40). Samples that contained more than one fluorophore were scanned sequentially using the “multi-track” mode with separate excitation beams as follows: an argon laser at a wavelength of 488 nm for EGFP imaging and a He/Ne laser at 543 nm for DsRed imaging. In immunocytochemical experiments that required a third channel, a He/Ne laser beam at 633 nm was used for far-red imaging, and a two-photon tunable Ti:Sapphire excitation beam set at 760 nm was used for illumination at the UV range. To exclude any possibility for signal bleed through originating from the FLNaDsRed construct, experiments were repeated while expressing EGFP-fused HCN constructs with a mycFLNa construct that does not fluoresce, resulting in similar effects on HCN1 distribution as observed for FLNaDsRed. Images were digitized at 12 bits, in a frame size of 1024 × 1024 pixels. Optical slices were scanned at a thickness of <1 μm. Final image adjustments were performed using ImageJ software (National Institutes of Health, version 1.44); images were background-subtracted using the “BG subtraction from ROI” plugin (M. Cammer and T. Collins) set to a threshold of two standard deviations from the mean pixel intensity. For presentation purposes, a mild median filter (radius = 0.2 pixels) was applied.
Quantitative assessment of signal distribution and clustering (Figs. 3, C–F, 6B, and 8D) was preformed with the Van Steensel's cross-correlation (CCF) method, using the JACoP plugin in ImageJ (30, 31). Pearson's correlation coefficient was calculated for each cell by comparing each image to its own duplicate, while shifting one image across the x axis (δx = ±20 pixels). When δx = 0 (no displacement), CCF values were always equal to 1. However, upon shifting the image across the x axis, the degree of change in CCF values indicates the level of signal homogeneity, with punctate images having a steeper decline in CCF values compared with images with diffuse signal distribution (31). Statistical comparison of CCF values was performed on a δx value of −20 pixels, using one-way ANOVA with Holm-Sidak correction for multiple comparisons or Student's t test.
FIGURE 3.

Filamin-dependent clustering of HCN1 channels. A, confocal images of HEK293 cells expressing HCN1GFP with an empty vector plasmid, as well as HCN1GFP, HCN1(Δ22)GFP, or HCN2GFP alongside the FLNa constructs, as indicated. Co-expression of HCN1GFP with an empty vector resulted in a clustered appearance, which was accentuated upon co-expression of HCN1GFP and FLNa DsRed. In contrast, the distribution pattern of both HCN1(Δ22)GFP and HCN2GFP (co-transfected with FLNaDsRed) was diffuse. Co-expression of HCN1GFP and FLNa(23–24)DsRed abolished the punctate distribution of HCN1GFP. B, comparison of the subcellular distribution of endogenous FLNa, FLNaDsRed, and a FLNa dominant-negative mutant (FLNa(23–24)DsRed) that possess the HCN1-binding domain (Ig domains 23 and 24) but not the actin-binding domains. Note the homogeneous distribution of FLNa(23–24) DsRed, consistent with lack of actin-binding capacity. C–F, quantitative comparison of HCN-channel signal distribution in different conditions, using the van Steensel's CCF. The clustered distribution of HCN1 in the presence of FLNa (shown in all four graphs for comparison purposes) was manifested as a relatively steep change in CCF upon shifting the image on the x axis (see “Experimental Procedures”). In contrast, the CCF distributions of HCN1 (C), HCN1(Δ22)+ FLNa (D), HCN2 + FLNa (E), and HCN1 + FLNa(23–24) (F) were shallower, indicating a more homogeneous distribution of the channels. G, comparison of HCN channel distribution CCF across conditions (one-way ANOVA, F(4, 102) = 8.019; *, p < 0.05; ***, p < 0.001; Holm-Sidak's test). CCF analysis in C–G was performed with n = 20–23 cells per condition, taken from >3 independent experiments. All images are a z-stack representation of confocal optical slices at <1 μm thickness. Scale bars, 10 μm.
FIGURE 6.

FLNa-dependent HCN1 clustering and Ih inhibition are dynamin-dependent and reversible. A, confocal images of HEK293 cells co-expressing HCN1GFP and FLNaDsRed. HCN1 clustering was reduced following incubation with the selective dynamin-inhibitor dynasore. The images are a stacked representation of optical slices (z) with <1 μm thickness per slice. The green channel represents HCN1GFP signal, and insets in magenta represent the signal emitted from FLNaDsRed in the same cell. B, CCF analysis of HCN1 channel distribution following dynasore treatment. Dynasore application lead to a shallower CCF curve, consistent with the observed smooth distribution of HCN1GFP following treatment (n = 22, 23 cells per group, obtained from three separate experiments; Student's t test; p < 0.0001). C, example Ih traces, recorded from HCN1GFP + FLNaDsRed-expressing HEK293 cells pretreated with either vehicle (0.26% DMSO) or dynasore. D and E, quantitative summary of dynasore effects on Ih density in cells expressing either HCN1GFP + FLNaDsRed (D) or HCN1(Δ22)GFP + FLNaDsRed (E). Exposure to dynasore resulted in 2-fold increase of Ih density in HCN1GFP + FLNaDsRed-expressing cells, whereas Ih density in HCN1(Δ22)GFP + FLNaDsRed-expressing cells was unaffected. Numbers on bar histogram in D and E indicate number of recorded cells (n) per condition. *, p < 0.05, Mann-Whitney test.
FIGURE 8.

Redistribution of native HCN1 channels in hippocampal neurons following acute interference with FLNa-HCN1 interaction. A, to acutely interfere with regulation of native HCN1 by FLNa in hippocampal neurons, a myristoylated peptide containing the 22 amino acids that form the FLNa interface in HCN1 (myr-22) was used as decoy. A similar peptide containing a scrambled sequence (myr-Scr) was used as control. B, orthogonal confocal reconstructions of native HCN1 immunoreactive signal in hippocampal neurons. The images represent a single z-slice (XY) and orthogonal views along the YZ and XZ axes. Under control conditions (no treatment), HCN1-positive clusters were visible, often localized to the interior of the soma (indicated by arrowheads). This clustered pattern was greatly reduced following incubation of neurons with 100 nm of the myr-22 peptide (middle panel) but was unaltered following incubation with 100 nm myr-Scr (left). C, dose-dependent effect of myr-22 on HCN1 clustering in neurons. The images depict neurons following incubation with varying concentrations of myr-22 or myr-Scr. Neurons were double-labeled against native HCN1 and the microtubule-associated protein MAP2. The effect of myr-22 on HCN1 distribution was increasingly visible at concentrations higher than 10 nm, whereas no such effect was observed for myr-Scr across concentrations. D, quantitative analysis of HCN1 signal distribution in neurons following incubation of myr-22/myr-Scr peptides at varying concentrations. Note the differences in the cross-correlation function of HCN1 signal at peptide concentrations of 100 nm and 1 μm, indicating reduction in HCN1 clustering following myr-22 application. Analysis was based on n = 20 neurons per condition (total of 200 neurons), taken from four independent experiments. All confocal images represent single <1-μm optical z-slices, acquired using a 63× oil objective with a digital zoom of 3.2, at 1024 × 1024 bit. Scale bars, 10 μm.
Analysis of somatic HCN1 immunoreactivity in hippocampal neurons (Fig. 7) was performed on z-stacked, background-subtracted and thresholded images (see above) by outlining the somatic region of pyramid-shaped neurons and extracting the mean intensity value per soma (ImageJ, National Institutes of Health). For each acquired image, the normalized intensity ratio (Fig. 7D) was calculated by dividing the mean intensity of the channel's immunoreactive signal in FLNa(23–24)-positive neurons by its mean intensity in FLNa(23–24)-negative neurons.
FIGURE 7.
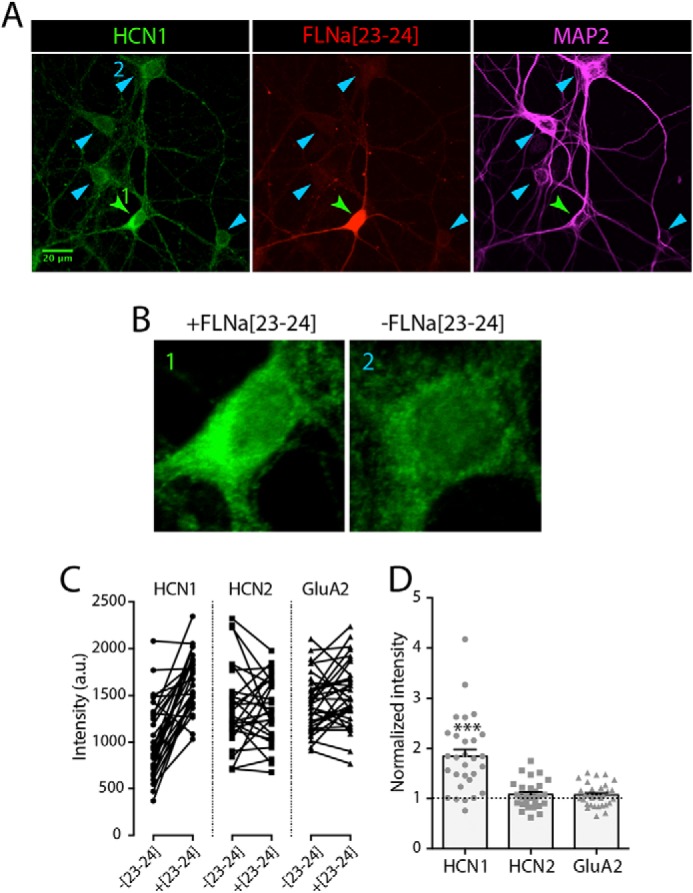
Up-regulation of native HCN1 in hippocampal neurons following lentiviral transduction of FLNa(23–24). A, image of mature (24 DIV) primary hippocampal neurons, infected with lentiviruses expressing the truncated FLNa(23–24) mutant (red). Native HCN1 expression (green) was assessed using a selective antibody against HCN1 (28). Within each image, HCN1 expression was compared between FLNa(23–24)-positive (green arrowhead) and FLNa(23–24)-negative neurons (blue arrowheads). B, magnified somata of selected neurons from A (labeled 1 and 2), demonstrating enhanced HCN1 signal in FLNa(23–24)-expressing neurons. C, quantitative analysis of the influence of FLNa(23–24) expression on native HCN1, HCN2, and GluA2 immunoreactivity. Within each confocal image, the somatic immunoreactive signal of FLNa(23–24)-positive neurons was compared with their neighboring FLNa(23–24)-negative neurons. D, ratio of channel immunoreactivity in FLNa(23–24)-infected neurons compared with neighboring FLNa(23–24)-negative neurons (based on data shown in C). The presence of the truncated filamin mutant leads to a specific increase in HCN1 immunoreactivity (n = 29 cells from four independent experiments; one-sample t test, ***, p < 0.0001), whereas no significant difference was found for HCN2 and GluA2, which are not expected to interact with FLNa (n = 28, 32 from four and three independent experiments; p = 0.132, 0.075).
Quantitative determination of HCN1 signal co-localization with endosomal markers was performed using the Manders' coefficient method (32, 33). This coefficient describes the degree of signal overlap between two images (with 0 representing no co-localization and 1 representing 100% co-localization) and is particularly suitable for the analysis of two molecules with varying distribution patterns and intensities (32). The analysis was performed using the JACoP plug-in in ImageJ (31). To ensure the specificity of the analysis, control experiments were carried where the Manders' coefficient was calculated for pairs of unrelated images within the same condition. These control studies yielded substantially smaller coefficient values (0.08 ± 0.01; n = 92), which represent the random, basal co-localization of signals in our experiments.
Total Internal Reflection Microscopy (TIRF-M)
TIRF-M imaging was performed using an inverted Nikon Ti microscope with a TIRF attachment, equipped with an oil immersion 60× Apo TIRF objective (numeric aperture = 1.49). Fluorescent excitation was employed using an argon/krypton laser at wavelengths of 488 and 568 nm for EGFP and DsRed imaging, respectively. EGFP and DsRed signals were selected using bandpass filters at wavelengths of 525/50 and 625/50 nm, respectively. Images were acquired using an Andor iXon 897 CCD camera.
Dynamin Inhibition
Inhibition of dynamin in HEK293 cells was carried out by a 4-h incubation with 80 μm of the selective dynamin inhibitor dynasore (Sigma) (34) at 37 °C. As a vehicle treatment, the organic solvent (0.26% DMSO) was applied for a similar duration.
Myristoylated Peptides for HCN1-FLNa Interference
An N-myristoylated peptide composed of the 22-amino acid sequence that forms the FLNa-binding domain in HCN1 was synthesized alongside a scrambled control peptide (Thermo-Fisher; see Fig. 8A for peptide sequence). The peptides were dissolved in H2O to yield stock solutions of 1 mm for long term storage (−80 °C). In experiments testing the acute effects of FLNa on HCN1 distribution (Fig. 8), stock solutions of intermediate concentrations were prepared on the day of the experiment to yield varying concentrations as detailed in Fig. 8. Primary hippocampal neurons were incubated with the peptides for 4 h in NBM + B27 culture medium (at 37 °C and 5% CO2) prior to fixation. In electrophysiology experiments (Fig. 9), the peptides were diluted in artificial cerebral spinal fluid (see composition below) on the day of the experiment, to a final concentration of 100 nm. Hippocampal neurons were preincubated for >30 min prior to forming a patch seal.
FIGURE 9.

Functional implications of FLNa regulation in hippocampal neurons. To assess functional regulation of native neuronal HCN channels by FLNa, intrinsic Ih was measured in hippocampal neurons using the whole-cell patch clamp recording configuration, following incubation with either myr-22 or myr-Scr peptides (100 nm). A, a family of hyperpolarization-activated traces, demonstrating enhanced Ih following myr-22 application. B, comparison of single Ih traces upon a hyperpolarizing step, extracted from A (indicated by arrows in A). The augmented Ih is evident as the increased amplitude between the instantaneous (Iins) and the steady-state (Iss) current (indicated by arrows). C, individual values (each obtained from a different cell) representing Ih density upon steps to −130 mV (Mann-Whitney test, *, p = 0.041). D, analysis of Ih density across different potentials. E, injection of hyperpolarizing currents resulted in a voltage sag (arrows) due to the activation of Ih. F–H, voltage sag analysis revealed enhanced sag response following myr-22 application. F, comparison of single voltage traces extracted from E (indicated by arrows in E). G, sag ratio values obtained from individual cells upon hyperpolarizing current injections of 250 pA (Mann-Whitney test, *, p = 0.034). H, analysis of sag ratios demonstrating elevated voltage sag following myr-22 application across a range of current intensities. I and J, to control for potential nonspecific peptide effects, including those potentially mediated by the myristoyl group, Ih was compared between hippocampal neurons that were incubated with the myr-Scr peptide, and naive (untreated) neurons. Both Ih density (I) and sag ratio (J) remained unaltered. I, n = 8–10 cells per data point per group; J, n = 6–8 cells per data point per group.
HEK293 Cells
Ih was recorded from transfected HEK293 cells using the whole-cell voltage clamp configuration as recently described (27). The recording chamber was continuously perfused with an extracellular recording solution containing the following (in mm): 110 NaCl, 5 KCl, 2 CaCl2, 1 MgCl2, 10 HEPES, (pH set to 7.30). Recording pipettes (pulled from borosilicate glass) had a resistance of 2–5 megohms when filled with an intracellular solution containing (in mm) 105 potassium gluconate, 30 KCl, 2 Mg-ATP, 5 EGTA, 0.5 CaCl2, 0.5 cAMP, 10 HEPES (pH set to 7.30). Series resistance was compensated for at least 75%. Only traces with voltage errors smaller than 2 mV were considered for analysis of channel gating and kinetics. Currents were acquired with an Axopatch 200B amplifier (Molecular Devices), controlled by a custom-written program in MATLAB (Mathworks). Currents were low pass Bessel-filtered at 2 kHz and sampled at 5 kHz. Ih was evoked by a series of hyperpolarizing steps from a resting membrane potential of −50 mV in decrements of 10 mV. Ih amplitude was calculated by subtracting the steady-state current at the end of the voltage step from the instantaneous current at its beginning (25, 27). Ih activation kinetics in HEK293 cells were best fit to a monoexponential function (27), and only traces with goodness-of-fit of >0.985 were included in the final analysis. The voltage-dependent activation of Ih was derived by fitting a Boltzmann equation to Ih conductance values of individual traces at different potentials, as recently described (27). Liquid junction potentials (calculated at 13 mV) were corrected for off line.
Hippocampal Neurons
Electrophysiological measurements in primary hippocampal neurons were performed using the whole-cell voltage and current clamp patch clamp configurations. A 12- mm glass coverslip containing 21–22 DIV neurons was placed in a recording chamber continuously perfused with a CO2-saturated artificial cerebral spinal fluid. The artificial cerebral spinal fluid solution contained the following (in mm): 125 NaCl, 25 NaHCO3, 20 glucose, 4 KCl, 2 CaCl2, 1.25 Na2PO4, 1 MgCl2. To isolate Ih from other intrinsic and synaptic conductances, the following blockers were added to the bath solution (in mm): 10 tetraethylammonium, 0.5 BaCl2, 0.1 NiCl2, 0.02 dl-2-amino-5-phosphonopentanoic acid, 0.01 6-cyano-7-nitroquinoxaline-2,3-dione, 0.0005 tetrodotoxin, 0.005 bicuculline. Recording pipettes had a resistance of 3–5 megohms upon filling with an intracellular solution that contained the following (in mm): 105 potassium gluconate, 20 KCl, 2 Mg-ATP, 5 EGTA, 0.5 CaCl2, 10 HEPES (pH set to 7.35). Currents were acquired with a Multiclamp 700A amplifier (Axon Instruments) and digitized with a Digidata 1322A converter (Axon Instruments). Series resistance was compensated 30–40%, reducing maximal voltage error to an average of 1.2 ± 0.1 mV (n = 29). Currents were low pass Bessel-filtered at 2 kHz and sampled at 10 kHz. Signal acquisition and data analysis were performed using pCLAMP 9.0 software (Axon Instruments). In voltage clamp experiments, Ih was recorded and analyzed as detailed above for HEK293 cells. Cell capacitance (Cin) and resistance (Rin) were calculated based on a +10-mV test pulse as described previously (25, 35). Current density was calculated as the whole-cell Ih amplitude, normalized by the cell capacitance. Resting membrane potential was determined immediately following breaking into the whole-cell configuration and switching into current clamp mode. In current clamp experiments, voltage sag was recorded by eliciting a series of hyperpolarizing current injections from 0 to 300 pA in 50 pA increments (step duration = 500 ms). Sag ratio was calculated as 100·(Vss − Vpeak)/(RMP − Vpeak) (%), where Vpeak is the minimal potential achieved at the beginning of the current step; RMP is resting membrane potential, and Vss is the steady-state potential at its end.
Differences between groups were determined using Student's t test, nonparametric Mann-Whitney test, or two-way ANOVA, as appropriate. A cutoff value of p < 0.05 was assumed to indicate a significant difference.
RESULTS
Selective Interference with the FLNa Interaction Site of HCN1 Augments Ih and Alters Channel Gating Properties
To study regulation of HCN1 by FLNa, we generated an EGFP-fused HCN1 channel construct (HCN1(Δ22)GFP) lacking the 22 amino acids that form the FLNa-interacting domain (Table 1 and Fig. 1). Removal of the FLNa-interacting domain was not detrimental to the delivery of HCN1 to the cell membrane or to its function; stepwise membrane hyperpolarization of HCN1(Δ22)GFP-expressing HEK293 cells yielded slowly activating, noninactivating inward currents typical of HCN1-mediated Ih, which were virtually absent in mock-transfected cells (Fig. 2A). In line with previous studies (24, 25, 36–38), the fusion of EGFP to either the C′- or the N′ terminus of the channel did not compromise its delivery to the membrane and did not influence its biophysical characteristics (data not shown).
FIGURE 1.

Structure and interaction of FLNa and HCN1 channels. HCN1 channels consist of six transmembrane domains, with intracellularly located N′ and C′ termini. A conserved sequence of 22 amino acids (aa) on the C′ terminus forms the FLNa interaction domain (blue) (23). FLNa is a dimer, with each of its two subunits composed of a primary actin-binding domain at the N′ terminus (ABD), attached to 24 immunoglobulin (Ig)-like domains. A secondary actin-binding domain is located at Ig-like domain 10 (68), and the interaction interface with HCN1 channels is localized to Ig domains 23–24 (23).
FIGURE 2.

Deletion of the FLNa-binding domain in HCN1 augments Ih and facilitates channel gating. A, whole-cell responses to voltage hyperpolarizing steps in transfected HEK293 cells. Ih was not detected in mock-transfected neurons where only DsRed was expressed (left). Co-expression of FLNaDsRed with either HCN1GFP or HCN1(Δ22)GFP yielded inward currents with typical Ih-like properties, possessing larger current amplitudes in HCN1(Δ22)GFP-expressing cells. B, quantitative summary revealed a 2-fold increase in Ih density in cells expressing HCN1(Δ22)GFP, compared with HCN1GFP-expressing cells (symbols represent Ih recorded from individual cells). C, voltage-dependent activation of Ih in HCN1GFP- and HCN1(Δ22)GFP-expressing HEK293 cells. A depolarizing shift in the voltage activation function of HCN1(Δ22)GFP was observed, quantified by the half-activation (V0.5) value (inset) of individual fits to the Boltzmann function. D, example traces comparing the kinetics of HCN1GFP (blue) and HCN1(Δ22)GFP (red) upon stepping to different membrane potentials (from −40 mV), as indicated. The amplitude of the currents was normalized to maximum value to allow for visual comparison of the time course. Only a portion of the initial response is shown. E, activation kinetics of Ih in HCN1GFP- and HCN1(Δ22)GFP-expressing cells. HCN1(Δ22)GFP-mediated Ih was faster than HCN1GFP. F, Ih traces representing the protocol used to determine the reversal potential (Erev) of the current. Upon the initial step to a near-maximal activation voltage of −110 mV, membrane potential was stepped back to a range of voltage values. Because Ih deactivates relatively slowly, the instantaneous peak values of the tail current (inset on the right) represent predominantly the changes in driving force. G, current-voltage (I-V) curves, plotted based on the protocol shown in F. No difference was found between Erev of Ih in HCN1GFP- and HCN1(Δ22)GFP-expressing cells, indicating that the FLNa interaction site does not control ion permeation and selectivity in HCN1 channels (note: standard error in many data points was too small to be visualized). *, p < 0.05, Student's t test.
Having established a functional HCN1 channel construct lacking the FLNa-binding domain, we employed it to study the consequences of HCN1 regulation by FLNa. Whole-cell voltage clamp recordings from HEK293 cells that co-expressed DsRed-fused FLNa (FLNaDsRed) together with either HCN1GFP or HCN1(Δ22)GFP revealed a 2-fold increase in Ih density in HCN1(Δ22)GFP-expressing cells as compared with HCN1GFP-expressing cells (75 ± 16 versus 149 ± 28 pA/pF upon voltage steps to −110 mV; n = 25, 26 cells (respectively); p = 0.014, Mann-Whitney test; Fig. 2, A and B). Ih gating properties also differed, including a modest depolarizing shift of the voltage-dependent activation (V0.5 = −76.9 ± 1.2 versus −72.0 ± 1.8 mV for HCN1GFP, HCN1(Δ22)GFP, respectively; n = 7, 6 cells; Student's t test, p = 0.041; Fig. 2C) with no difference in the slope factor or the fit to the Boltzmann function (k = 7.4 ± 0.7, 7.3 ± 0.7 mV; p = 0.723). In line with FLNa-mediated restriction of HCN1 gating, the activation kinetics of HCN1(Δ22)GFP were accelerated compared with HCN1GFP (two-way ANOVA; p = 0.043; Fig. 2, D and E). To test for potential effects on the selective permeation of ions through the channel, we applied a voltage-step protocol to construct a current-voltage (I-V) curve of HCN1GFP and HCN1(Δ22)GFP (Fig. 2F). No differences were found between the current-voltage relationship or the reversal potential values of the two constructs (Erev = −42.1 ± 2.0 versus −39.3 ± 0.8 mV for HCN1GFP, HCN1(Δ22)GFP, respectively; n = 3, 4 cells; Student's t test, p = 0.192; Fig. 2G). Together, these data support the notion that HCN1 regulation by FLNa occurs via a subunit-specific sequence in the HCN1 C′ terminus and acts to constrain Ih amplitude and modulate its gating properties without influencing its reversal potential.
FLNa-mediated Suppression of Ih Is Accompanied by HCN1 Channel Clustering
In light of the established roles of FLNa in cytoskeletal dynamics and membrane trafficking (39), we next examined whether the observed inhibition of Ih by FLNa is related to altered HCN channel distribution and/or membrane expression. We used confocal imaging of HEK293 cells transfected with cDNA constructs that selectively target HCN1-FLNa interaction domains (Table 1). Transfection of HCN1GFP alongside an empty plasmid vector in HEK293 cells resulted in a largely punctate distribution pattern of the channel protein (Fig. 3A). Whereas HEK293 cells express endogenous FLNa (Fig. 3B), the levels of endogenous protein may not suffice to engage a large number of HCN1 molecules generated by overexpression strategies. Therefore, we co-transfected cells with both HCN1GFP and FLNaDsRed. In these co-transfected cells, the punctate distribution of HCN1GFP was accentuated (Fig. 3, A, C and G). In contrast, co-expression of FLNaDsRed with either HCN1(Δ22)GFP or HCN2GFP (both not expected to interact with FLNa) resulted in a largely diffuse distribution (Fig. 3, A, C–E, and G). The robust clustering of HCN1 by FLNa may be either a direct result of conformational changes of the channel induced by FLNa binding or of more complex signaling pathways involving other cytoskeletal elements. To discern between these possibilities, we employed a DsRed-fused, FLNa truncation mutant (FLNa(23–24)DsRed), which possesses the HCN1-binding region (C′-terminal Ig-like domains 23–24) but not the actin-binding regions (Table 1). The distribution of FLNa(23–24)DsRed in HEK293 cells was diffuse and nonspecific, as opposed to the filamentous distribution observed with FLNaDsRed and endogenous FLNa (Fig. 3B), consistent with lack of actin binding capacity. In contrast to the clustered HCN1 distribution in the presence of full-length FLNa (Fig. 3A), co-expression of the truncated FLNa(23–24)DsRed leads to a homogeneous HCN1GFP distribution pattern (Fig. 3, A and F), which resembled the expression pattern of HCN1(Δ22)GFP (Fig. 3, A and D). These opposing effects of FLNa and FLNa(23–24) on HCN1 clustering were reproduced using an HCN1 construct with an N′-terminal fusion of the EGFP (HCN1GFP-N′, not shown).
To obtain a quantitative picture of the FLNa-induced clustering, we performed a CCF analysis of signal distribution (see “Experimental Procedures”) (30). Pooled data from 20 to 23 cells per experimental group (obtained from at least three separate experiments) demonstrated a steeper CCF profile for HCN1 + FLNa-expressing cells, indicative of a more clustered distribution (Fig. 3, C–G).
FLNa Alters HCN1 Distribution Pattern at Both the Cell Surface and Intracellularly
FLNa-mediated clustering of HCN1 channels can explain the inhibitory effects of FLNa on Ih if it derives from reduced surface expression and accumulation of the channels within intracellular organelles. To study HCN1 channel distribution on the cell surface, we employed TIRF-M, a technique that allows the visualization of only a very thin section of the cell (50–150 nm), representing membrane and peri-membranous domains (40). The clustered pattern of HCN1 channels in the presence of FLNa was discernible also in the TIRF plane. It stood in contrast to the more homogeneous surface expression pattern of HCN1(Δ22) and HCN2 channels in the presence of FLNa, as well as to the smooth distribution pattern of HCN1 in the presence of the truncated FLNa(23–24) (Fig. 4A). Close examination of TIRF and wide field images captured from the same cell allowed us to evaluate the subcellular location of HCN1-containing clusters. We found that a significant proportion of HCN1 puncta was present only in the wide field images, i.e. localized within the cell interior (Fig. 4B). Thus, combined TIRF and wide field imaging demonstrated that although FLNa may regulate HCN1 at the cell surface, it also facilitates accumulation of the channels within intracellular clusters.
FIGURE 4.

FLNa-mediated alterations in surface and intracellular distribution of HCN1, revealed by TIRF-M imaging. A, wide field and TIRF images of cells expressing FLNa and HCN channel constructs. Wide field images of both FLNa (evident by their DsRed signal, far left column) and HCN channels (EGFP signal, 2nd column) are shown, as well as TIRF images of the EGFP signal obtained from the same cell (3rd column). The far right column represents a magnified region of the TIRF image to its left. Note the clustered appearance of HCN1GFP when expressed alongside FLNaDsRed under TIRF conditions. Also note the punctate surface expression pattern of HCN1GFP at the TIRF plane, compared with the smooth pattern obtained in all other conditions. B, close examination of wide field and TIRF images of the same cell reveals that some of the HCN1GFP clusters are located in proximity to the cell surface (as evident by their presence in both wide field images and the TIRF plane, green arrowheads), whereas others are intracellular (as evident by their virtual disappearance from the TIRF image, light blue arrowheads). Images are representative of data obtained from three separate experiments, with each condition performed at least in duplicate.
FLNa Facilitates Dynamin-dependent Internalization and Targeting of HCN1 to Endocytic Compartments
FLNa-induced intracellular clustering of HCN1 channels raises questions regarding the cellular mechanisms involved. Because FLNa regulates trafficking and endocytic processing of several membrane proteins (26, 41–43), we tested whether FLNa promotes targeting of HCN1 channels to endocytic compartments. Immunolabeling of HCN1/FLNa co-expressing HEK293 cells with an antibody directed against the lysosomal protein LAMP1 revealed substantial co-localization of HCN1-containing puncta with LAMP1-positive organelles (Fig. 5, A and B). In contrast, HCN1(Δ22)GFP was homogeneously distributed and was not preferentially localized to LAMP1-positive organelles (Fig. 5, A and B). To quantify these distinct distribution patterns, we employed the Manders' coefficient method for analysis of signal co-localization (see “Experimental Procedures”) (32). As shown in Fig. 5C, there was a significant difference between the co-localization coefficients of LAMP1 with HCN1 and HCN1(Δ22) (n = 16, 21 cells, respectively, based on three independent experiments; Student's t test, p < 0.001). These data demonstrate a selective FLNa-mediated lysosomal accumulation of full-length HCN1 channels.
FIGURE 5.

HCN1 clusters represent subpopulations of endosomal organelles. A, D, and G, confocal images of HEK293 cells co-transfected with either HCN1GFP + FLNa (top panel) or HCN1(Δ22)GFP + FLNa (bottom panel), and labeled against the lysosomal marker LAMP1 (A), the early endosomal marker EEA1 (D), or the recycling endosomal marker transferrin (G). Magnified regions from A, D, and G are shown to their right in B, E, and H. Images in A, D, and G are a stack of optical slices in the z-plane, whereas the magnified regions in B, E, and H are single z-slices (optical thickness<1 μm). Discrete clusters representing HCN1 puncta co-localized to endosomes are indicated by white arrowheads. C, F, and I, quantitative analysis of HCN1GFP co-localization with endosomal markers, as compared with HCN1(Δ22)GFP. This analysis revealed a significantly stronger accumulation of HCN1GFP in various subpopulations of endosomes (Student's t test, ***, p < 0.001; n = 16–25 cells per group, amounting 131 cells in total). All experiments were repeated least three separate times per condition.
Using similar imaging and analysis strategies, we extended our experiments to other types of endocytic organelles. In addition to its presence within lysosomes, HCN1 channel protein accumulated in subpopulations of early endosomes and recycling endosomes, as evident by increased co-localization of HCN1GFP with the early endosomal marker EEA1 and with transferrin-labeled recycling endosomes (n = 22–25 cells per experimental group; taken from three independent experiments; Student's t test, p < 0.001; Fig. 5, D–I).
The increased presence of the HCN1 channel protein in several types of organelles along the endocytic pathway implies a role for FLNa in the removal of HCN1 channels from the cell membrane. To study the involvement of FLNa in channel internalization, we focused on dynamin, a GTPase that facilitates endocytosis by enabling the fission of newly formed pits budding from the plasma membrane (44). Incubation of HEK293 cells co-transfected with FLNaDsRed and HCN1GFP in the presence of the selective dynamin-inhibitor dynasore (80 μm) led to a marked decrease in HCN1 channel clustering (Fig. 6, A and B). In addition to rescuing the clustering phenotype, dynasore also augmented Ih density 2-fold in HCN1GFP-transfected HEK293 cells (54 ± 10 versus 106 ± 19 pA/pF for vehicle and dynasore treatments, respectively; n = 23, 30 cells; Mann-Whitney test, p = 0.039; Fig. 6, C and D). Notably, dynasore treatment had no effect on Ih in cells co-expressing FLNaDsRed and the HCN1 construct lacking the FLNa-interacting domain (HCN1[Δ22]) (104 ± 15 versus 100 ± 21 pA/pF for vehicle and dynasore treatments, respectively; n = 20, 20; Mann-Whitney test, p = 0.312; Fig. 6E), further supporting the selective role of FLNa in this process. Together, these experiments demonstrate that FLNa-mediated inhibition of Ih requires dynamin-dependent internalization of HCN1 channels.
In Hippocampal Neurons, FLNa Regulates Native HCN1 Expression Levels and Subcellular Localization
HCN1 channels have crucial influence on hippocampal neuronal function. Therefore, we examined whether FLNa might constrain native HCN1 channel surface expression and distribution patterns in neurons. We infected primary hippocampal neurons with lentiviral particles encoding the FLNa truncation mutant (FLNa(23–24)DsRed), which was found effective in blocking the effect of FLNa on HCN1 clustering in HEK293 cells (Fig. 3). At an age when neurons are generally considered mature (DIV >21), expression of FLNa(23–24)DsRed was evident in infected neurons as DsRed signal in somata and neurites (Fig. 7A). Immunocytochemistry for native HCN1 revealed significantly stronger HCN1 immunoreactive signal in neurons expressing FLNa(23–24)DsRed compared with neighboring noninfected neurons (Fig. 7). This is consistent with a dominant-negative effect of the truncation construct, which interferes with HCN1 binding to native FLNa, preventing FLNa-induced channel down-regulation. Importantly, the effect of FLNa(23–24)DsRed was specific to HCN1, because neither the immunoreactivity of HCN2 nor that of the glutamate receptor subunit GluA2 was affected by the expression of FLNa(23–24)DsRed (Fig. 7, C and D).
To test the consequences of HCN1-FLNa interactions on the distribution of native HCN1 neuronal channels, we manipulated FLNa acutely, aiming to avoid potential compensatory alterations that might arise upon chronic manipulations. We designed employed decoy peptides (“myr-22”) consisting of the 22-amino acid-long FLNa-binding domain of HCN1, attached to a myristoyl group (for improved membrane-permeability) (Fig. 8A). As control, we used a scrambled peptide (“myr-Scr”) with a similar structure. Using high magnification, thin slice laser confocal scanning of mature (>23 DIV) hippocampal neurons (see “Experimental Procedures”), we characterized in detail the subcellular distribution of the channels. Z-stack confocal reconstruction of optical slices revealed accumulation of HCN1 in intracellular clusters (Fig. 8B), in line with previous observations in primary hippocampal neurons (25). A 4-h exposure to the myr-22 peptide altered this expression pattern, resulting in a relatively homogeneous distribution of HCN1 channels (100 nm; Fig. 8B). Incubation of live hippocampal neurons with the scrambled (myr-Scr) peptide did not influence HCN1 channel distribution, suggesting that the effects of myr-22 on the subcellular localization of HCN1 did not stem from nonspecific effects mediated by the myristoyl group (46). The effects of FLNa in controlling HCN channel distribution in neurons were supported by studies establishing a dose -dependence of the consequences of interfering peptide application (Fig. 8C). Diverse doses of the scrambled peptide had no effects. Cross-correlation function analysis of 200 individual neurons (based on four independent experiments) quantified this dose-dependent effect (Fig. 8D). Thus, acute interference of native HCN1-FLNa interaction in neurons supports a dynamic role for FLNa in localization and clustering of native neuronal HCN1 channels.
FLNa Constrains Native Ih in Hippocampal Neurons
To examine the functional consequences of HCN1 regulation by FLNa in live neurons, we preincubated ≥21 DIV neurons with myr-22 or myr-Scr peptides, followed by whole-cell voltage clamp measurements. In line with a role for FLNa in suppression of Ih, myr-22-treated neurons possessed a significantly larger Ih density (Fig. 9, A–D). Resting membrane potential of the neurons (Vrest = −52.3 ± 2.0 and −52.2 ± 1.3 mV; n = 11, 12 cells for scrambled and myr-22 groups, respectively; Student's t test, p = 0.967) or their input resistance (Rin = 271 ± 39 and 313 ± 59 megohms; n = 10, 14 cells for scrambled and myr-22 groups; Student's t test, p = 0.597) did not differ.
This suggested that regulation of Ih by FLNa may alter basic neuronal properties primarily at hyperpolarized potentials rather than at rest. To examine this possibility, we used the current clamp configuration to record the voltage response of neurons to a series of hyperpolarizing currents. In neurons treated with either myr-22 or myr-Scr, injection of hyperpolarizing currents resulted in a voltage sag, representing the slow voltage-induced activation of Ih in response to hyperpolarizing events and the resulting depolarization of the membrane (45). The sag ratio of myr-22-treated neurons was significantly larger than that of myr-Scr-treated neurons (Fig. 9, E–H), consistent with augmented Ih.
To further exclude potential nonspecific effects, we compared both Ih and passive physiological properties of untreated, naive hippocampal neurons to those of myr-Scr-treated neurons. No differences were found in cell capacitance (Cin = 89.1 ± 16.5 versus 80.4 ± 8.3 pF; n = 9, 10; Student's t test, p = 0.634), input resistance (305.9 ± 41.4 versus 271.7 ± 38.9 megohms; n = 9, 10; Student's t test, p = 0.556), or resting membrane potential (−54.5 ± 1.8 versus −52.3 ± 2.0 mV; n = 8, 11; Student's t test, p = 0.439). Furthermore, both Ih density (1.56 ± 0.36 versus 1.50 ± 0.12 pA/pF at voltage steps to −130 mV; n = 8, 9; Student's t test, p = 0.841) and sag ratio (15.5 ± 2.2 versus 14.1 ± 1.9% in response to 250 pA hyperpolarizing current injection; n = 8, 10; Student's t test, p = 0.630) remained unaltered when comparing naive and myr-Scr-treated neurons (Fig. 9, I and J), indicating that the effects of myr-22 on Ih were specific and stemmed from interference with FLNa binding. In summary, these results support the notion that native FLNa modulates Ih in mature hippocampal neurons, influencing homeostatic neuronal responses to voltage fluctuations.
DISCUSSION
In this study, we employed genetic, pharmacological, electrophysiological, high resolution imaging, and neurochemical approaches to probe an important role for the actin-binding protein FLNa in neuronal function via interaction with native neuronal HCN1 channels. Employing both HEK293 cells and hippocampal neurons, we found that FLNa selectively internalized HCN1-type channels via a dynamin-dependent mechanism. This FLNa-mediated suppression of HCN1 surface expression was associated with dynamin-dependent sequestration of the channels into endosomal organelles, leading to reduced Ih density. Reduced Ih density, in turn, attenuated the function of this ion channel in homeostatic membrane responses to transient hyperpolarizing events.
A putative role for FLNa in tethering neuronal ion channels to the actin cytoskeleton has been suggested by the presence of the protein in mature mammalian brain (5, 6) and by the established binding of the protein to a number of ion channels expressed in the brain (42, 47–50). However, although such function of FLNa on ion channel trafficking regulation would be profoundly important for neuronal behavior, experimental evidence supporting this potential role has been limited. Among several tested ion channels, FLNa bound selectively to HCN1 channel protein in a yeast two-hybrid screening via a specific 22-amino acid sequence in the channel C′ terminus (23). Overexpression of HCN1 in a melanoma cell line devoid of FLNa augmented Ih and facilitated channel gating compared with overexpression in a cell line that expresses FLNa (23). More recently, association of FLNa with HCN1 was reported in cochlear hair cells (51), although the functional implications of this interaction have yet to be determined.
Here, we examined the functions of FLNa in mature neurons and found robust effects of FLNa on the control of ion channel abundance and function in the cell membrane. Focusing on HCN1 channels, our studies interrogated FLNa channel interactions from several perspectives. Using confocal and TIRF imaging of fluorophore-fused constructs, a salient feature of HCN1 regulation by FLNa in both HEK293 cells and primary hippocampal neurons was robust clustering of the channel protein. Interestingly, FLNa-mediated clustering of HCN1 channels has been observed around the cell rim of melanoma cell lines following pharmacological suppression of protein synthesis, and it was suggested to reflect clustering of the channels on the cell membrane (23). Although our data do not exclude the presence of HCN1 clusters on the cell surface, both TIRF imaging and immunocytochemical labeling of HCN1 clusters identified the substantial presence of HCN1 clusters in the cell interior, particularly within endosomes. Importantly, both HCN1 clustering and Ih down-regulation by FLNa were blocked by preventing dynamin-mediated endocytosis. Together, these findings support a role of FLNa in sequestration of surface-expressed channels into endocytic organelles.
How might FLNa promote endocytosis of HCN1? Two broad possibilities come to mind. 1) For guiding HCN1 channels to internalization, the transient interactions between HCN1 and FLNa may couple the channels to molecules that direct them to endocytosis or localize them to endocytosis-prone domains within the membrane. For example, in endothelial cells, transient interaction of FLNa with caveolin-1 was associated with enhanced caveolae internalization and was suggested to regulate their clustering and mobility on the membrane (42). FLNa was also found critical for efficient chemotactic cytokine receptor 2B receptor endocytosis (43) and may route furin receptors from early endosomes to the trans-Golgi network (41). These functions strengthen the notion of FLNa as an active transport controller in the endocytic pathway. 2) For preventing stable anchoring on the cell membrane, FLNa may act by physically preventing or altering the interaction of HCN1 with anchoring molecules that would otherwise stabilize the channels on the cell surface. Supporting this possibility, FLNa competes with talin, a modulator of the adhesion receptor integrin, over the same binding site, which suppresses integrin activation (52, 53). In the case of HCN1 channels, this scenario is particularly attractive because, along with FLNa, several other proteins bind HCN channels via the channel C′ terminus (54), including TRIP8b (tetratricopeptide repeat-containing Rab8b-interacting protein), an important modulator of neuronal HCN1 trafficking (27, 38).
Whereas FLNa facilitated internalization of HCN1, it influences additional binding partners (7). For example, interaction of FLNa with Kir2.1-type potassium channels in vascular smooth muscles leads to an increased number of functional channels on the cell membrane (55). Similarly, FLNa enhances membrane expression of BKCa calcium-activated potassium channels (50) and dopamine D2/D3 receptors (48, 56), although it is also required for D3 receptor internalization (52). In the case of the μ-opioid receptor, although FLNa is not essential for receptor expression on the cell membrane, it is critical for agonist-induced internalization (49). Thus, whereas further work is needed to establish these roles in the context of neuronal function, it is conceivable and perhaps even likely that FLNa regulates neuronal channels in addition to HCN1. Distinctive effects of FLNa on different partners may enable the protein to orchestrate ensembles of channels in neuronal membranes, with major effects on neuronal behavior. For example, FLNa may increase surface expression of the potassium channel subunit Kv4.2 (47). Co-regulation of HCN- and Kv4.2-mediated currents in neurons may occur in various contexts and can modulate neuronal firing properties (57, 58). Furthermore, like HCN1, Kv4.2 channels are also enriched in dendrites of pyramidal hippocampal neurons, where they act to modulate signal propagation (59) and concurrent regulation of dendritic HCN and Kv4.2 trafficking, and function has been described in the context of activity-dependent alterations in neuronal input (15, 16, 25, 60, 61). It is tempting to speculate that by binding both channels, FLNa might be instrumental in this co-regulation.
FLNa regulation of ion channels might also operate in brain pathology. For example, FLNa binds the Alzheimer disease (AD)-related proteins presenilin 1 and presenilin 2 (62), and a mutation in presenilin 1 that is associated with early onset AD resulted in a dramatic increase of hippocampal FLNa expression in a transgenic mouse line (63). Furthermore, increased amyloid-β in the brain can lead to enhanced complex formation between FLNa, α7 nicotinic acetylcholine receptors, and Toll-like receptor 4, and inhibition of this complex using a high affinity FLNa-binding agent significantly reduced many of the AD-related adverse affects mediated by amyloid-β signaling (64). Interestingly, reduction in HCN1 was recently reported both in an AD animal model and in the human brain. This was associated with protein complex formation between HCN1 and amyloid protein precursor and increased amyloid-β production (65). As the relationship between neuronal degeneration and ion channel dysfunction continues to unfold (66), further investigation into the involvement of aberrant FLNa signaling may provide important insights into channelopathies and altered excitability in AD, and potentially in other neurological disorders (21, 67).
Acknowledgments
We thank Dr. Nakamura (Harvard University) for the monomeric DsRed-fused FLNa construct, Dr. Blenis (Harvard University) for the Myc-tagged FLNa construct, Drs. Santoro and Siegelbaum (Columbia University) for the original mouse GFP-HCN1 cDNA, and Dr. Osten (Cold Spring Harbor Laboratory) for the lentiviral vector system. We thank Dr. Chetkovich (Northwestern University) and Dr. Shigemoto (National Institute of Physiological Sciences, Okazaki, Japan) for the kind gifts of guinea pig HCN1 and HCN2 antisera, and Drs. Kirchhausen and Pelish (Harvard University) for dynasore samples.
This work was supported, in whole or in part, by National Institutes of Health Grants R37 NS35439 and T32 NS45540 (to T. Z. B. and Y. N.). This work was also supported by a Rubicon grant from the Netherlands Organization for Scientific Research (to Y. N.) and Dutch National Epilepsy Fund Grant NEF 08-01 (to W. J. W.).
- FLNa
- filamin A
- AD
- Alzheimer disease
- CCF
- cross-correlation function
- DIV
- day in vitro
- EEA1
- early endosome antigen 1
- GluA2
- ionotropic glutamate AMPA receptor 2
- HCN
- hyperpolarization-activated cyclic nucleotide-gated channel
- Ih
- hyperpolarization-activated, HCN-mediated cationic current
- LAMP1
- lysosomally associated membrane protein
- TIRF-M
- total internal reflection fluorescent microscopy
- EGFP
- enhanced GFP
- ANOVA
- analysis of variance
- pF
- picofarad.
REFERENCES
- 1. Stossel T. P., Condeelis J., Cooley L., Hartwig J. H., Noegel A., Schleicher M., Shapiro S. S. (2001) Filamins as integrators of cell mechanics and signalling. Nat. Rev. Mol. Cell Biol. 2, 138–145 [DOI] [PubMed] [Google Scholar]
- 2. Nakamura F., Osborn T. M., Hartemink C. A., Hartwig J. H., Stossel T. P. (2007) Structural basis of filamin A functions. J. Cell Biol. 179, 1011–1025 [DOI] [PMC free article] [PubMed] [Google Scholar]
- 3. Feng Y., Walsh C. A. (2004) The many faces of filamin: a versatile molecular scaffold for cell motility and signalling. Nat. Cell Biol. 6, 1034–1038 [DOI] [PubMed] [Google Scholar]
- 4. Sarkisian M. R., Bartley C. M., Rakic P. (2008) Trouble making the first move: interpreting arrested neuronal migration in the cerebral cortex. Trends Neurosci. 31, 54–61 [DOI] [PubMed] [Google Scholar]
- 5. Sheen V. L., Feng Y., Graham D., Takafuta T., Shapiro S. S., Walsh C. A. (2002) Filamin A and filamin B are co-expressed within neurons during periods of neuronal migration and can physically interact. Hum. Mol. Genet. 11, 2845–2854 [DOI] [PubMed] [Google Scholar]
- 6. Noam Y., Phan L., McClelland S., Manders E. M., Ehrengruber M. U., Wadman W. J., Baram T. Z., Chen Y. (2012) Distinct regional and subcellular localization of the actin-binding protein filamin A in the mature rat brain. J. Comp. Neurol. 520, 3013–3034 [DOI] [PMC free article] [PubMed] [Google Scholar]
- 7. Nakamura F., Stossel T. P., Hartwig J. H. (2011) The filamins: organizers of cell structure and function. Cell Adh. Migr. 5, 160–169 [DOI] [PMC free article] [PubMed] [Google Scholar]
- 8. McCormick D. A., Pape H. C. (1990) Properties of a hyperpolarization-activated cation current and its role in rhythmic oscillation in thalamic relay neurones. J. Physiol. 431, 291–318 [DOI] [PMC free article] [PubMed] [Google Scholar]
- 9. Magee J. C. (1999) Dendritic lh normalizes temporal summation in hippocampal CA1 neurons. Nat. Neurosci. 2, 508–514 [DOI] [PubMed] [Google Scholar]
- 10. Tsay D., Dudman J. T., Siegelbaum S. A. (2007) HCN1 channels constrain synaptically evoked Ca2+ spikes in distal dendrites of CA1 pyramidal neurons. Neuron 56, 1076–1089 [DOI] [PMC free article] [PubMed] [Google Scholar]
- 11. Biel M., Wahl-Schott C., Michalakis S., Zong X. (2009) Hyperpolarization-activated cation channels: from genes to function. Physiol. Rev. 89, 847–885 [DOI] [PubMed] [Google Scholar]
- 12. Huang Z., Lujan R., Kadurin I., Uebele V. N., Renger J. J., Dolphin A. C., Shah M. M. (2011) Presynaptic HCN1 channels regulate CaV3.2 activity and neurotransmission at select cortical synapses. Nat. Neurosci. 14, 478–486 [DOI] [PMC free article] [PubMed] [Google Scholar]
- 13. Lörincz A., Notomi T., Tamás G., Shigemoto R., Nusser Z. (2002) Polarized and compartment-dependent distribution of HCN1 in pyramidal cell dendrites. Nat. Neurosci. 5, 1185–1193 [DOI] [PubMed] [Google Scholar]
- 14. Notomi T., Shigemoto R. (2004) Immunohistochemical localization of Ih channel subunits, HCN1–4, in the rat brain. J. Comp. Neurol. 471, 241–276 [DOI] [PubMed] [Google Scholar]
- 15. van Welie I., van Hooft J. A., Wadman W. J. (2004) Homeostatic scaling of neuronal excitability by synaptic modulation of somatic hyperpolarization-activated Ih channels. Proc. Natl. Acad. Sci. U.S.A. 101, 5123–5128 [DOI] [PMC free article] [PubMed] [Google Scholar]
- 16. Fan Y., Fricker D., Brager D. H., Chen X., Lu H.-C., Chitwood R. A., Johnston D. (2005) Activity-dependent decrease of excitability in rat hippocampal neurons through increases in I(h). Nat. Neurosci. 8, 1542–1551 [DOI] [PubMed] [Google Scholar]
- 17. Brager D. H., Johnston D. (2007) Plasticity of intrinsic excitability during long-term depression is mediated through mGluR-dependent changes in I(h) in hippocampal CA1 pyramidal neurons. J. Neurosci. 27, 13926–13937 [DOI] [PMC free article] [PubMed] [Google Scholar]
- 18. Campanac E., Daoudal G., Ankri N., Debanne D. (2008) Downregulation of dendritic I(h) in CA1 pyramidal neurons after LTP. J. Neurosci. 28, 8635–8643 [DOI] [PMC free article] [PubMed] [Google Scholar]
- 19. Narayanan R., Dougherty K. J., Johnston D. (2010) Calcium store depletion induces persistent perisomatic increases in the functional density of h channels in hippocampal pyramidal neurons. Neuron 68, 921–935 [DOI] [PMC free article] [PubMed] [Google Scholar]
- 20. Brewster A., Bender R. A., Chen Y., Dube C., Eghbal-Ahmadi M., Baram T. Z. (2002) Developmental febrile seizures modulate hippocampal gene expression of hyperpolarization-activated channels in an isoform- and cell-specific manner. J. Neurosci. 22, 4591–4599 [DOI] [PMC free article] [PubMed] [Google Scholar]
- 21. Noam Y., Bernard C., Baram T. Z. (2011) Towards an integrated view of HCN channel role in epilepsy. Curr. Opin. Neurobiol. 21, 873–879 [DOI] [PMC free article] [PubMed] [Google Scholar]
- 22. Postea O., Biel M. (2011) Exploring HCN channels as novel drug targets. Nat. Rev. Drug Discov. 10, 903–914 [DOI] [PubMed] [Google Scholar]
- 23. Gravante B., Barbuti A., Milanesi R., Zappi I., Viscomi C., DiFrancesco D. (2004) Interaction of the pacemaker channel HCN1 with filamin A. J. Biol. Chem. 279, 43847–43853 [DOI] [PubMed] [Google Scholar]
- 24. Lewis A. S., Schwartz E., Chan C. S., Noam Y., Shin M., Wadman W. J., Surmeier D. J., Baram T. Z., Macdonald R. L., Chetkovich D. M. (2009) Alternatively spliced isoforms of TRIP8b differentially control h channel trafficking and function. J. Neurosci. 29, 6250–6265 [DOI] [PMC free article] [PubMed] [Google Scholar]
- 25. Noam Y., Zha Q., Phan L., Wu R.-L., Chetkovich D. M., Wadman W. J., Baram T. Z. (2010) Trafficking and surface expression of hyperpolarization-activated cyclic nucleotide-gated channels in hippocampal neurons. J. Biol. Chem. 285, 14724–14736 [DOI] [PMC free article] [PubMed] [Google Scholar]
- 26. Sverdlov M., Shinin V., Place A. T., Castellon M., Minshall R. D. (2009) Filamin A regulates caveolae internalization and trafficking in endothelial cells. Mol. Biol. Cell 20, 4531–4540 [DOI] [PMC free article] [PubMed] [Google Scholar]
- 27. Han Y., Noam Y., Lewis A. S., Gallagher J. J., Wadman W. J., Baram T. Z., Chetkovich D. M. (2011) Trafficking and gating of hyperpolarization-activated cyclic nucleotide-gated channels are regulated by interaction with tetratricopeptide repeat-containing Rab8b-interacting protein (TRIP8b) and cyclic AMP at distinct sites. J. Biol. Chem. 286, 20823–20834 [DOI] [PMC free article] [PubMed] [Google Scholar]
- 28. Shin M., Chetkovich D. M. (2007) Activity-dependent regulation of h channel distribution in hippocampal CA1 pyramidal neurons. J. Biol. Chem. 282, 33168–33180 [DOI] [PMC free article] [PubMed] [Google Scholar]
- 29. Dittgen T., Nimmerjahn A., Komai S., Licznerski P., Waters J., Margrie T. W., Helmchen F., Denk W., Brecht M., Osten P. (2004) Lentivirus-based genetic manipulations of cortical neurons and their optical and electrophysiological monitoring in vivo. Proc. Natl. Acad. Sci. U.S.A. 101, 18206–18211 [DOI] [PMC free article] [PubMed] [Google Scholar]
- 30. van Steensel B., van Binnendijk E. P., Hornsby C. D., van der Voort H. T., Krozowski Z. S., de Kloet E. R., van Driel R. (1996) Partial colocalization of glucocorticoid and mineralocorticoid receptors in discrete compartments in nuclei of rat hippocampus neurons. J. Cell Sci. 109, 782–792 [DOI] [PubMed] [Google Scholar]
- 31. Bolte S., Cordelières F. P. (2006) A guided tour into subcellular colocalization analysis in light microscopy. J. Microsc. 224, 213–232 [DOI] [PubMed] [Google Scholar]
- 32. Manders E. M., Verbeek F. J., Aten J. A. (1993) Measurement of colocalization of objects in dual-color confocal images. J. Microsc. 169, 375–382 [DOI] [PubMed] [Google Scholar]
- 33. Sharma S., Quintana A., Findlay G. M., Mettlen M., Baust B., Jain M., Nilsson R., Rao A., Hogan P. G. (2013) An siRNA screen for NFAT activation identifies septins as coordinators of store-operated Ca2+ entry. Nature 499, 238–242 [DOI] [PMC free article] [PubMed] [Google Scholar]
- 34. Kirchhausen T., Macia E., Pelish H. E. (2008) Use of dynasore, the small molecule inhibitor of dynamin, in the regulation of endocytosis. Methods Enzymol. 438, 77–93 [DOI] [PMC free article] [PubMed] [Google Scholar]
- 35. Lindau M., Neher E. (1988) Patch clamp techniques for time-resolved capacitance measurements in single cells. Pflugers Arch. 411, 137–146 [DOI] [PubMed] [Google Scholar]
- 36. Santoro B., Wainger B. J., Siegelbaum S. A. (2004) Regulation of HCN channel surface expression by a novel C-terminal protein-protein interaction. J. Neurosci. 24, 10750–10762 [DOI] [PMC free article] [PubMed] [Google Scholar]
- 37. Tsang S. Y., Lesso H., Li R. A. (2004) Dissecting the structural and functional roles of the S3-S4 linker of pacemaker (hyperpolarization-activated cyclic nucleotide-modulated) channels by systematic length alterations. J. Biol. Chem. 279, 43752–43759 [DOI] [PubMed] [Google Scholar]
- 38. Santoro B., Piskorowski R. A., Pian P., Hu L., Liu H., Siegelbaum S. A. (2009) TRIP8b splice variants form a family of auxiliary subunits that regulate gating and trafficking of HCN channels in the brain. Neuron 62, 802–813 [DOI] [PMC free article] [PubMed] [Google Scholar]
- 39. Popowicz G. M., Schleicher M., Noegel A. A., Holak T. A. (2006) Filamins: promiscuous organizers of the cytoskeleton. Trends Biochem. Sci. 31, 411–419 [DOI] [PubMed] [Google Scholar]
- 40. Jaiswal J. K., Simon S. M. (2007) Imaging single events at the cell membrane. Nat. Chem. Biol. 3, 92–98 [DOI] [PubMed] [Google Scholar]
- 41. Liu G., Thomas L., Warren R. A., Enns C. A., Cunningham C. C., Hartwig J. H., Thomas G. (1997) Cytoskeletal protein ABP-280 directs the intracellular trafficking of furin and modulates proprotein processing in the endocytic pathway. J. Cell Biol. 139, 1719–1733 [DOI] [PMC free article] [PubMed] [Google Scholar]
- 42. Cho E. Y., Cho D. I., Park J. H., Kurose H., Caron M. G., Kim K. M. (2007) Roles of protein kinase C and actin-binding protein 280 in the regulation of intracellular trafficking of dopamine D3 receptor. Mol. Endocrinol. 21, 2242–2254 [DOI] [PubMed] [Google Scholar]
- 43. Minsaas L., Planagumà J., Madziva M., Krakstad B. F., Masià-Balagué M., Katz A. A., Aragay A. M. (2010) Filamin a binds to CCR2B and regulates its internalization. PLoS ONE 5, e12212. [DOI] [PMC free article] [PubMed] [Google Scholar]
- 44. Macia E., Ehrlich M., Massol R., Boucrot E., Brunner C., Kirchhausen T. (2006) Dynasore, a cell-permeable inhibitor of dynamin. Dev. Cell 10, 839–850 [DOI] [PubMed] [Google Scholar]
- 45. Maccaferri G., Mangoni M., Lazzari A., DiFrancesco D. (1993) Properties of the hyperpolarization-activated current in rat hippocampal CA1 pyramidal cells. J. Neurophysiol. 69, 2129–2136 [DOI] [PubMed] [Google Scholar]
- 46. Liao Z., St Clair J. R., Larson E. D., Proenza C. (2011) Myristoylated peptides potentiate the funny current (I(f)) in sinoatrial myocytes. Channels 5, 115–119 [DOI] [PMC free article] [PubMed] [Google Scholar]
- 47. Petrecca K., Miller D. M., Shrier A. (2000) Localization and enhanced current density of the Kv4.2 potassium channel by interaction with the actin-binding protein filamin. J. Neurosci. 20, 8736–8744 [DOI] [PMC free article] [PubMed] [Google Scholar]
- 48. Lin R., Karpa K., Kabbani N., Goldman-Rakic P., Levenson R. (2001) Dopamine D2 and D3 receptors are linked to the actin cytoskeleton via interaction with filamin A. Proc. Natl. Acad. Sci. U.S.A. 98, 5258–5263 [DOI] [PMC free article] [PubMed] [Google Scholar]
- 49. Onoprishvili I., Andria M. L., Kramer H. K., Ancevska-Taneva N., Hiller J. M., Simon E. J. (2003) Interaction between the μ opioid receptor and filamin A is involved in receptor regulation and trafficking. Mol. Pharmacol. 64, 1092–1100 [DOI] [PubMed] [Google Scholar]
- 50. Kim E. Y., Ridgway L. D., Dryer S. E. (2007) Interactions with filamin A stimulate surface expression of large-conductance Ca2+-activated K+ channels in the absence of direct actin binding. Mol. Pharmacol. 72, 622–630 [DOI] [PubMed] [Google Scholar]
- 51. Ramakrishnan N. A., Drescher M. J., Khan K. M., Hatfield J. S., Drescher D. G. (2012) HCN1 and HCN2 proteins are expressed in cochlear hair cells: HCN1 can form a ternary complex with protocadherin 15 CD3 and F-actin-binding filamin A or can interact with HCN2. J. Biol. Chem. 287, 37628–37646 [DOI] [PMC free article] [PubMed] [Google Scholar]
- 52. Kiema T., Lad Y., Jiang P., Oxley C. L., Baldassarre M., Wegener K. L., Campbell I. D., Ylänne J., Calderwood D. A. (2006) The molecular basis of filamin binding to integrins and competition with talin. Mol. Cell 21, 337–347 [DOI] [PubMed] [Google Scholar]
- 53. Kim C., Ye F., Ginsberg M. H. (2011) Regulation of integrin activation. Annu. Rev. Cell Dev. Biol. 27, 321–345 [DOI] [PubMed] [Google Scholar]
- 54. Lewis A. S., Estep C. M., Chetkovich D. M. (2010) The fast and slow ups and downs of HCN channel regulation. Channels 4, 215–231 [DOI] [PMC free article] [PubMed] [Google Scholar]
- 55. Sampson L. J., Leyland M. L., Dart C. (2003) Direct interaction between the actin-binding protein filamin-A and the inwardly rectifying potassium channel, Kir2.1. J. Biol. Chem. 278, 41988–41997 [DOI] [PubMed] [Google Scholar]
- 56. Lin R., Canfield V., Levenson R. (2002) Dominant negative mutants of filamin A block cell surface expression of the D2 dopamine receptor. Pharmacology 66, 173–181 [DOI] [PubMed] [Google Scholar]
- 57. MacLean J. N., Zhang Y., Goeritz M. L., Casey R., Oliva R., Guckenheimer J., Harris-Warrick R. M. (2005) Activity-independent coregulation of IA and Ih in rhythmically active neurons. J. Neurophysiol. 94, 3601–3617 [DOI] [PubMed] [Google Scholar]
- 58. Amendola J., Woodhouse A., Martin-Eauclaire M.-F., Goaillard J.-M. (2012) Ca2+/cAMP-sensitive covariation of I(A) and I(H) voltage dependences tunes rebound firing in dopaminergic neurons. J. Neurosci. 32, 2166–2181 [DOI] [PMC free article] [PubMed] [Google Scholar]
- 59. Hoffman D. A., Magee J. C., Colbert C. M., Johnston D. (1997) K+ channel regulation of signal propagation in dendrites of hippocampal pyramidal neurons. Nature 387, 869–875 [DOI] [PubMed] [Google Scholar]
- 60. Kim J., Jung S.-C., Clemens A. M., Petralia R. S., Hoffman D. A. (2007) Regulation of dendritic excitability by activity-dependent trafficking of the A-type K+ channel subunit Kv4.2 in hippocampal neurons. Neuron 54, 933–947 [DOI] [PMC free article] [PubMed] [Google Scholar]
- 61. Jung S., Warner L. N., Pitsch J., Becker A. J., Poolos N. P. (2011) Rapid loss of dendritic HCN channel expression in hippocampal pyramidal neurons following status epilepticus. J. Neurosci. 31, 14291–14295 [DOI] [PMC free article] [PubMed] [Google Scholar]
- 62. Zhang W., Han S. W., McKeel D. W., Goate A., Wu J. Y. (1998) Interaction of presenilins with the filamin family of actin-binding proteins. J. Neurosci. 18, 914–922 [DOI] [PMC free article] [PubMed] [Google Scholar]
- 63. Lu Q., Ding K., Frosch M. P., Jones S., Wolfe M., Xia W., Lanford G. W. (2010) Alzheimer disease-linked presenilin mutation (PS1M146L) induces filamin expression and γ-secretase independent redistribution. J. Alzheimers Dis. 22, 235–245 [DOI] [PMC free article] [PubMed] [Google Scholar]
- 64. Wang H.-Y., Bakshi K., Frankfurt M., Stucky A., Goberdhan M., Shah S. M., Burns L. H. (2012) Reducing amyloid-related Alzheimer disease pathogenesis by a small molecule targeting filamin A. J. Neurosci. 32, 9773–9784 [DOI] [PMC free article] [PubMed] [Google Scholar]
- 65. Saito Y., Inoue T., Zhu G., Kimura N., Okada M., Nishimura M., Kimura N., Murayama S., Kaneko S., Shigemoto R., Imoto K., Suzuki T. (2012) Hyperpolarization-activated cyclic nucleotide gated channels: a potential molecular link between epileptic seizures and Aβ generation in Alzheimer disease. Mol. Neurodegener. 7, 50. [DOI] [PMC free article] [PubMed] [Google Scholar]
- 66. D'Amelio M., Rossini P. M. (2012) Brain excitability and connectivity of neuronal assemblies in Alzheimer disease: from animal models to human findings. Prog. Neurobiol. 99, 42–60 [DOI] [PubMed] [Google Scholar]
- 67. Kim C. S., Chang P. Y., Johnston D. (2012) Enhancement of dorsal hippocampal activity by knockdown of HCN1 channels leads to anxiolytic- and antidepressant-like behaviors. Neuron 75, 503–516 [DOI] [PMC free article] [PubMed] [Google Scholar]
- 68. Suphamungmee W., Nakamura F., Hartwig J. H., Lehman W. (2012) Electron microscopy and 3D reconstruction reveals filamin Ig domain binding to F-actin. J. Mol. Biol. 424, 248–256 [DOI] [PMC free article] [PubMed] [Google Scholar]