Background: PIP2 actions on activating KATP channels are not only on Kir6.2 but may be also on syntaxin-1A, to modulate syntaxin-1A actions on SUR1.
Results: PIP2 disrupts Syn-1A·SUR1 interactions by reducing syntaxin-1A availability to inhibit of KATP channels.
Conclusion: PIP2 modulates syntaxin-1A·SUR interactions.
Significance: Membrane phospholipid composition in health and diabetes profoundly affect β-cell KATP channels by several mechanisms to influence insulin secretion.
Keywords: Insulin Secretion, Phospholipid, Plasma Membrane, Potassium Channels, SNARE Proteins, ATP-sensitive Potassium Channel, Kir6.2, PIP2, SUR1, Syntaxin-1A
Abstract
In β-cells, syntaxin (Syn)-1A interacts with SUR1 to inhibit ATP-sensitive potassium channels (KATP channels). PIP2 binds the Kir6.2 subunit to open KATP channels. PIP2 also modifies Syn-1A clustering in plasma membrane (PM) that may alter Syn-1A actions on PM proteins like SUR1. Here, we assessed whether the actions of PIP2 on activating KATP channels is contributed by sequestering Syn-1A from binding SUR1. In vitro binding showed that PIP2 dose-dependently disrupted Syn-1A·SUR1 complexes, corroborated by an in vivo Forster resonance energy transfer assay showing disruption of SUR1(-EGFP)/Syn-1A(-mCherry) interaction along with increased Syn-1A cluster formation. Electrophysiological studies of rat β-cells, INS-1, and SUR1/Kir6.2-expressing HEK293 cells showed that PIP2 dose-dependent activation of KATP currents was uniformly reduced by Syn-1A. To unequivocally distinguish between PIP2 actions on Syn-1A and Kir6.2, we employed several strategies. First, we showed that PIP2-insensitive Syn-1A-5RK/A mutant complex with SUR1 could not be disrupted by PIP2, consequently reducing PIP2 activation of KATP channels. Next, Syn-1A·SUR1 complex modulation of KATP channels could be observed at a physiologically low PIP2 concentration that did not disrupt the Syn-1A·SUR1 complex, compared with higher PIP2 concentrations acting directly on Kir6.2. These effects were specific to PIP2 and not observed with physiologic concentrations of other phospholipids. Finally, depleting endogenous PIP2 with polyphosphoinositide phosphatase synaptojanin-1, known to disperse Syn-1A clusters, freed Syn-1A from Syn-1A clusters to bind SUR1, causing inhibition of KATP channels that could no longer be further inhibited by exogenous Syn-1A. These results taken together indicate that PIP2 affects islet β-cell KATP channels not only by its actions on Kir6.2 but also by sequestering Syn-1A to modulate Syn-1A availability and its interactions with SUR1 on PM.
Introduction
Pancreatic β-cell regulates glucose-stimulated insulin secretion through association with ATP-sensitive potassium channels (KATP channels).4 The KATP channel is a hetero-octamer with four Kir6.2 (inward rectifier K+ 6.2) subunits forming a conduction channel surrounded by four regulatory SUR1 subunits (1). β-Cell plasma membrane (PM) excitability and insulin secretion are set by concentration of nucleotides, ATP, and ADP (2, 3). The physiologic β-cell secretagogue is glucose, which, upon entry and metabolism in β-cells, increases ATP production, causing KATP channel closure leading to cellular depolarization (4), which activates L-type voltage-dependent Ca2+ channels, with resulting Ca2+ influx triggering exocytotic fusion of insulin granules with PM (4, 5). Conversely, when plasma glucose levels fall, increase in ADP and decrease in ATP concentrations lead to KATP channel activation, with ensuing PM hyperpolarization, which reduces insulin release.
In addition to adenine nucleotides, KATP channels are regulated by other endogenous factors in β-cells, particularly phosphatidylinositol 4,5-biphosphate (PIP2). PIP2, comprising only 1% of PM phospholipids, stimulates activity of ATP-sensitive and -insensitive Kir channels by increasing channel open probability (6). PIP2 is an indispensable membrane phosphoinositide that participates in a wide variety of other cellular functions, including production of second messengers, endo- and exocytosis, and regulation of ion channels, transporters, and actin cytoskeleton (7–11). For KATP channel regulation, a negatively charged inositol triphosphate headgroup of PIP2 interacts electrostatically with positively charged amino acid residues in N- and C-terminal cytoplasmic domains of Kir6.2 (12, 13). However, several studies demonstrated that the SUR subunit plays an essential role in stabilizing PIP2-Kir6.2 interaction. For instance, a brief application of PIP2 shifted ATP inhibition of Kir6.1/SUR1 channels compared with Kir6.2 alone, and this PIP2 recovery was more stable when SUR1 was present, thus indicating that SUR increases PIP2 binding and stimulation on Kir6.2 (14, 15). A recent report showed that a mutation in SUR1-TMD0 induces spontaneous Kir6.2 current decay and was reversed with exogenous PIP2 (16). PIP2 therefore plays versatile roles in controlling β-cell KATP channel activities and insulin exocytosis (12, 17). Lin et al. (18) showed that disrupting KATP channel and PIP2 interaction by overexpressing PIP2-insensitive Kir6.2 mutants caused cellular depolarization and elevated basal insulin secretion. Conversely, up-regulation of PIP2 expression causing activation of KATP channels resulted in cellular hyperpolarization, which reduced insulin secretion despite the presence of high glucose (18).
Besides the aforementioned actions of PIP2 on various ion channels, PIP2 also interacts with various components of the exocytotic fusion machinery, including CAPS, synaptotagmins, rabphilin, and Syn-1A (19–23). Syn-1A is one of three SNARE (soluble N-ethylmaleimide-sensitive factor attachment protein receptor) proteins that form the ternary complex constituting the minimal membrane fusion machinery in neurons and neuroendocrine cells (24). Besides its role in membrane fusion machinery, Syn-1A appears to play additional roles in the secretory process, effectively regulating various calcium and potassium channels involved in both initiating and terminating exocytosis (25).
In a body of work, we have shown that Syn-1A could act as an endogenous regulator exhibiting potent inhibitory action on β-cell KATP channels (25–28). We identified specific conserved motifs within the nucleotide binding domains of SUR1 that functionally interact with Syn-1A (28). Syn-1A contains highly charged, polybasic juxtamembrane motif in which neutralizing mutations abrogated Syn-1A-PIP2 electrostatic interaction, causing a reduction in exocytosis by influencing the clustering of Syn-1A molecules on PM required for efficient membrane fusion (21, 22). In this study, we investigated the hypothesis that these actions of PIP2 on Syn-1A could influence Syn-1A interactions with SUR1 to affect KATP channel activities in β-cells.
EXPERIMENTAL PROCEDURES
Material
Syn-1A mutant in which highly conserved polybasic juxtamembrane residues (within the cytoplasmic domain) between positions 260 and 265 (Lys-260, -264, and -265; Arg-262 and -263) constituting the major lipid-binding domain were mutated to alanine, called the Syn-1A-5RK/A mutant (gift from Ed Stuenkel, University of Michigan, Ann Arbor, MI), which abrogates Syn-1A binding to PIP2 (29). A polyphosphoinositide 5-phosphatase synaptojanin 1 (HA-IPP1-CAAX tagged with RFP) construct in pcDNA3 (a gift from Geert van den Bogaart and Reinhard Jahn, Max-Planck Institute for Biophysical Chemistry, Gottingen, Germany) was used to deplete endogenous PI(4,5)P2 from the PM (30, 31).
Pancreatic Islet β-Cell Isolation
Single male Wistar rat pancreatic β-cells were enzymatically dispersed from isolated islets as described (32), plated on coverslips, and cultured in RPMI 1640 (supplemented with 2.8 mm glucose, 7.5% FCS, 0.25% sodium, 100 μg/ml streptomycin) prior to recordings.
HEK293 Cell Transfection
To examine the differences between Syn-1A-WT and Syn-1A-5RK/A, HEK293 cells were co-transfected with rat Kir6.2 (gift from S. Seino, Chiba University, Chiba, Japan) and SUR1-EGFP (gift from C. G. Nichols, Washington University, St. Louis, MO) and then trypsinized and plated on glass coverslips for 17–18 h prior to electrophysiological experiments. For FRET imaging recording, HEK293 cells were co-transfected with full-length Syn-1A (aa 1–288)-mCherry or full-length Syn-1A-5RK/A-mCherry (acceptor) and SUR1-EGFP (donor) as reported (33), along with Kir6.2, using Lipofectamine 2000 (Invitrogen). FRET imaging was conducted 2 days after transfection.
In Vitro Binding Assay and Western Blotting
In vitro binding assays were performed as described (34). Briefly, 250 pmol of GST (control) and GST-Syn-1A (aa 1–265) or GST-Syn-1A-5RK/A (aa 1–265), both containing only the cytoplasmic domain bound to glutathione-agarose beads, were incubated with lysate extract of HEK293 cells (400 μg of protein) co-transfected with SUR1 and Kir6.2 in lysis buffer in the presence of increasing concentrations of PIP2 or other indicated phospholipids (Echelon Biosciences Inc.) at 4 °C for 2 h with constant agitation. Beads were washed three times, and samples were separated on 10% SDS-PAGE, transferred to nitrocellulose membrane, and identified with anti-SUR1 antibody (1:1,000; gift from J. Ferrer, Barcelona, Spain).
Electrophysiology
KATP channel recordings were performed on INS-1E cells using the inside-out patch clamp technique (35) and on rat β-cells and HEK293 cells using the whole-cell patch-clamp technique. Pipette resistance when filled with solution was 1.0–1.5 megaohms. GST, GST-Syn-1A, ATP (Sigma-Aldrich) and PIP2 (Sigma-Aldrich) were perfused onto the cytoplasmic side of excised membrane patches. Membrane patches were held at −50 mV to evoke inward currents. For β-cell, HEK293, and INS-1 cell voltage-clamped whole-cell studies, membrane potential was held at −70 mV, and a pulse of −140 mV (500 ms) was given every 10 s to monitor KATP current magnitude. Pipette resistance was 2–4 megaohms. Bath solution contained 140 mm NaCl, 4 mm KCl, 1 mm MgCl2, 2 mm CaCl2, 10 mm HEPES, 2 mm glucose, pH 7.3. Pipette solution contained 140 mm KCl, 1 mm MgCl2, 1 mm EGTA, 10 mm HEPES, pH 7.25. GST, GST-Syn-1A, and PIP2 were added to intracellular solution for dialysis into cells via patch pipette. Tolbultamide (0.1 mm; Tolb) was perfused into bath solution after maximum current reached to completely inhibit and verify the KATP current. All recordings were carried out at 22–24 °C using an EPC10 amplifier with Pulse version 8.77 acquisition software (HEKA Electronik, Lambrecht, Germany). Data were sampled at 1 kHz.
FRET Imaging
As described previously (33), FRET study by total internal reflection fluorescence microscopy (TIRFM) assesses molecular interactions on the surface of PM, avoiding contamination from intracellular FRET signals. HEK293 cells were transfected with different combinations of plasmids 2 days prior to the experiment, where EGFP fused with SUR1 was used as the FRET donor, and mCherry fused with full-length Syn-1A or full-length Syn-1A-5RK/A was used as the FRET acceptor; Kir6.2 co-infected to express functional KATP channels localized correctly on PM. For FRET analysis, four images, including donor excitation/donor emission (Dd), donor excitation/acceptor emission (Da), acceptor excitation/acceptor emission (Aa), and acceptor excitation/donor emission (Ad), were acquired under same conditions. Donor-only and acceptor-only samples were acquired at the beginning of each experiment for bleed-through calculation. FRET efficiency was used to indicate interaction of the two proteins, calculated with the equation, FRET efficiency % = (((FRETraw − (CoB × DdFRET) − (CoA × AaFRET))/DdFRET) × 100%, where CoB is the amount of donor bleed-through in the absence of acceptor, and CoA is the amount of acceptor bleed-through in the absence of donor.
After baseline FRET images were taken, the cells were permeabilized with digitonin (10 μg/ml in intracellular buffer, 5 min, 37 °C). FRET images were then taken again, followed by perfusion with the indicated lipids for another 5 min, and then we waited for another 7–10 min before the final FRET images were captured. Intracellular buffer contained 20 mm HEPES, 5 mm NaCl, 140 mm potassium gluconate, and MgCl2, pre-equilibrated with O2/CO2 = 95:5, pH 7.4, at 37 °C. PIP2, powder dissolved in double-distilled H2O, was sonicated for 30–45 s to a stock concentration of 920 mm (per the manufacturer's instructions). This PIP2 stock was diluted to the indicated concentrations in intracellular buffer and sonicated again for 30 s before adding to the cells.
Statistical Analysis
For statistical analysis of FRET efficiency, regions of interest were drawn around entire areas of the PM surface expressing any FRET signal (blue, green, or red; see the pseudocolor bar in Figs. 5, 7, and 9) as indicated, not including the purple areas having no FRET signal. From these regions of interest, FRET efficiency was calculated as mean ± S.E., and values were compared using the Mann-Whitney test by SigmaStat version 3.1 (Systat Software Inc., Chicago, IL). For electrophysiological experiments, data analysis was done using SigmaPlot version 11.0 (Systat Software Inc.). Data obtained from concentration-response curves were fitted to the drug responsiveness equation, Y = ((A1 − A2)/(1 + (X + X0)p)) + A2. Where Y is KATP current at different [PIP2], A1 is KATP current before PIP2 application, A2 is maximal KATP current activated by PIP2, X denotes [PIP2] applied to membrane patches, X0 denotes [PIP2] that produced half-maximal KATP channel activation, and p is slope of the curve. Curve fitting was performed by Origin version 6.0. Inside-out electrophysiological data were analyzed using each cell as its own control. Whole-cell electrophysiological data are presented as mean ± S.E., expressed as current normalized to cell capacitance (pA/pF). For multiple groups, channel activity was compared using one-way analysis of variance, followed by the Student-Newman-Keuls post hoc test. For the binding assay and Western blotting, blots were quantified by densitometry scanning followed by analysis with Scion Image (beta-4.0.2, Scion Corp.). Data were compared using Student's t test. We considered p < 0.05 as a significant difference.
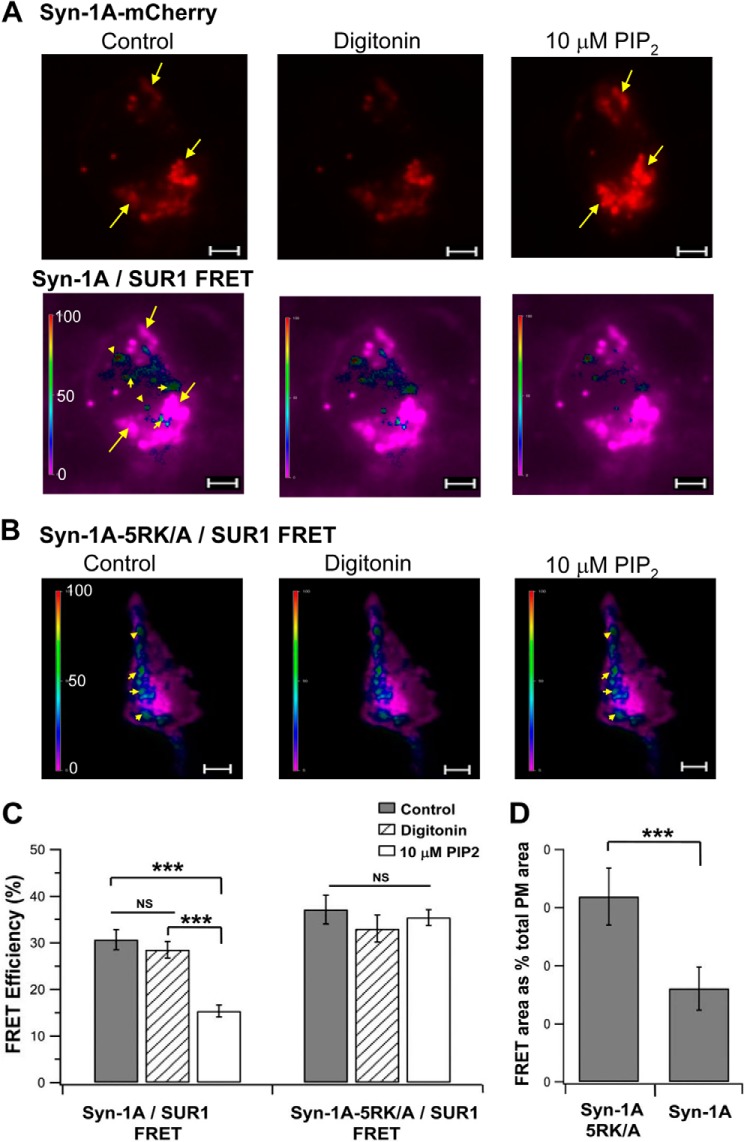
FIGURE 5.
In vivo TIRFM FRET imaging showing that PIP2 disrupts Syn-1A WT but not PIP2-insensitive Syn-1A-5RK/A binding to SUR1. Shown in A and B are representative recordings of FRET signals on the PM (indicated by different pseudocolors) of HEK cell expressing WT-Syn-1A-mCherry (A) or Syn-1A-5RK/A-mCherry (B), SUR1-EGFP, and Kir6.2 prior to (control) and after the addition of 10 μm PIP2 to the permeabilized cells. In A, the Syn-1A-mCherry fluorescent images are also shown (top images). Arrows in A, Syn-1A-mCherry hotspots; arrowheads in A and B, FRET hotspots. Scale bar, 5 μm. A vertical scale bar indicates FRET efficiency in pseudocolor. C, summary of FRET efficiency represented by images in A (n = 17) and B (n = 13). D, percentage of FRET fluorescent area on PM as a percentage of total PM area under control conditions (n = 13). Results are mean ± S.E. (error bars); ***, p < 0.001; NS, not significant.
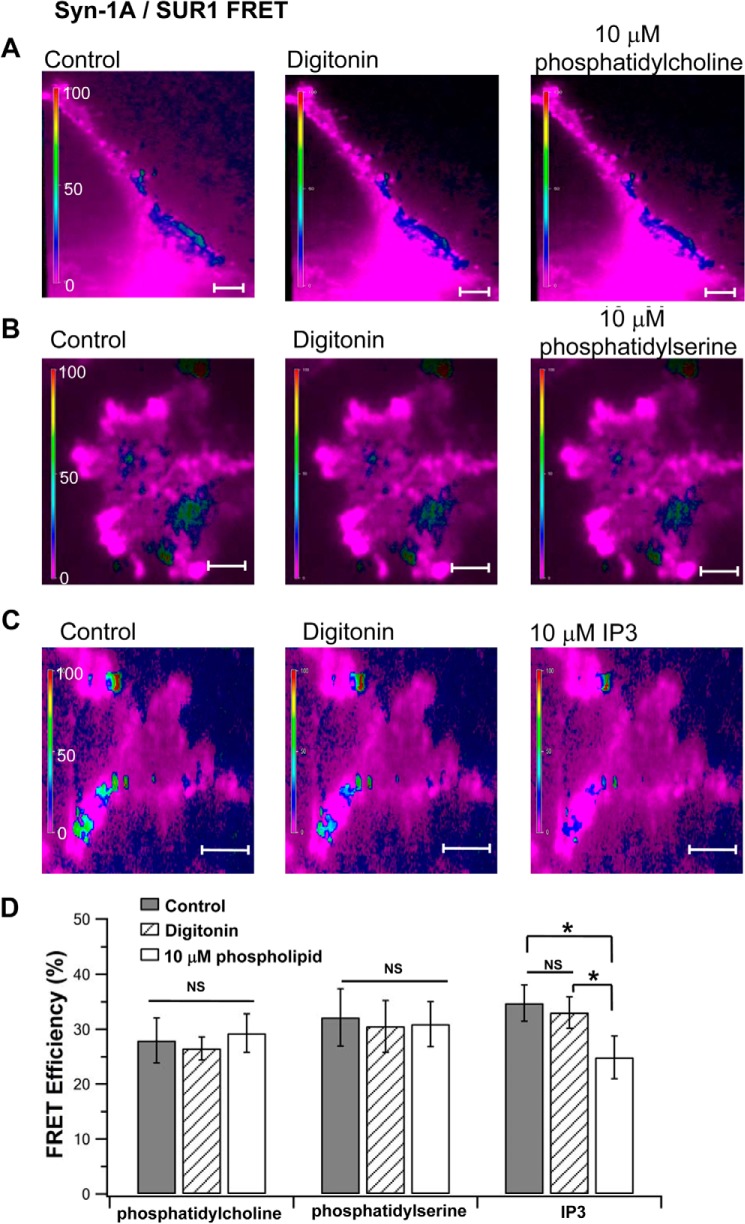
FIGURE 7.
In vivo FRET TIRFM imaging showing other phospholipids had little or no effect on Syn-1A·SUR1 complexes. 10 μm phosphatidylcholine (A), phosphatidyl-l-serine (B), and IP3 (C) were added to digitonin-permeabilized HEK cells expressing WT-Syn-1A-mCherry and SUR1-EGFP (as in Fig. 5). Shown are representative cells for each condition. D, summary of FRET efficiency (mean ± S.E. (error bars)) of A (n = 14), B (n = 13), and C (n = 15). *, p < 0.01; NS, not significant.
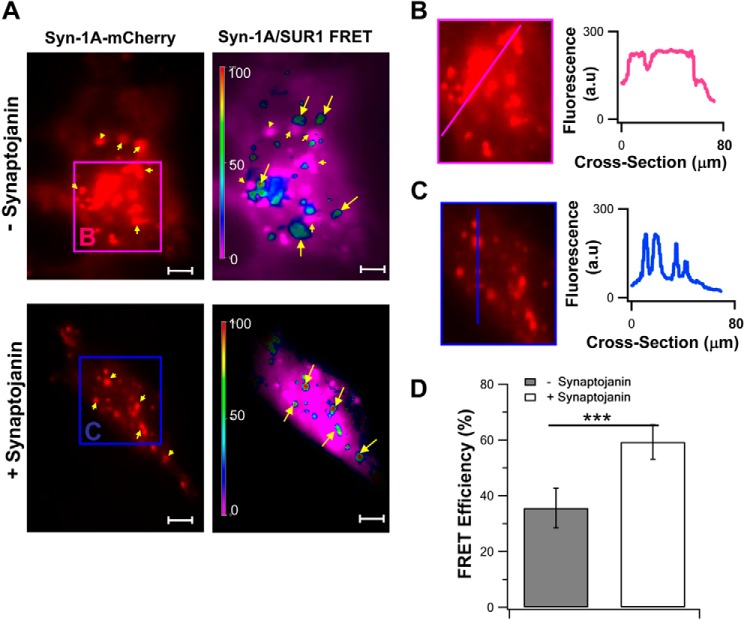
FIGURE 9.
TIRFM FRET imaging showing that PIP2 depletion from PM disperses Syn-1A clusters, releasing Syn-1A to form complexes with SUR1. A, representative image recordings of Syn-1A-mCherry and corresponding FRET signals on the PM (indicated by different pseudocolors) of HEK293 cells expressing Syn-1A-mCherry, SUR1-EGFP, and Kir6.2. The top images show that Syn-1A-mCherry (indicated by arrowheads) clustered in microdomains (region B; pink box). Synaptojanin-1 expression to reduce endogenous PIP2 levels (bottom images in A) dispersed Syn-1A clusters into smaller Syn-1A-mCherry hotspots (region C; blue box). B and C, magnifications of the indicated regions in (A), wherein we analyzed the intensity profile of the cross-sections along the pink and blue lines, shown in the graphs on the right. D, summary of FRET efficiency represented by images in A (mean ± S.E. (error bars), n = 14 cells for each group; ***, p < 0.001).
RESULTS
PIP2 Dose-dependently Inhibits Syntaxin-1A Binding to SUR1
A Substantial body of evidence indicates that highly negatively charged membrane phosphatidylinositol polyphosphates interact with positively charged residues on the N and C termini of the cytoplastic domains of Kir channels (14, 35, 36). In addition, it is well established that highly charged, polybasic juxtamembrane regions of Syn-1A interact with PIP2 (29); thus, the SNARE fusion machinery itself may be a target of regulation by phosphoinositides (22, 29, 37). Although there is strong evidence for the role of PIP2 on Kir6.2 and SNARE protein interactions, we here explored the possibility that PIP2 could activate KATP channels in a manner contributed by its actions on Syn-1A, which, in turn, perturbs Syn-1A binding to SUR1.
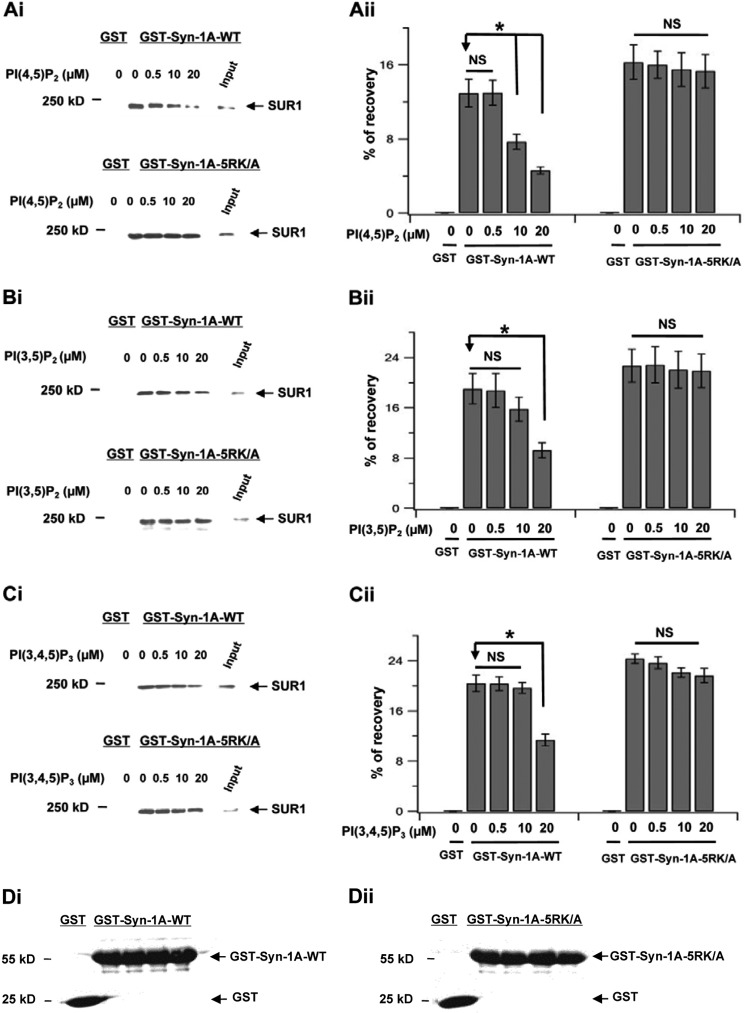
We examined whether increasing PIP2 concentrations can disrupt Syn-1A binding to SUR1 by employing in vitro binding assays. GST-Syn-1A-bound glutathione-agarose beads were used to pull down SUR1 from lysate extracts of HEK293 cells co-infected with SUR1 and Kir6.2. After adding increasing PIP2 concentrations (Fig. 1A), SUR1 binding to GST-Syn-1A did not decrease at 0.5 μm but was reduced by 41% at a physiologic concentration of 10 μm (38) and by 65% at 20 μm (n = 3; Fig. 1A). GST, as negative control, did not pull down SUR1. Importantly, GST-Syn-1A contains the cytoplasmic domain (aa 1–265) and no transmembrane domain (aa 266–288), and the PIP2-binding domain is located at aa 260–265 (29). This indicates that PIP2 binding of this Syn-1A cytoplasmic domain is sufficient to sequester Syn-1A and disrupt Syn-1A·SUR1 interactions. To demonstrate that these effects are selective to PIP2 (PI(4,5)P2 (38), we further assessed the effects of PI(3,5)P2 (Fig. 1B), which has a negative charge similar to PI(4,5)P2 and PIP3 (PI(3,4,5)P3; Fig. 1C), which has a stronger negative charge. At a physiologic concentration of 10 μm, the other phospholipids had little (PI(3,5)P2; reduced by 17%, not significant) or no effect (PIP3) on Syn-1A·SUR1 binding. At the highest concentration of 20 μm, these phospholipids disrupted Syn-1A·SUR1 binding but to a much lesser extent than PI(4,5)P2 (at 65% reduction), for PI(3,5)P2 (at 51% reduction) or PIP3 (at 44% reduction). Importantly, PIP2 is abundant in mammalian cells, whereas the other phospholipids are minor and not likely to reach these high concentrations (38). We then proceeded to dissect the functional implications PIP2 disruption of Syn-1A·SUR1 interactions.
FIGURE 1.
Exogenously added PIP2 disruption of Syn-1A·SUR1 complex formation. GST-Syn-1A-WT or GST-Syn-1A-5RK/A and GST (as control) were used to pull down SUR1 from HEK293 cells co-transfected with SUR1 and Kir6.2 in presence of indicated concentrations of the following inositol phospholipids: PIP2 (PI(4,5)P2 in A), PI(3,5)P2 (B), and PI(3,4,5)P3 (C). i (in A–C), representative blots showing the effects of increasing inositol phospholipids concentrations in disrupting Syn-1A binding to SUR1 (top) but not Syn-1A-5RK/A binding to SUR1 (bottom). ii (in A–C), summary of three separate experiments, with each band normalized as a percentage of the input (400-μg protein of HEK cell lysate extract; see “Experimental Procedures”). Data are expressed as mean ± S.E. (error bars); *, p < 0.05. NS, not significant. D, 20 μg of protein of GST-Syn-1A or GST-Syn-1A-5RK/A and control GST uniformly used in all of the samples of these experiments was assessed by Ponceau S staining. A representative sample in D shows equal amounts used. i, GST-Syn-1A WT; ii, GST-Syn-1A-5RK/A.
PIP2 Activation of Kir6.2/SUR1 Channels Is Reduced by Syn-1A
We examined PIP2 dose-response activation of the KATP channel on INS-1E cells in the absence and presence of 1 μm GST-Syn-1A using an inside-out patch clamp technique. Membrane patches were held at −50 mV to induce inward currents. Fig. 2, A and B, shows representative traces of the protocol utilized for PIP2 in the absence and presence of Syn-1A. Membrane patches were initially exposed to 0, 1, and 3 mm ATP Kint solution to characterize KATP channels and verify the ATP sensitivity of recorded currents. In Fig. 2A, after patch excision, channels rapidly run down in the absence of ATP; however, subsequent exposure to 5, 10, and 20 μm PIP2 gradually recovered the currents to the level observed immediately after patch excision. Consistent with previous reports, prior to PIP2 applications, both 1 and 3 mm ATP inhibited KATP channels; however, three subsequent applications of PIP2 decreased ATP sensitivity and completely abolished the inhibitory effect of 1 mm ATP, as reported previously (14). Of note, Fig. 2B shows that concomitant application of GST-Syn-1A and PIP2 did not completely recover the channels after rundown. In addition, in the presence of GST-Syn-1A, reapplication of ATP after PIP2 activation did not produce any less current inhibition. In Fig. 2C, adding GST-Syn-1A greatly reduced PIP2-mediated channel activation, causing a rightward shift of the dose response. EC50 values for PIP2 in the absence and presence of GST-Syn-1A are 2.38 ± 0.81 (n = 5) and 9.64 ± 0.14 (n = 3), respectively. Our results indicate that exogenously added GST-Syn-1A inhibits KATP channels through direct binding and interaction with SUR1 at its cytoplasmic nucleotide-binding folds (NBF-1 and NBF-2), as we reported previously (34), and that Syn-1A regulates KATP channels through PIP2 interactions. For the latter finding, our results suggest that the exogenous PIP2 bound GST-Syn-1A (as shown in the binding study in Fig. 1A) rather than becoming incorporated into the PM to affect endogenous PM-bound Syn-1A. From Fig. 2C, we selected 10 μm PIP2 to further study and analyze PIP2-Syn-1A interactions and their effects on KATP channel activities in the studies in Figs. 3 and 4.
FIGURE 2.
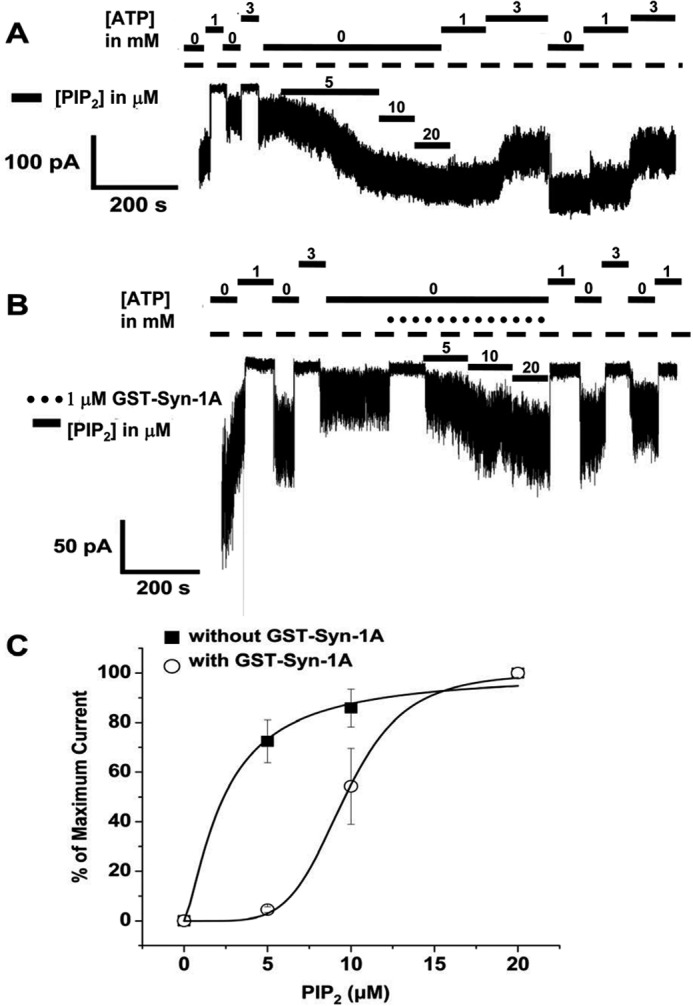
Inside-out patch recording of INS-1 cells showing that PIP2 dose-dependent activation of KATP channels is reduced by Syn-1A. Shown are representative traces of the protocol utilized for PIP2 (as shown) in the absence (A) or presence (B) of 1 μm GST-Syn-1A. Membrane patches were initially exposed to 0, 1, and 3 mm ATP Kint solution to characterize KATP channels and verify the ATP sensitivity of the currents recorded. C, PIP2 dose-dependent activation of KATP current in the absence (n = 5) and presence of Syn-1A (n = 3). Results are mean ± S.E. (error bars).
FIGURE 3.
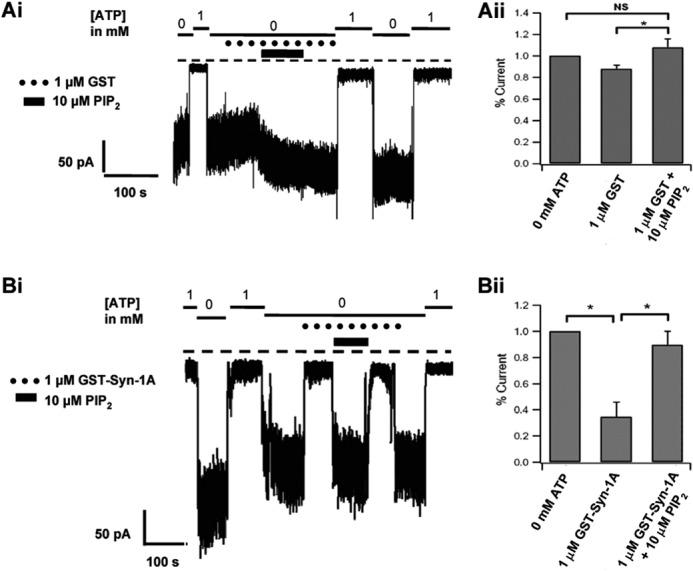
Inside-out patch recording of INS-1 cells showing PIP2 activation KATP currents exceeds PIP2-mediated recovery of Syn-1A inhibition of KATP currents. Representative KATP current tracings of 1 μm GST with 10 μm PIP2 (Ai) and 1 μm GST-Syn-1A with 10 μm PIP2 (Bi) and their respective summary data (Aii and Bii; n = 5 cells each) of the maximum current (in 0 mm ATP Kint solution). Here, membrane patches were initially exposed to 0 and 1 mm ATP Kint solution. Results are mean ± S.E. (error bars); *, p < 0.05; NS, not significant.
FIGURE 4.
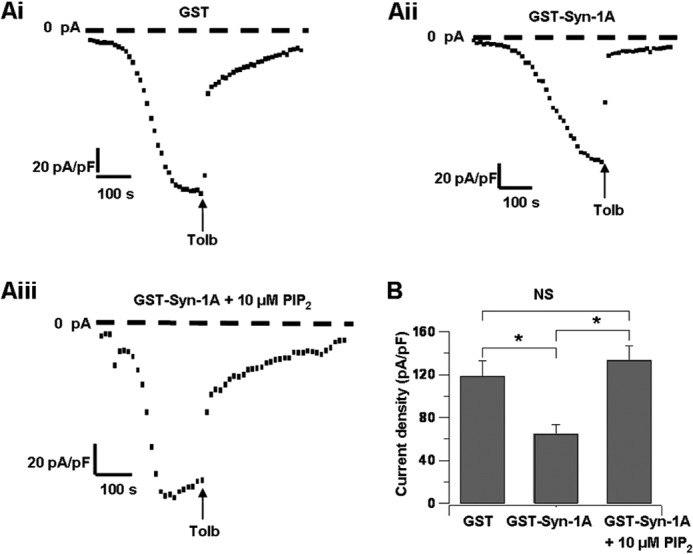
Whole-cell recording of rat islet β-cells showing PIP2 actions on Syn-1A to functionally disrupt Syn-1A·SUR1 interactions. A, representative KATP currents with 1 μm GST (i), 1 μm GST-Syn-1A (ii), or 1 μm GST-Syn-1A plus 10 μm PIP2 (iii) dialyzed into β-cells. Tolbultamide (Tolb; 0.1 mm) was added to verify the KATP current. B, summary data of A showing maximum current density with 1 μm GST (n = 6), 1 μm GST-Syn-1A (n = 8), or 1 μm GST-Syn-1A plus 10 μm PIP2 (n = 11). Results are mean ± S.E. (error bars); *, p < 0.05.
We performed the converse experiment of inside-out recordings of INS-1E cells perfused with GST-Syn-1A (1 μm; indicated by black circles above the current traces) in the presence or absence of PIP2 (10 μm; indicated by solid bars). The summarized results are expressed as percentages of maximum current elicited at 0 mm ATP Kint solution determined in each patch. Fig. 3Ai shows the representative KATP current tracing of GST with PIP2, and the corresponding summary data are shown in Fig. 3Aii (n = 5). Here, KATP currents underwent spontaneous decay in the absence of ATP; subsequent perfusion of PIP2 in the continuous presence of GST increased channel activities. When comparing KATP currents between GST alone (87.9 ± 3.62% of control maximal current) and subsequent perfusion of GST and PIP2, PIP2 exposure led to a pronounced increase in KATP current (108.06 ± 7.77%), which appeared larger but not significantly different from the initial current immediately after patch excision (0 mm ATP Kint) (Fig. 2B). These results indicate that after patch excision, KATP channels undergo spontaneous rundown, and subsequent PIP2 exposure led to recovery of channel activity. In Fig. 3, Bi and Bii), administration of GST-Syn-1A alone reduced maximum control KATP currents by ∼65.4% (n = 5). When comparing KATP currents between GST-Syn-1A alone and subsequent concomitant perfusion of GST-Syn-1A and PIP2, PIP2 recovered Syn-1A-inhibited currents to 89.6 ± 10.52% of maximal currents (n = 5), but the currents never reached that seen immediately after patch excision. These results taken together indicate that PIP2 activation of KATP currents exceeds PIP2-mediated recovery of Syn-1A inhibition of KATP currents. This is probably because of PIP2 direct actions on the Kir6.2 subunit (12, 13).
PIP2 Acts on Syn-1A to Functionally Disrupt Syn-1A·SUR1 Interactions in Rat β-Cells
To delineate the physiological relevance of our findings in INS-1E, we employed rat islet β-cells using whole-cell patch clamp recordings. 1 μm GST, 1 μm GST-Syn-1A, or a combination of 1 μm GST-Syn-1A and 10 μm PIP2 was dialyzed into β-cells via a patch pipette. In the presence of 1 μm GST only (Fig. 4, Ai and B), KATP currents gradually developed in β-cells, reaching a maximum current density of 118.97 ± 13.79 pA/pF (n = 6). In contrast, dialyzing 1 μm GST-Syn-1A (Fig. 4, Aii and B) reduced KATP channel density (65.16 ± 8.62 pA/pF, n = 8). In accordance with the aforementioned INS-1E studies, concomitant dialysis of 1 μm GST-Syn-1A and 10 μm PIP2 (Fig. 4, Aiii and B) gave a maximum current density of 133.48 ± 13.41 pA/pF (n = 11). These results, taken together with the results in Figs. 1–3, suggest that exogenous PIP2 and GST-Syn-1A seemed to bind and sequester each other from acting on the KATP channel, with PIP2 sequestration of GST-Syn-1A disrupting Syn-1A·SUR1 interactions and GST-Syn-1A sequestration of PIP2 reducing PIP2 actions on Kir6.2.
PIP2-insenstive Syn-1A-5RK/A Mutant Reduces PIP2 Opening of KATP Channels
Mutations at the Syn-1A juxtamembrane five basic residues (Lys-260, -264, and -265 and Arg-262 and -263), called Syn-1A-5RK/A, rendered Syn-1A PIP2-insensitive (29). The postulate is that if Syn-1A-5RK/A mutant inhibitory actions on KATP channels would not be disrupted by PIP2, then PIP2 activation of KATP channels may be reduced. Furthermore, the contribution of Syn-1A inhibitory action on SUR1 may be able to oppose the direct actions of PIP2 on Kir6.2 in opening the channel.
We first examined the effects of PIP2 on Syn-1A-5RK/A binding to SUR1 employing two assays, an in vitro binding assay (Fig. 1A) and in vivo FRET assay (Fig. 5). In contrast to PIP2 dose-dependent disruption of GST-Syn-1A-WT protein binding to SUR1 (in SUR1/Kir6.2-expressing HEK cells), GST-Syn-1A-5RK/A (containing only cytoplasmic domain aa 1–265) binding to SUR1 remained intact (i.e. unperturbed by PI(4,5)P2 (Fig. 1A), PI(3,5)P2 (Fig. 1B), or PI(3,4,5)P3 (Fig. 1C)). When the amount of GST-Syn-1A binding to SUR1 was assessed as a percentage of total HEK cell SUR1 input content, it appeared that GST-Syn-1A-5RK/A·SUR1 complexes (16.28 ± 1.86, n = 3) were 27% higher than GST-Syn-1A·SUR1 complexes (12.86 ± 1.49; Fig. 1A). These results indicate that Syn-1A is able to bind SUR1 tightly in vitro in the absence of PIP2 and that Syn-1A binds SUR1 at other H3 domains (27) outside the PIP2-binding domain.
The previous studies in Figs. 1–4 examined the effects of exogenously added GST-Syn-1A (containing only the cytoplasmic domain) and PIP2 on KATP channels. Live cell FRET imaging analysis enables the examination of full-length Syn-1A-mCherry versus full-length Syn-1A-5RK/A-mCherry and SUR1-EGFP expressed in HEK293 cells. Here, we assessed whether PIP2 can disrupt their in vivo (thus physiological) interactions on PM by TIRF imaging (Fig. 5), which optically isolates the PM surface (see “Experimental Procedures”). HEK293 cells were permeabilized with digitonin to permit entry of PIP2 (10 μm). Of note, the addition of this physiologic PIP2 concentration seemed to increase the fluorescence intensity of the Syn-1A-mCherry hotspots (indicated by arrows), suggesting an increase in Syn-1A-mCherry cluster formation in these PM areas (Fig. 5A, top images). Remarkably, in the same experiment (Fig. 5A, bottom images), the 10 μm PIP2 disrupted Syn-1A·SUR1 complexes (indicated by arrowheads), shown as a reduction of FRET efficiency from 30.69 ± 2.2 to 15.381 ± 1.3 (Fig. 5, A and C). This was a ∼50% reduction, which, when taken with the similar disruption of GST-Syn-1A·SUR1 complexes in the protein-binding study (Fig. 1A), suggests that PIP2 disruption of Syn-1A·SUR1 complexes seems to “free” more Syn-1A molecules to participate in the formation of Syn-1A clusters, the latter also promoted by PIP2. Remarkably, PIP2 did not disrupt Syn-1A-5RK/A·SUR1 complexes (indicated by arrowheads in Fig. 5B; no PIP2, 37.14 ± 3.1; with PIP2, 35.42 ± 1.7 (Fig. 5C)). We noted larger areas of Syn-1A-5RK/A·SUR1 FRET fluorescence (Fig. 5B) than Syn-1A·SUR1 fluorescence (Fig. 5A, bottom). Thus, we calculated the fluorescent area against total PM area (Fig. 5D) and found that the Syn-1A-RK/A·SUR1 FRET area occupied 31.9 ± 4.9%, which is 198% of the Syn-1A·SUR1 FRET area of 16.1 ± 3.7%. Along with the binding studies in Fig. 1A, it seems that the Syn-1A-5KR/A mutation increased its abundance on the PM from increased formation of Syn-1A-5RK/A·SUR1 complexes. Last, we noticed that the locations of Syn-1A·SUR1 FRET signals (Fig. 5A, bottom; indicated by arrowheads) were mostly not colocalized with the areas with abundant Syn-1A-mCherry (Fig. 5A, top and bottom; indicated by arrows), an important point that we discuss further below along with the results in Fig. 9. In these studies, we were a little surprised by these strongly positive results because we had initially expected that exogenously added PIP2 would not incorporate substantially into the PM (30), thus exhibiting lesser effects on the Syn-1A·SUR1 interactions in the PM. The most likely explanation is that PIP2 incorporates into PM through lipid tails over time, which would occur with greater frequency the longer duration PIP2 in solubilized solution is exposed to the interior surface of the cell. Another explanation is that digitonin (used for permeabilization) affects PM cholesterol in a manner that could influence PIP2 incorporation into PM or increase the sensitivity to PIP2 promotion of Syn-1A cluster formation in the PM (21, 22). Digitonin permeabilization (prior to the addition of PIP2), however, did not independently affect Syn-1A cluster formation or Syn-1A·SUR1 FRET interactions (Fig. 5A). Alternatively, PM permeabilization might have led to inadvertent depletion of some cytosolic factors that can influence the state of Syn-1A (free versus complexed) or the sensitivity of Syn-1A·SUR1 complex disruption by PIP2.
We then determined the functional implications of these binding studies by examining whether PIP2 activation of KATP channels in INS-1 cells would be perturbed by the PIP2-insenstive mutation of Syn-1A. As shown in Fig. 6A (analysis in Fig. 6C), dialyzing INS-1 cells with standard pipette solution displayed a KATP channel current density of 100.3 ± 18.7 pA/pF (−140 mV stimulation, used as control in Fig. 6C). Under identical conditions, overexpression of full-length Syn-1A-WT plasmid in INS-1 cells (Fig. 6A, left traces) reduced KATP channel current density to 29% (29.1 ± 4.2 pA/pF; Fig. 6C) of control. Application of 1 μm PIP2 (a physiologically lower concentration than 10 μm PIP2 used in previous binding and functional studies) blunted the overexpressed Syn-1A inhibition to 60% of control (60.2 ± 5.4 pA/pF). In contrast, overexpression of Syn-1A-5RK/A (Fig. 6A, right traces; analysis in Fig. 6C) into INS-1 cells reduced KATP channel current to 18.6% of control (18.6 ± 2.1 pA/pF), which was a further 36% reduction from that caused by overexpressed Syn-1A (p < 0.05). This more potent inhibition of KATP channel activity by Syn-1A-5RK/A is consistent with increased Syn-1A-5RK/A·SUR1 complex formation in PM (Figs. 1 and 5D). Remarkably, the addition of 1 μm PIP2 could not increase KATP current inhibited by overexpressed Syn-1A-5RK/A (14.9 ± 3.1 pA/pF; Fig. 6A, right traces; analysis in Fig. 6C).
FIGURE 6.
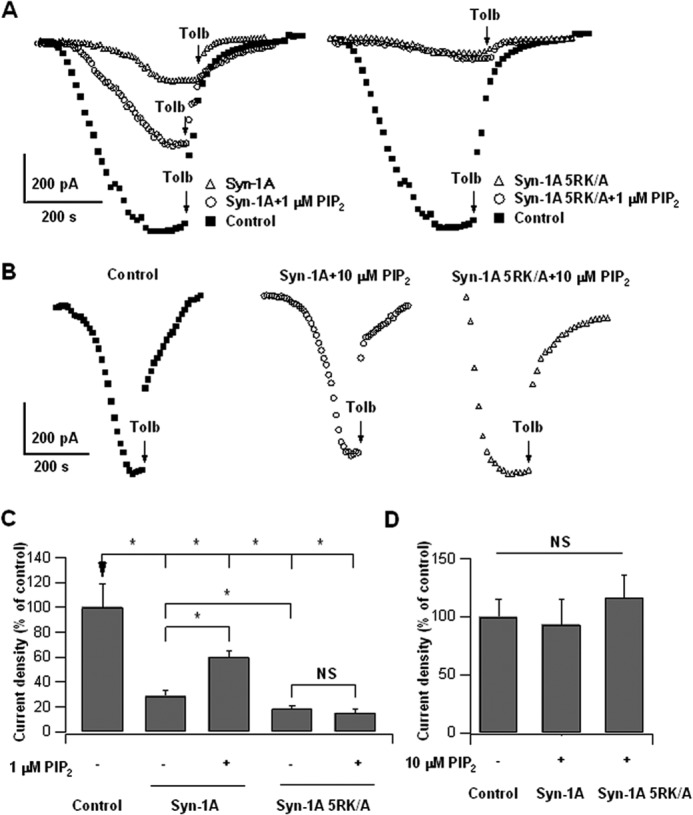
Syn-1A-5RK/A inhibition of KATP channels is resistant to physiologic low PIP2 (1 μm) but not high PIP2 (10 μm) opening of KATP channels. A, representative KATP channel current tracings of Syn-1A-WT- (left traces) and PIP2-insensitive Syn-1A-5RK/A-expressing INS-1 cells (right traces), treated with or without 1 μm PIP2 (in pipette solution). Note PIP2 partial reversal of Syn-1A inhibition (left traces) but not of Syn-1A-RK/A inhibition (right traces). B, representative KATP channel current traces from control (left), Syn-1A WT (middle), and Syn-1A-5RK/A (right)-overexpressing INS-1 cells treated without or with 10 μm PIP2 (in pipette solution). C, summary of A, n = 6–12 cells. D, summary of B showing no difference in current densities between control (n = 8), Syn-1A WT-expressing (n = 9), and Syn-1A-5RK/A-expressing (n = 11) cells. Results are mean ± S.E. (error bars); *, p < 0.05; NS, not significant.
The above results suggest that under physiologically low PIP2 concentration (∼1 μm), PIP2 modulation of Syn-1A·SUR1 complex was sufficient to modulate KATP activity, which seemed more dominant over the direct actions of PIP2 on Kir6.2 to open channels. In this experiment, the exogenous PIP2 was acting directly on the cytoplasmic PIP2-binding domain of Syn-1A and not likely to have significantly affected Syn-1A cluster formation in PM. Importantly, a 1 μm PIP2 concentration had no detectable effect on Syn-1A·SUR1 complex assembly, at least in vitro, which may in part be due to differences in the sensitivity of the assay (Fig. 1A). When we raised PIP2 concentration to 10 μm (which disrupted in vitro Syn-1A·SUR1 assembly in Fig. 1A), we found no differences in KATP channel activities between control, Syn-1A-WT, and Syn-1A-5RK/A (Fig. 6B; analysis in Fig. 6D). These results indicate that at higher PIP2 concentration, direct effects of PIP2 on the Kir6.2 subunit predominate over the effects of PIP2 on Syn-1A-5RK/A(and Syn-1A-WT) and SUR1 interaction to open KATP channels, although this higher PIP2 dosage remained unable to disrupt the abundant Syn-1A-5RK/A·SUR1 complexes (Figs. 1A and 5, C–E). These results modified our original thinking to suggest several modes by which PIP2 activates KATP channels in insulin-secreting β-cells: one at physiologic low PIP2 concentration acting on Syn-1A at its PIP2-binding site that finely modulates Syn-1A·SUR1 interactions and one at higher PIP2 concentrations, which act on KATP channels by two mechanisms, first by directly binding Kir6.2 and second by sequestering Syn-1A molecules into Syn-1A clusters, which reduces the availability of free Syn-1A molecules to bind SUR1 and could disrupt Syn-1A·SUR1 complexes.
Specificity of Cellular Inositol Phospholipids in Modulating Syn-1A·SUR1 Complex Disassembly and KATP Channel Activity
We next assessed whether other abundant cellular phospholipids might similarly affect Syn-1A·SUR1 complexes (Fig. 7) to modify KATP channel activity (Fig. 8) and whether this is mainly attributable to the negative charge of phospholipids purported to bind positively charged juxtamembrane polybasic residues of Syn-1A (14, 35, 36). FRET imaging assessment showed that 10 μm phosphatidylcholine (0 net charge) and phosphatidyl-l-serine (less negative charge than PIP2) did not affect Syn-1A·SUR1 complex formation (Fig. 7, A, B, and D) or HEK293 KATP channel activities (Fig. 8, A, B, C, and E). Inositol trisphosphate (IP3), which has a larger negative charge compared with PIP2 (38), caused only a minor disruption (24%) in Syn-1A·SUR1 complexes (Fig. 7, C and D; without IP3, 33.05 ± 2.9; with IP3, 24.91 ± 3.9) but did not significantly affect KATP channel activity (Fig. 8, D and E). These results indicate that the PIP2 effects on Syn-1A·SUR1 interactions that modulate KATP channel activity are specific.
FIGURE 8.
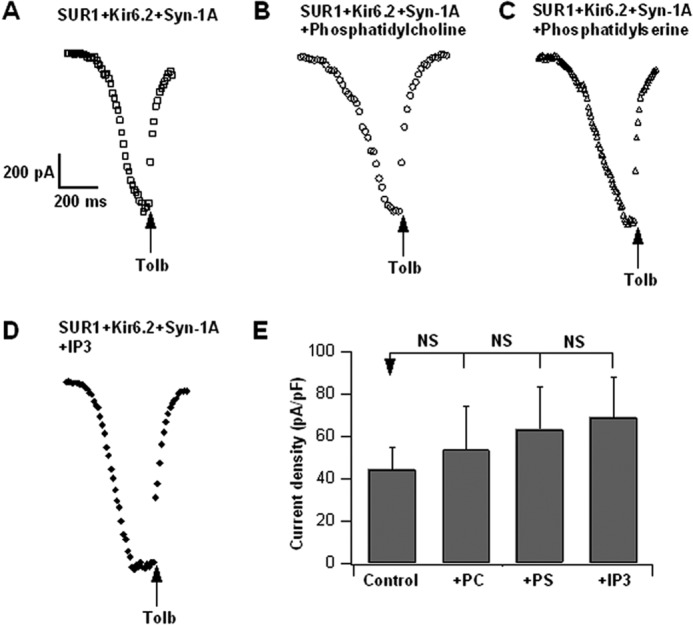
WT Syn-1A inhibition of KATP channels is resistant to other phospholipids. Representative KATP channel current tracings of SUR1 + Kir6.2 + Syn-1A-WT-expressing HEK293 cells, control (A) or treated with 10 μm phosphatidylcholine (B), phosphatidyl-l-serine (C), or inositol 1,4,5-trisphosphate (IP3) (D) in the pipette solution. E, summary showing no difference in current densities between control cells (n = 7) and each of the phospholipid-treated cells (phosphatidylcholine, n = 6; phosphatidyl-l-serine, n = 6; IP3, n = 6). Results are means ± S.E. (error bars); NS, not significant.
Effects of PIP2 Depletion from PM on Syn-1A·SUR1 Complex Formation and KATP Channels
Our experiments above so far have used exogenous PIP2 to alter Syn-1A·SUR1 interactions. Synaptojanin-1 is a polyphosphoinositide 5-phosphatase, which, when overexpressed using the construct HA-IPP1-CAAX, was reported to deplete endogenous PIP2 from the PM, causing disruption of the Syn-1A clusters on the PM (30, 31). Consistently, expressing this synaptojanin-1 construct to deplete endogenous PIP2 (in Fig. 9A), we saw a reduction of the larger hotspots (suggesting clusters, indicated by arrowheads in the top images) of Syn-1A-mCherry fluorescence (Syn-1A-mCherry expressed in HEK cells) to small fluorescence spots (indicated by arrowheads in the bottom images), indicating a dispersion of Syn-1A molecules from Syn-1A clusters; this is similar to the previous report using this construct (31). Further intensity profile analysis of cross-sections of the indicated regions of these images shows that in the absence of synatojanin-1 (Fig. 9B, pink line), there was sustained high intensity Syn-1A-mCherry fluorescence suggesting Syn-1A clusters, whereas in the cell treated with synaptojanin-1, Syn-1A-mCherry fluorescence appeared as narrow spikes, indicating either dispersed Syn-1A molecules or much smaller clusters of Syn-1A molecules (Fig. 9C, blue line). These results are consistent with Fig. 5A (top images), where the addition of exogenous PIP2 appeared to increase Syn-1A-mCherry clustering on PM. Synaptojanin-1-induced depletion of endogenous PIP2 resulted in increased FRET signals (59.3 ± 6.2%; Fig. 9D) compared with the absence of synaptojanin-1 (35.6 ± 7.1%; note more green to red in +synpatojanin-1 versus blue to green in −synaptojanin-1 in Fig. 9A), indicating increased Syn-1A·SUR1 complex formation in the PM. Of note, in −synaptojanin-1 cells, the FRET signals (indicated by arrows) were mostly located away from the Syn-1A-mCherry clusters (indicated by arrowheads; Fig. 9A), as was similarly observed in Fig. 5A. In contrast, in +synaptojanin-1 cells, the FRET signals were mostly in small Syn-1A-mCherry hotspots (arrows and arrowheads point to the same hotspots). These results led us to further strengthen our thinking that PIP2 depletion releases Syn-1A molecules from the large Syn-1A clusters to migrate away from the cluster to other PM sites where SUR1 molecules are located to then form Syn-1A·SUR1 complexes.
We then examined the functional implications of the endogenous PIP2 depletion that we showed to increase Syn-1A·SUR1 complex formation. In Fig. 10, A and B, INS-1 cells transfected with synaptojanin-1 caused a 63% reduction of KATP current, from 148.35 ± 23.2 pA/pF (control, n = 7) to 55.38 ± 11.2 pA/pF (synaptojanin-1, n = 9; p < 0.01). The application of exogenous GST-Syn-1A (1 μm) to the synaptojanin-1-transfected cells showed a KATP current of 51.54 ± 9.3 pA/pF (n = 7; p < 0.05), which is a 65% reduction compared with control. This is very similar to the effects of synaptojanin-1 treatment alone, indicating that exogenously added GST-Syn-1A could not further reduce the KATP current that was already inhibited by the PIP2 depletion caused by synaptojanin-1 treatment. Taken together, these results suggest that the enhanced “endogenous” Syn-1A·SUR1 complex formation caused by PIP2 depletion must have had all of the SUR1 sites occupied by endogenous Syn-1A to have resulted in optimal inhibition of KATP channels, leaving no available SUR1 sites for the exogenous GST-Syn-1A to bind and further inhibit KATP channels.
FIGURE 10.
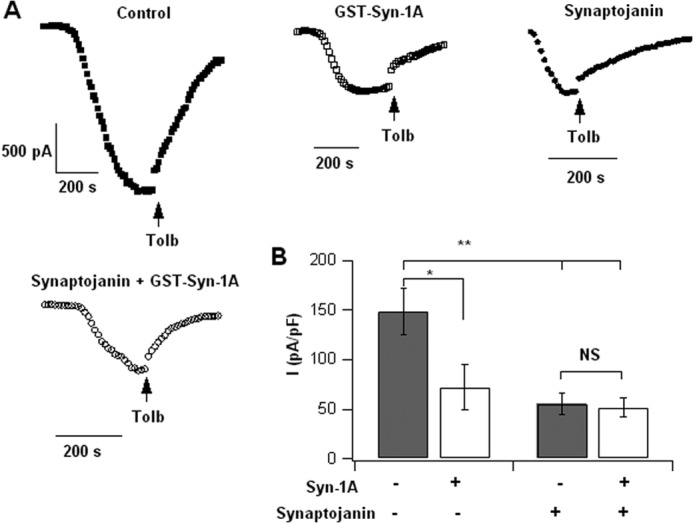
PIP2 depletion from PM disables exogenous Syn-1A from further inhibiting KATP channels. A, representative KATP channel current tracings of control, GST-Syn-1A (1 μm infused into cells via patch pipette), synaptojanin-1, and synaptojanin + GST-Syn-1A in INS-1 cells. B, summary results showing that exogenous GST-Syn-1A could not cause further inhibition of KATP channels when endogenous PIP2 levels were depleted by synaptojain-1. Results are mean ± S.E.; *, p < 0.05; **, p < 0.01. NS, not significant.
DISCUSSION
In this work, we showed that the actions of PIP2 on activating pancreatic islet β-cell KATP channel are contributed by alteration of Syn-1A interactions with SUR1, in addition to the known actions of PIP2 on Kir6.2 (14–18, 35, 36). Specifically, we showed that in vitro binding of recombinant GST-Syn-1A (containing only the cytoplasmic domain) and SUR1 was dose-dependently disrupted by increasing PIP2 concentrations (Fig. 1A). Although these results suggest that exogenous GST-Syn-1A and PIP2 could sequester each other from acting on KATP channels, our FRET study showed that PIP2 could also disrupt in vivo FRET interactions of SUR1 (-EGFP) and full-length Syn-1A (-mCherry) (Fig. 5). PIP2 effects on Syn-1A·SUR1 interactions were relatively specific at physiologic concentrations, with similar charged PI(3,5)P2 having reduced effects and more (PIP3) or less negatively charged phospholipids having little to no effect on Syn-1A·SUR1 complex assembly or KATP channel activity (Figs. 1 (B and C), 7, and 8). The functional implication of GST-Syn-1A·SUR1 sequestration was demonstrated by electrophysiological studies on rat islet β-cells, INS-1E cells, and SUR1/Kir6.2-expressing HEK293 cells, which uniformly showed that efficacy of PIP2 activation of KATP channels could be reduced by the addition of GST-Syn-1A (Figs. 2–4). All of these effects of PIP2 on Syn-1A·SUR1 complex formation and consequent KATP channel activity could be abrogated by the PIP2-insensitive Syn-1A mutant, Syn-1A-5RK/A. Importantly, we demonstrated multiple modes by which PIP2 activates β-cell KATP channel, whereby modulation of Syn-1A·SUR1 complex formation by physiologic low PIP2 concentration sufficient to alter KATP channel activity seemed to be more sensitive than the direct actions of PIP2 (at higher concentration) on Kir6.2 (Fig. 6). These results suggest three mechanisms for the actions of the exogenous PIP2 in opening KATP channels. First, PIP2 binds and sequesters exogenous GST-Syn-1A from binding SUR1. Second, some PIP2 is incorporated into the PM to disrupt Syn-1A·SUR1 complexes in the PM. Third, PIP2 acts on Kir6.2. The release of PM-bound Syn-1A molecules from PIP2-induced disruption of Syn-1A·SUR1 complexes seemed to contribute to the availability of Syn-1A to participate in the increase in Syn-1A clustering on the PM (Fig. 5A). This was assessed more critically with experiments whereby we depleted endogenous PIP2 from the PM with synaptojanin-1, reported to reduce Syn-1A clustering on PM (31). Here, endogenous PIP2 depletion appeared to release Syn-1A molecules from the PM clusters (Fig. 9). The “freed” Syn-1A molecules could then migrate to, find, and bind SUR1 molecules to form tight Syn-1A·SUR1 complexes (Fig. 9), which effected optimal inhibition of KATP channels, leaving no available SUR1 molecules for additional exogenous GST-Syn-1A to bind and further inhibit KATP channels (Fig. 10).
In our in vitro binding studies employing GST-Syn-1A binding to expressed SUR1, the GST-Syn-1A (without the transmembrane domain) would not be expected to form physiologic Syn-1A clusters, but nonetheless the PIP2-binding site at the cytoplasmic aa 260–265 domain directly binds SUR1, and the resulting GST-Syn-1A·SUR1 complex could be disrupted by exogenously added physiologic PIP2 concentrations. These results raise the question of how PIP2 modulation of Syn-1A interactions with SUR1 could influence KATP channel opening kinetics. We recently reported that Syn-1A binds SUR1 domains at the WB motif of NBF-1 and WA and WB motifs of NBF-2 (33). This suggests that Syn-1A might be binding the NBF-1/-2 dimer rather intimately, perhaps as a scaffolding protein, and this configuration and as yet undefined sites within these binding interfaces of SUR1 with Syn-1A might be putative sites for PIP2 disruption. Although we do not know what the PIP2-sensitive sites are in SUR1, the PIP2-sensitive site in Syn-1A is known (29). We directly tested the latter by employing PIP2-insensitive mutations of the juxtamembrane basic residues in Syn-1A (Syn-1A-5RK/A) (29), and indeed, PIP2 could not disrupt Syn-1A-5RK/A·SUR1 complexes. This was demonstrated by in vitro and in vivo (FRET) binding studies. The fact that abrogating mutations of the PIP2-binding sites actually increased Syn-1A·SUR1 binding indicates that the Syn-1A can bind SUR1 in a PIP2-independent manner via other H3 domains (27). Consistently, Syn-1A-5RK/A inhibition of SUR1/Kir6.2 KATP channels was rendered more resistant to PIP2 activation, indicating that the actions of PIP2 on SUR1 via Syn-1A binding have an important contribution to channel opening kinetics. Moreover, we found that PIP2 at 1 μm, which did not disrupt Syn-1A·SNARE complexes could already modulate Syn-1A·SUR1 complex actions on β-cell KATP channel activity. This was lower than the PIP2 concentrations required to disrupt Syn-1A·SUR1 complexes, and PIP2 with this lower concentration could also directly act on Kir6.2 to induce channel activation. Interestingly, a recent study showed that the N-terminal TMD0 domain of SUR1 profoundly influenced Kir6.2 channel sensitivity to PIP2 (16), which, however, is a domain that does not bind Syn-1A5 but which nonetheless could still affect the more distant NBF domains' interactions with Syn-1A.
Hence, we conclude that the PIP2 effects on SUR1 proteins that influence KATP channel gating are both direct and indirect. The direct effects we showed in this work are PIP2 actions on Syn-1A binding to SUR1, probably at the NBF domains (26, 28). The indirect effects would be PIP2 actions on Syn-1A clusters on the PM, whereby a physiologic increase or reduction of PM PIP2 levels will determine how many Syn-1A molecules will be released from the Syn-1A clusters to bind adjacent SUR1 molecules on the PM.
KATP channels play a most important role in regulating insulin secretion from islet β-cells (4, 5). Thus, any factor that acts directly or indirectly on β-cell KATP channels could have consequential effects on insulin secretion, which we now show to include PIP2 actions on Syn-1A binding to SUR1. PM and cytosolic PIP2 levels are likely to be perturbed in diabetes, metabolic syndrome, and lipid disorders. Syn-1A levels are severely reduced in islets of type-2 diabetic patients (39). Because the electrostatic binding between PIP2 and Syn-1A might enable each to sequester the other (21, 22), the excess or deficiency of either one in these pathologic conditions could profoundly influence the availability of Syn-1A to bind SUR1 or the availability of PIP2 to bind Kir6.2. Thus, this combined perturbation of β-cellular lipids and Syn-1A levels would probably contribute to perturbation of KATP channels that in turn could partly account for the deficient biphasic insulin secretion in diabetes.
This work was supported by Canadian Institutes of Health Research Grant MOP 69083 (to H. Y. G.) and by an equipment grant to the 3D (Diet, Digestive Tract, and Disease) Centre from the Canadian Foundation for Innovation and Ontario Research Fund (Project 19442).
T. Liang, L. Xie, C. Chao, Y. Kang, X. Lin, T. Qin, H. Xie, Z.-P. Feng, and H. Y. Gaisano, unpublished data.
- KATP channel
- ATP-sensitive potassium channel
- PM
- plasma membrane
- PIP2 or PI(4,5)P2
- phosphatidylinositol 4,5-biphosphate
- IP3
- inositol 1,4,5-trisphosphate
- PI(3,5)2
- phosphatidylinositol 3,5-biphosphate
- PIP3
- inositol 1,4,5-trisphosphate
- SUR1
- sulfonylurea receptor 1
- Syn-1A
- syntaxin-1A
- TIRFM
- total internal reflection fluorescence microscopy
- EGFP
- enhanced green fluorescent protein
- pF
- picofarads
- aa
- amino acids
- NBF
- nucleotide-binding fold.
REFERENCES
- 1. Aittoniemi J., Fotinou C., Craig T. J., de Wet H., Proks P., Ashcroft F. M. (2009) Review. SUR1. A unique ATP-binding cassette protein that functions as an ion channel regulator. Philos. Trans. R. Soc. Lond. B Biol. Sci. 364, 257–267 [DOI] [PMC free article] [PubMed] [Google Scholar]
- 2. Aguilar-Bryan L., Bryan J. (1999) Molecular biology of adenosine triphosphate-sensitive potassium channels. Endocr. Rev. 20, 101–135 [DOI] [PubMed] [Google Scholar]
- 3. Nichols C. G., Shyng S. L., Nestorowicz A., Glaser B., Clement J. P., 4th, Gonzalez G., Aguilar-Bryan L., Permutt M. A., Bryan J. (1996) Adenosine diphosphate as an intracellular regulator of insulin secretion. Science 272, 1785–1787 [DOI] [PubMed] [Google Scholar]
- 4. Hou J. C., Min L., Pessin J. E. (2009) Insulin granule biogenesis, trafficking and exocytosis. Vitamins and hormones. Vitam. Horm. 80, 473–506 [DOI] [PMC free article] [PubMed] [Google Scholar]
- 5. Ashcroft F. M., Gribble F. M. (1999) Differential sensitivity of beta-cell and extrapancreatic K(ATP) channels to gliclazide. Diabetologia 42, 903–919 [DOI] [PubMed] [Google Scholar]
- 6. Rohács T., Lopes C. M., Jin T., Ramdya P. P., Molnár Z., Logothetis D. E. (2003) Specificity of activation by phosphoinositides determines lipid regulation of Kir channels. Proc. Natl. Acad. Sci. U.S.A. 100, 745–750 [DOI] [PMC free article] [PubMed] [Google Scholar]
- 7. Kwiatkowska K. (2010) One lipid, multiple functions. How various pools of PI(4,5)P(2) are created in the plasma membrane. Cell Mol. Life Sci. 67, 3927–3946 [DOI] [PMC free article] [PubMed] [Google Scholar]
- 8. Cremona O., De Camilli P. (2001) Phosphoinositides in membrane traffic at the synapse. J. Cell Sci. 114, 1041–1052 [DOI] [PubMed] [Google Scholar]
- 9. Hilgemann D. W., Feng S., Nasuhoglu C. (2001) The complex and intriguing lives of PIP2 with ion channels and transporters. Sci. STKE 2001, re19. [DOI] [PubMed] [Google Scholar]
- 10. Czech M. P. (2000) PIP2 and PIP3. Complex roles at the cell surface. Cell 100, 603–606 [DOI] [PubMed] [Google Scholar]
- 11. Martin T. F. (2001) PI(4,5)P(2) regulation of surface membrane traffic. Curr. Opin. Cell Biol. 13, 493–499 [DOI] [PubMed] [Google Scholar]
- 12. Haider S., Tarasov A. I., Craig T. J., Sansom M. S., Ashcroft F. M. (2007) Identification of the PIP2-binding site on Kir6.2 by molecular modelling and functional analysis. EMBO J. 26, 3749–3759 [DOI] [PMC free article] [PubMed] [Google Scholar]
- 13. Fan Z., Makielski J. C. (1997) Anionic phospholipids activate ATP-sensitive potassium channels. J. Biol. Chem. 272, 5388–5395 [DOI] [PubMed] [Google Scholar]
- 14. Baukrowitz T., Schulte U., Oliver D., Herlitze S., Krauter T., Tucker S. J., Ruppersberg J. P., Fakler B. (1998) PIP2 and PIP as determinants for ATP inhibition of KATP channels. Science 282, 1141–1144 [DOI] [PubMed] [Google Scholar]
- 15. Enkvetchakul D., Loussouarn G., Makhina E., Shyng S. L., Nichols C. G. (2000) The kinetic and physical basis of K(ATP) channel gating. Toward a unified molecular understanding. Biophys. J. 78, 2334–2348 [DOI] [PMC free article] [PubMed] [Google Scholar]
- 16. Pratt E. B., Tewson P., Bruederle C. E., Skach W. R., Shyng S. L. (2011) N-terminal transmembrane domain of SUR1 controls gating of Kir6.2 by modulating channel sensitivity to PIP2. J. Gen. Physiol. 137, 299–314 [DOI] [PMC free article] [PubMed] [Google Scholar]
- 17. Stansfeld P. J., Hopkinson R., Ashcroft F. M., Sansom M. S. (2009) PIP(2)-binding site in Kir channels. Definition by multiscale biomolecular simulations. Biochemistry 48, 10926–10933 [DOI] [PMC free article] [PubMed] [Google Scholar]
- 18. Lin C. W., Yan F., Shimamura S., Barg S., Shyng S. L. (2005) Membrane phosphoinositides control insulin secretion through their effects on ATP-sensitive K+ channel activity. Diabetes 54, 2852–2858 [DOI] [PMC free article] [PubMed] [Google Scholar]
- 19. Olsen H. L., Hoy M., Zhang W., Bertorello A. M., Bokvist K., Capito K., Efanov A. M., Meister B., Thams P., Yang S. N., Rorsman P., Berggren P. O., Gromada J. (2003) Phosphatidylinositol 4-kinase serves as a metabolic sensor and regulates priming of secretory granules in pancreatic beta cells. Proc. Natl. Acad. Sci. U.S.A. 100, 5187–5192 [DOI] [PMC free article] [PubMed] [Google Scholar]
- 20. Bai J., Tucker W. C., Chapman E. R. (2004) PIP2 increases the speed of response of synaptotagmin and steers its membrane-penetration activity toward the plasma membrane. Nat. Struct. Mol. Biol. 11, 36–44 [DOI] [PubMed] [Google Scholar]
- 21. Murray D. H., Tamm L. K. (2011) Molecular mechanism of cholesterol- and polyphosphoinositide-mediated syntaxin clustering. Biochemistry 50, 9014–9022 [DOI] [PMC free article] [PubMed] [Google Scholar]
- 22. Murray D. H., Tamm L. K. (2009) Clustering of syntaxin-1A in model membranes is modulated by phosphatidylinositol 4,5-bisphosphate and cholesterol. Biochemistry 48, 4617–4625 [DOI] [PMC free article] [PubMed] [Google Scholar]
- 23. Chung S. H., Song W. J., Kim K., Bednarski J. J., Chen J., Prestwich G. D., Holz R. W. (1998) The C2 domains of Rabphilin3A specifically bind phosphatidylinositol 4,5-bisphosphate containing vesicles in a Ca2+-dependent manner. In vitro characteristics and possible significance. J. Biol. Chem. 273, 10240–10248 [DOI] [PubMed] [Google Scholar]
- 24. Chen Y. A., Scheller R. H. (2001) SNARE-mediated membrane fusion. Nat. Rev. Mol. Cell Biol. 2, 98–106 [DOI] [PubMed] [Google Scholar]
- 25. Leung Y. M., Kwan E. P., Ng B., Kang Y., Gaisano H. Y. (2007) SNAREing voltage-gated K+ and ATP-sensitive K+ channels. Tuning beta-cell excitability with syntaxin-1A and other exocytotic proteins. Endocr. Rev. 28, 653–663 [DOI] [PubMed] [Google Scholar]
- 26. Kang Y. H., Leung Y.-M., Manning-Fox J., Xia F., Xie H., Sheu L., Tsushima R. G., Light P., Gaisano H. Y. (2004) Syntaxin-1A inhibits cardiac KATP channels by its actions on nucleotide binding folds 1 and 2 of sulfonylurea receptor 2A. J. Biol. Chem. 279, 47125–47131 [DOI] [PubMed] [Google Scholar]
- 27. Cui N., Kang Y., He Y., Leung Y. M., Xie H., Pasyk E. A., Gao X., Sheu L., Hansen J. B., Wahl P., Tsushima R. G., Gaisano H. Y. (2004) H3 domain of syntaxin 1A inhibits KATP channels by its actions on the sulfonylurea receptor 1 nucleotide-binding folds-1 and -2. J. Biol. Chem. 279, 53259–53265 [DOI] [PubMed] [Google Scholar]
- 28. Chang N., Liang T., Lin X., Kang Y., Xie H., Feng Z. P., Gaisano H. Y. (2011) Syntaxin-1A interacts with distinct domains within nucleotide-binding folds of sulfonylurea receptor 1 to inhibit β-cell ATP-sensitive potassium channels. J. Biol. Chem. 286, 23308–23318 [DOI] [PMC free article] [PubMed] [Google Scholar]
- 29. Lam A. D., Tryoen-Toth P., Tsai B., Vitale N., Stuenkel E. L. (2008) SNARE-catalyzed fusion events are regulated by Syntaxin1A-lipid interactions. Mol. Biol. Cell 19, 485–497 [DOI] [PMC free article] [PubMed] [Google Scholar]
- 30. Milosevic I., Sørensen J. B., Lang T., Krauss M., Nagy G., Haucke V., Jahn R., Neher E. (2005) Plasmalemmal phosphatidylinositol-4,5-bisphosphate level regulates the releasable vesicle poolsize in chromaffin cells. J. Neurosci. 25, 2557–2565 [DOI] [PMC free article] [PubMed] [Google Scholar]
- 31. van den Bogaart G., Meyenberg K., Risselada H. J., Amin H., Willig K. I., Hubrich B. E., Dier M., Hell S. W., Grubmüller H., Diederichsen U., Jahn R. (2011) Membrane protein sequestering by ionic protein-lipid interactions. Nature 479, 552–555 [DOI] [PMC free article] [PubMed] [Google Scholar]
- 32. Leung Y. M., Kang Y., Gao X., Xia F., Xie H., Sheu L., Tsuk S., Lotan I., Tsushima R. G., Gaisano H. Y. (2003) Syntaxin 1A binds to the cytoplasmic C terminus of Kv2.1 to regulate channel gating and trafficking. J. Biol. Chem. 278, 17532–17538 [DOI] [PubMed] [Google Scholar]
- 33. Chao C., Liang T., Kang Y., Lin X., Xie H., Feng Z. P., Gaisano H. Y. (2011) Syntaxin-1A inhibits KATP channels by interacting with specific conserved motifs within sulfonylurea receptor 2A. J. Mol. Cell Cardiol. 51, 790–802 [DOI] [PubMed] [Google Scholar]
- 34. Pasyk E. A., Kang Y., Huang X., Cui N., Sheu L., Gaisano H. Y. (2004) Syntaxin-1A binds the nucleotide-binding folds of sulphonylurea receptor 1 to regulate the KATP channel. J. Biol. Chem. 279, 4234–4240 [DOI] [PubMed] [Google Scholar]
- 35. Lin Y. W., Jia T., Weinsoft A. M., Shyng S. L. (2003) Stabilization of the activity of ATP-sensitive potassium channels by ion pairs formed between adjacent Kir6.2 subunits. J. Gen. Physiol. 122, 225–237 [DOI] [PMC free article] [PubMed] [Google Scholar]
- 36. Shyng S. L., Nichols C. G. (1998) Membrane phospholipid control of nucleotide sensitivity of KATP channels. Science 282, 1138–1141 [DOI] [PubMed] [Google Scholar]
- 37. James D. J., Khodthong C., Kowalchyk J. A., Martin T. F. (2008) Phosphatidylinositol 4,5-bisphosphate regulates SNARE-dependent membrane fusion. J. Cell Biol. 182, 355–366 [DOI] [PMC free article] [PubMed] [Google Scholar]
- 38. McLaughlin S., Wang J., Gambhir A., Murray D. (2002) PIP(2) and proteins. Interactions, organization, and information flow. Annu. Rev. Biophys. Biomol. Struct. 31, 151–175 [DOI] [PubMed] [Google Scholar]
- 39. Ostenson C. G., Gaisano H., Sheu L., Tibell A., Bartfai T. (2006) Impaired gene and protein expression of exocytotic soluble N-ethylmaleimide attachment protein receptor complex proteins in pancreatic islets of type 2 diabetic patients. Diabetes 55, 435–440 [DOI] [PubMed] [Google Scholar]


