

Background: InsP3R2 is overexpressed during cardiac remodeling. The transcriptional regulation of InsP3R2 is not known.
Results: InsP3R2 gene expression is regulated by calcineurin-NFATc signaling pathway.
Conclusion: Calcineurin-NFATc signaling is a downstream target of the InsP3R2 that regulates InsP3R2 expression in a positive feedback loop.
Significance: InsP3R2 Ca2+ channel-calcineurin-NFATc signaling network regulates ITPR2 gene and fetal gene expression during cardiac remodeling.
Keywords: Calcineurin; Calcium Signaling; Cardiac Hypertrophy; Gene Transcription; Inositol 1,4,5-Trisphosphate
Abstract
In heart, the type 2 inositol 1,4,5-triphosphate receptor (InsP3R2) is the predominant isoform expressed and is localized in the nuclear membrane of ventricular myocytes. InsP3R2-mediated Ca2+ release regulates hypertrophy specific gene expression by modulating CaMKIIδ, histone deacetylase, and calcineurin-NFATc signaling pathways. InsP3R2 protein is a hypertrophy specific marker and is overexpressed in heart failure animal models and in humans. However, the regulation of InsP3R2 mRNA and protein expression during cardiac hypertrophy and heart failure is not known. Here we show the transcriptional regulation of the Itpr2 gene in adult cardiomyocytes. Our data demonstrates that, InsP3R2 mRNA and protein expression is activated by hypertrophic agonists and attenuated by InsP3R inhibitors 2-aminoethoxyldiphenyl borate and xestospongin-C. The Itpr2 promoter is regulated by the calcineurin-NFATc signaling pathway. NFATc1 regulates Itpr2 gene expression by directly binding to the Itpr2 promoter. The calcineurin-NFATc mediated up-regulation of the Itpr2 promoter was attenuated by cyclosporine-A. InsP3R2 mRNA and protein expression was up-regulated in calcineurin-A transgenic mice and in human heart failure. Collectively, our data suggests that ITPR2 and hypertrophy specific gene expression is regulated, in part, by a positive feedback regulation between InsP3R2 and calcineurin-NFATc signaling pathways.
Introduction
Cardiac hypertrophy is an adaptive response of the heart in response to the physiological (e.g. pregnancy and exercise) and pathological (e.g. hypertension, myocardial infarction, cardiomyopathy etc.) stimuli imposed on it (1). During this process there is an integration of an array of signaling pathways including Ca2+ signaling that results in the activation of the transcriptional network (2–4). At the cellular level, this leads to an increase in cell size by the activation of protein synthesis and re-activation of the fetal gene program (5). The differential gene expression includes the Ca2+ handling protein genes that are modulated in response to the diverse hypertrophic stimuli for maintaining Ca2+ homeostasis (6).
Inositol 1,4,5-triphosphate receptors (InsP3Rs)3 are a family of Ca2+ channels modulated by InsP3 released in response to neurohumoral factor-mediated α/β-adrenergic receptor activation (7). Three types of InsP3 receptors (types 1, 2, and 3) are expressed in human cells and the expression of these receptors are cell-type specific (7, 8). The expression of these receptors are modulated by physiological and pathological stimuli during development and differentiation (7). In heart, the type 2 InsP3 receptor (InsP3R2) is the major isoform expressed and localized predominantly in the nuclear envelope (3, 9). The nuclear membrane-enriched InsP3R2 regulates Ca2+ release into the cytosol and nucleus (10) and regulates Ca2+ dependent events in both the nucleoplasm and cytoplasm (11–16). The InsP3R2-mediated nuclear Ca2+ transient regulate cardiomyocyte functions by activating Ca2+-dependent signaling cascades independently of the global Ca2+ changes during every heart beat by excitation-contraction coupling (11, 12, 17).
InsP3R2-mediated Ca2+ mobilization modulates the excitation-contraction coupling in myocytes and increased expression of InsP3R2 in atria has been shown to induce arrhythmias (11, 17–19). Additionally, InsP3R2-mediated Ca2+ release is instrumental in excitation-transcription coupling to activate hypertrophic gene expression by modulating CaMKIIδ, histone deacetylase, and calcineurin-NFATc signaling pathways (12, 13, 16).4 Recent studies have shown that there was an elevated expression of InsP3R2 in human and animal heart failure models (20, 21). Nevertheless, the molecular mechanism that regulates the expression of InsP3R2 in cardiac myocytes is not well understood. In this study we have delineated the mechanism of transcriptional regulation of InsP3R2 expression.
EXPERIMENTAL PROCEDURES
Heart Samples
LV tissue samples were obtained from four failing human hearts after explanations in patients undergoing cardiac transplantation for end-stage dilated cardiomyopathy (DCM) performed at the Loyola University Chicago Hospital. Four non-failing (control) human heart samples were also from Loyola University Chicago Hospital. The study was approved by the Human Studies Committee of Loyola University Chicago, Maywood, IL. Hearts from calcineurin-A overexpressing transgenic (CnA-TG) mice (22) and WT littermates were a kind gift from Dr. Jeffery D. Molkentin, Cincinnati Children's Hospital, Cincinnati, OH.
Cardiomyocytes and Cells
Adult rat ventricular myocytes (ARVMs) were isolated by standard methods and the procedures complied with guidelines established in the Guide for the Care and Use of Laboratory Animals (NIH Publication 65-23), core facility, Department of Cell and Molecular Physiology, Loyola University. ARVMs were cultured in 35- or 60-mm culture dishes using rat cardiomyocyte media (Cell Applications Inc.) and treated with endothelin-1 (ET-1, 100 nm), angiotensin II (AngII, 200 nm), phenylephrine (PE, 1 μm), CaMKII inhibitor KN-93 (5 μm), and InsP3R inhibitor 2-ABP (2 μm) and xestospongin-C (Xes-C, 3 μm) for different time points as indicated in the figures and figure legends. For immunofluorescence experiments the cells were cultured in 4-well chambered microscopic slides. For promoter assay (live cell imaging) the cells were cultured in glass bottom 4-well chamber slides. H9C2 (rat cardiomyotube cell line) was cultured in DMEM (Cellgro) with 10% FBS, 1% penicillin/streptomycin, and 2 mm glutamine in a humidified CO2 (5%) incubator at 37 °C.
Western Blotting and Immunofluorescence
Total protein extract was prepared from human heart samples as described previously (3) and cardiomyocytes by using Hunter's buffer. Protein concentration was quantified using microBCA assay (Thermo Fisher). Approximately 20–30 μg of total proteins were resolved on 4–15% gradient gels (Bio-Rad Laboratories) and transferred to nitrocellulose membrane by wet transfer. Membranes were probed with anti-InsP3R2 (T2NH and GMC2T; 1:1000 (3)) and GAPDH-HRP (1:50,000; Sigma) overnight at 4 °C. Membranes were then incubated with secondary antibodies (anti-mouse and anti-rabbit-HRP, 1:10,000; Santa Cruz) for 1 h at room temperature and the bands were visualized using chemiluminescence reagent (Millipore), the images were acquired using Chemidoc instrument (Bio-Rad). Quantification by densitometry was carried out using the Image Lab software (Bio-Rad).
Immunofluorescence was carried out essentially as described earlier (3) and the InsP3R2 proteins were stained with T2NH and GMC2T (1:500) antibodies. ANF was stained with anti-ANF (NPPA; NPPA Epitomics) antibody (1:500) and the cells were fixed with mounting media with DAPI (Vector Laboratories).
Real-Time qPCR
Total RNA from human samples, mouse hearts, and ARVMs were isolated using TRIzol reagent (Invitrogen) as per the manufacturer's instruction. The RNA was treated with RNase-free DNase (Ambion) and precipitated with ethanol. About 1 μg of total RNA was reverse transcribed using Moloney murine leukemia virus reverse transcriptase and random primers as per the manufacturer's instruction (Invitrogen). The samples were diluted and approximately 12.5 ng of cDNA were used for quantification using Fast Start SYBR Green master mix (Roche Diagnostics GmbH) in the CFX96 Real-time PCR detection system (Bio-Rad) in a 96-well format and the results analyzed using CFX manager software (Bio-Rad). The specificity of each primer set was analyzed by the melt curve and all the primers used gave a single peak. The primers used in this study are provided in Table 1.
TABLE 1.
List of primers used in this study
| Name | Direction | Sequence |
|---|---|---|
| Mouse RT-qPCR primers | ||
| Gapdh | Forward | 5′-CATGGCCTTCCGTGTTCCTA-3′ |
| Reverse | 5′-CCTGCTTCACCACCTTCTTGAT-3′ | |
| Itpr2 | Forward | 5′-CCTGACGGTGAACAAGAGGT-3′ |
| Reverse | 5′-GCATTCACATTATCACCCTCGC-3′ | |
| Acta1 | Forward | 5′-AGACCACCGCTCTTGTGTGTG-3′ |
| Reverse | 5′-CTGACCCATACCTACCATGACACC-3′ | |
| β-Mhc | Forward | 5′-ATGTGCCGGACCTTGGAAG-3′ |
| Reverse | 5′-CCTCGGGTTAGCTGAGAGATCA-3′ | |
| Nppa(Anf) | Forward | 5′-TCGTCTTGGCCTTTTGGCT-3′ |
| Reverse | 5′-TCCAGGTGGTCTAGCAGGTTCT-3′ | |
| Rat RT-qPCR primers | ||
| Gapdh | Forward | 5′-CATGGCCTTCCGTGTTCCTA-3′ |
| Reverse | 5′-CCTGCTTCACCACCTTCTTGAT-3′ | |
| Itpr2 | Forward | 5′-CTACAACGACCGAGCCTCAT-3′ |
| Reverse | 5′-CCACCCTCACTATGTCGTCC-3′ | |
| Nppa(Anf) | Forward | 5′-GAGCGGACTAGGCTGCAACAG-3′ |
| Reverse | 5′-GCTCCAGGAGGGTATTCACCA-3′ | |
| Human RT-qPCR primers | ||
| GAPDH | Forward | 5′-GACAGTCAGCCGCATCTTCT-3′ |
| Reverse | 5′-GCGCCCAATACGACCAAATC-3′ | |
| ITPR2 | Forward | 5′-GCAGGGAAGAAGAGGGACG-3′ |
| Reverse | 5′-ACCCCAAGGTGCTGATGAAG-3′ | |
| ITPR1 | Forward | 5′-CTGCCACCAGTTCAAAAGCC-3′ |
| Reverse | 5,-CCACCTCTGCTGCCAAGTAA-3′ | |
| ITPR3 | Forward | 5′-TATGCAGTTTCGGGACCACC-3′ |
| Reverse | 5′-TGCCCTTGTACTCGTCACAC-3′ | |
| NPPA(ANF) | Forward | 5′-AGCAGTGGATTGCTCCTTGA-3′ |
| Reverse | 5′-GACACGGCATTGTACATGGG-3′ | |
Construction of Rat Itpr2 Gene Promoter
To construct the rat InsP3R2 promoter, genomic DNA was isolated from frozen rat heart (Pel-Freeze Biologicals) by standard procedures. The mouse promoter sequence (23) was aligned with the rat genome and the conserved region was amplified using AccuPrime Pfx DNA polymerase (Invitrogen) with the following primer pairs: forward, 5′-AGGATCCTAGGTATCGTGTCCCAATTTTCCTCT-3′, reverse, 5′-AAGCTGGTACCGCTTCACGCTCGTGAGGC-3′. The primers were designed with 5′ SnaBI and 3′ KpnI sites. Initially, the RFP cassette from pTagRFP-C (Evrogen) was digested with SalI and NotI and inserted in pShuttle vector after digesting with the same enzymes and this was used to construct the Ad-RFP control virus. The amplified rat InsP3R2 promoter sequence (SnaBI/KpnI fragment) was inserted in pShuttle-RFP vector after excising the CMV promoter with the same enzymes. The recombinant plasmids were verified by PCR and DNA sequencing and transcription factor binding sites were identified using Genomatix Software. The deletion constructs were also made with similar strategy. To construct the adenoviruses expressing the promoter constructs, the FL and del-1 promoter cassette in pShuttle vector were used and the adenovirus was prepared using AdEasy adenoviral vector systems as described in the manufacturer's instructions (Agilent Technologies).
Promoter Assay in H9C2 Cells and ARVMs
For the promoter assay in H9C2 cells, the cells were seeded in 12-well plates, the next day the promoter constructs (∼1 μg) were transfected using Lipofectamine 2000 (Invitrogen) reagent as per the manufacturer's instruction. After 16 h post-transfection, the cells were made quiescent by growing in serum-free media for an additional 48 h. For normalizing the transfection, the promoter constructs were co-transfected with GFP plasmid (10:1 ratio). Then the cells were treated with serum (10%), ET-1 (100 nm), AngII (200 nm), and PE (1 μm) and harvested at different time points, lysed in lysis buffer (Promega), and cleared by centrifugation. The lysate (50 μl) was used to measure the fluorescence intensity using a plate reader in a 96-well format (BioTek). The red fluorescence was normalized with the green fluorescence and the promoter activity was plotted. To assay the promoter activity in ARVMs the cells were seeded in cover glass bottom chamber dishes and the cells were infected with 50–100 multiplicity of infection of adenoviruses. After 24 h post-infection the cells were treated with ET-1 (100 nm) and CsA (10 μm) for 6–12 h and live cell imaging was carried out using confocal microscopy (Leica SP5 confocal microscope equipped with a 1.3 N.A. ×63 water immersion objective). Fluorescence intensity from 50 to 60 cells was measured and plotted.
Luciferase Assay
Cultured ARVMs were infected with adenovirus expressing the NFATc-Luc-GFP construct. The cells were treated with ET-1 or with or without 2-APB and xestospongin-C for 12 h. The cells were lysed with passive lysis buffer (Promega) and luciferase activity was measured using the luciferase assay system (Promega). The luciferase activity was normalized with GFP fluorescence.
Electrophoretic Mobility Shift Assay (EMSA)
EMSA was carried out essentially as described (24). H9C2 cells were infected with adenoviruses expressing GFP-NFATc1 and NFATc3 (25) for 24 h and the cells were stimulated with ET-1 to induce nuclear translocation of NFATc proteins. Nuclear extracts prepared from these cells were incubated with the annealed end labeled oligonucleotides corresponding to the NFATc binding site of the Itpr2 promoter. The binding reaction was carried out with 2 μg of nuclear extract and resolved on a 5% native polyacrylamide gel in 0.5× TBE buffer (Tris borate-EDTA), dried, and autoradiographed. The oligonucleotides used for EMSA were NFATc-WT forward, 5′-TCGTGTCGGCAATTTTCCTCCAAACC-3′; reverse, 5′-GGTTTGGAGGAAAATTGCCGACACGA-3′; and NFATc-Mut forward, 5′-TCGTGTCGGCAATTTTttcCCAAACC-3′, reverse, 5′-GGTTTGGgaaAAAATTGCCGACACGA-3′. The core NFATc binding sequences are underlined and the mutated nucleotides are shown in lowercase letters.
Statistical Analysis
All data are represented as average ± S.E. Statistical tests were either Student's paired or unpaired t tests and p < 0.05 was considered as statistically significant.
RESULTS
InsP3R2 Is Overexpressed in Human Heart Failure
The type 2 InsP3R is the isoform predominantly expressed in cardiomyocytes and is localized in the nuclear membrane (3, 9). Recent studies have shown increased expression of this protein in spontaneously hypertensive rat animal models and ischemic dilated cardiomyopathy patient samples in the perinuclear region (20, 21). To gain insights on the increased expression of InsP3R2 we have used human DCM samples with different etiologies4 and studied expression of the ITPR2 gene. Western blot analysis revealed that there was an increase in expression of the InsP3R2 protein in human DCM heart failure samples compared with control non-failing hearts (Fig. 1A). Quantification data shows a severalfold increase of InsP3R2 protein (2.7 ± 0.59; p < 0.05, n = 4) in DCM samples compared with non-failing control hearts (Fig. 1B) and is consistent with previous studies (20, 21).
FIGURE 1.
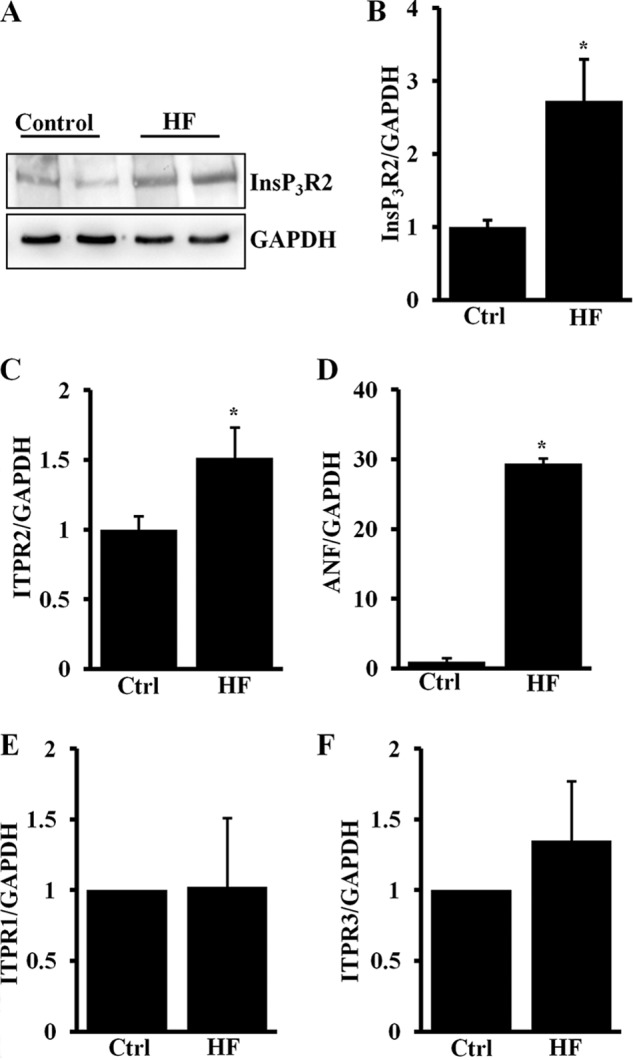
In human heart failure InsP3R2 protein and mRNA expression is up-regulated. A, Western blot analysis of InsP3R2 and GAPDH protein expression in human heart failure and non-failing control heart ventricular extracts. B, quantification result showing up-regulated InsP3R2 protein in heart failure compared with control hearts. C, RT-qPCR result showing increased ITPR2 mRNA expression in human heart failure compared with control hearts. D, RT-qPCR showing increased ANF mRNA expression in human heart failure compared with control hearts. E, RT-qPCR result showing increased ITPR1 mRNA expression in human heart failure compared with control hearts. F, RT-qPCR result showing increased ITPR3 mRNA expression in human heart failure compared with control hearts. The data were represented with mean ± S.E. (n = 4). *, p < 0.05 control (Ctl) versus HF.
ITPR2 (InsP3R2) mRNA expression was also quantified by real-time qPCR and the results show that there was a significant increase in ITPR2 gene expression (1.5 ± 0.2, p < 0.05) in DCM samples compared with the control (Fig. 1C). Expression of the ANF transcript, the well documented hypertrophic gene marker, was also increased (∼30 ± 0.46; p < 0.01) in DCM samples compared with the controls (Fig. 1D). We then analyzed the mRNA expression levels of ITPR1 and ITPR3 (type 1 and type 3 InsP3R genes, respectively) in these samples. Of the four HF samples, one sample (#2) showed a 1.8-fold increase in ITPR1 mRNA and another sample (#3) showed a 2.5-fold increase in ITPR3 mRNA expression compared with the controls. However, there was no significant difference in either ITPR1 or ITPR3 mRNA expression between normal and HF samples (Fig. 1, E and F).
Our data suggests that increased expression of ITPR2 but not ITPR1 or ITPR3 is common in heart failure with different etiologies and is regulated at the transcriptional level. The heterogeneity observed in expression levels for ITPR1 and ITPR3 may be a function of different etiologies between patients with DCM and the functional significance is unknown.
GPCR Activation Regulates InsP3R Expression
The molecular mechanism(s) that activates the expression of InsP3R2 in the heart during the development of hypertrophy and heart failure has not been addressed. To examine this, we carried out in vitro studies using ARVMs that were stimulated with hypertrophy inducing agonists and expression of the InsP3R2 protein was evaluated. GPCR agonists have been linked to activation of hypertrophy specific fetal genes during cardiac remodeling and heart failure (15, 18, 19, 26). To test whether InsP3R2 protein expression is activated by ET-1, AngII, and PE, ARVMs were stimulated with ET-1 (100 nm), AngII (200 nm), and PE (1 μm) for 16–18 h and analyzed for InsP3R2 protein expression. Immunoblot analysis followed by quantification showed a significant increase in InsP3R2 protein levels with ET-1 (3.2 ± 0.08; p < 0.05), AngII (2.5 ± 0.15; p < 0.05), and PE (3.7 ± 0.19; p < 0.05) stimulation for 16 h compared with untreated control cells (Fig. 2A).
FIGURE 2.

Hypertrophic agonists up-regulate InsP3R2 protein and mRNA in ARVMs. A, Western blot analysis of InsP3R2, α-actinin, and GAPDH expression in cultured ARVMs treated with ET-1 (100 nm), AngII (200 nm), and PE (1 μm) for 16 h. The quantification result shows increased InsP3R2 protein expression in agonist-stimulated cells compared with un-stimulated control cells. B, RT-qPCR result showing increased Itpr2 mRNA expression in ET-1 (100 nm)-stimulated cells compared with un-stimulated control cells. C, RT-qPCR showing expression of Anf mRNA in ET-1 (100 nm)-stimulated cells. D, immunofluorescence showing InsP3R2 protein expression in control and ET-1 (100 nm)-stimulated cells at 12 h. A similar pattern of InsP3R2 expression and distribution was observed from three independent experiments. Bar = 10 μm. E, quantification of InsP3R2 positive cells in ET-1 (100 nm)-stimulated cells. F, quantification of ANF positive cells in ET-1 (100 nm)-stimulated cells. The data were presented with mean ± S.E. (*, p < 0.05 compared with control; #, p < 0.05 compared with 6 and 12 h) from three independent experiments.
Next, we analyzed the mRNA expression for Itpr2 and Anf in ET-1-stimulated ARVMs. Total RNA isolated from ET-1-stimulated cells was reverse transcribed and real-time PCR was used to quantify the expression of Anf and Itpr2. Consistent with InsP3R2 protein expression, ET-1 activated expression of the Itpr2 gene transcript ∼3-fold at 6 and 12 h and declined to 1.6-fold at 24 h (Fig. 2B). ET-1 stimulation activated Anf transcript expression ∼7-fold at 6 h and these were sustained to 24 h (Fig. 2C). A similar increase in Itpr2 mRNA expression was observed in AngII- and PE-treated cells (data not shown). Immunofluorescence using a InsP3R2 specific antibody (T2NH) (3) followed by confocal microscopy showed that ET-1 increased InsP3R2 immunoreactivity significantly at 6 h compared with untreated cells (data not shown). The InsP3R2 positive cells were scored from ∼200 cells from three different experiments and the results show that ∼70% (67.8 ± 1.4; p < 0.01) of the cells were positive for InsP3R2 at 6 h and there was an incremental increase in staining at 12 and 24 h (71.8 ± 2.12; p < 0.01 and 74.3 ± 1.93; p < 0.01), respectively (Fig. 2D). Similarly, ANF positive cells were also increased in a time-dependent manner (Fig. 2F).
These results demonstrate that GPCR activation by ET-1, AngII, and PE activates expression of the Itpr2 gene transcript and InsP3R2 protein expression in parallel to Anf transcript and protein. The difference in the mRNA expression pattern of these two genes may be due to their regulation by differential transcriptional programs. Whereas the mRNA expression of the Itpr2 gene was down-regulated at 24 h, the protein level remained elevated suggesting that apart from transcriptional regulation, the post-transcriptional mechanism(s) also stabilizes the InsP3R2 protein. Overall, these results reveal that GPCR activation up-regulates the InsP3R2 mRNA and protein by transcriptional and post-transcriptional mechanisms suggesting that InsP3R2 is a hypertrophy specific gene marker as described earlier (20, 21).
InsP3R2-mediated Nuclear Ca2+ Release Activates Itpr2 Gene Expression
Several studies have shown that neurohumoral factors induced elevated Ca2+ through InsP3R2 followed by activation of hypertrophic gene expression (11, 14, 15, 18, 19, 27). To test whether InsP3R2-mediated Ca2+ release activates InsP3R2 expression, we used the InsP3R channel inhibitor 2-APB (13). Cells were treated with ET-1 or PE ± 2-APB (2 μm) and the InsP3R2 mRNA, and the protein was analyzed together using ANF as control. Immunoblotting using a InsP3R2-specific antibody showed that compared with control cells, ET-1 stimulation (16 h) elevated the InsP3R2 protein levels (3.3 ± 0.14; p < 0.05) and was inhibited by 2-APB (1.5 ± 0.1; p < 0.05) (Fig. 3A). Similarly, PE treatment activated InsP3R2 protein expression (4.4 ± 0.3; p < 0.05) and PE + 2-APB inhibited the expression of InsP3R2 (1.7 ± 0.07; p < 0.05) (Fig. 3B).
FIGURE 3.
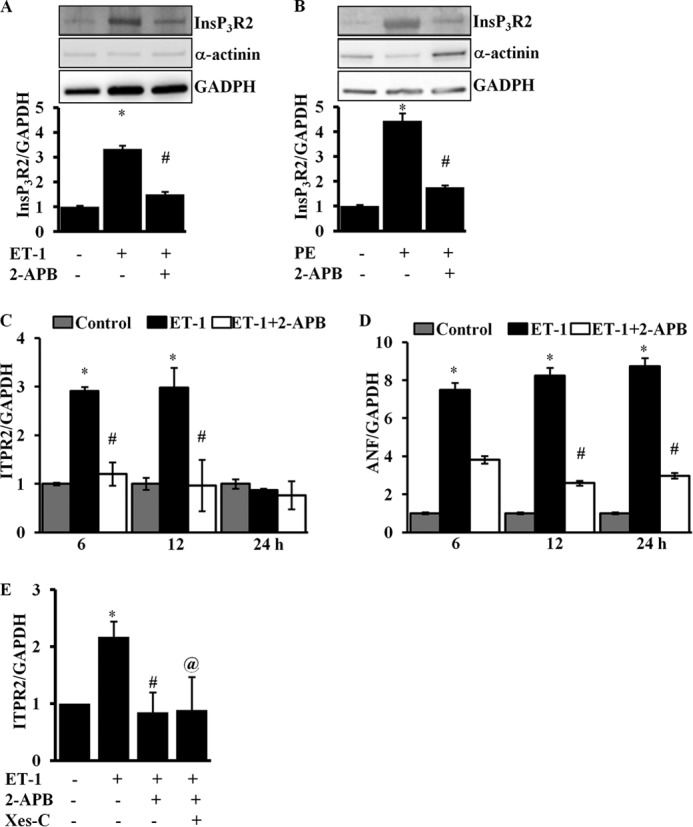
InsP3R2 inhibitor attenuates InsP3R2 protein and mRNA expression. A, Western blot analysis of InsP3R2, α-actinin and GAPDH protein expression in ARVMs stimulated with either ET-1 (100 nm) or ET-1 (100 nm) and 2-APB (2 μm). Quantification result showing up-regulation of InsP3R2 protein in ET-1-stimulated cells compared with control and significantly attenuated by 2-APB. B, Western blot analysis of InsP3R2, α-actinin, and GAPDH protein expression in ARVMs stimulated with either PE (1 μm) or PE (1 μm) and 2-APB (2 μm). Quantification result showing up-regulation of InsP3R2 protein in PE-stimulated cells compared with control and significantly attenuated by 2-APB. C, RT-qPCR analysis showing increased expression of Itpr2 mRNA in ET-1 (100 nm)-stimulated cells compared with control and the expression was attenuated by 2-APB (2 μm) treatment. D, RT-qPCR analysis showing increased expression of Anf mRNA in ET-1 (100 nm)-stimulated cells compared with control and the expression was attenuated by 2-APB (2 μm) treatment. E, RT-qPCR analysis showing increased expression of Itpr2 mRNA in ET-1 (100 nm)-stimulated cells compared with control and expression was attenuated by 2-APB (2 μm) and Xes-C (3 μm). The data were presented with mean ± S.E. (*, p < 0.05, compared with control; #, p < 0.05 compared with ET-1 stimulated @, p < 0.05 compared with ET-1-stimulated) from three independent experiments.
Quantification of mRNA expression in ET-1-stimulated cells, showed an approximate 3-fold increase in Itpr2 gene transcripts compared with control cells at 6 and 12 h and this was inhibited by 2-APB. As previously described the expression declined at 24 h to basal levels (Fig. 3C). Anf expression was attenuated ∼50% in 2-ABP-treated cells and these levels remained nearly constant over the time course (Fig. 3D). To ensure the specificity of 2-APB, we treated ARVMs with the InsP3R2 inhibitor xestospongin-C for 6 h, stimulated with ET-1, and the InsP3R2 transcripts were quantified. The results presented in Fig. 3E show that similar to 2-APB, Xes-C treatment attenuated Itpr2 mRNA expression compared with ET-1-stimulated cells.
Immunofluorescence experiments showed that about ∼70% (66 ± 10.9; p < 0.01) of the cells were positive for InsP3R2 in ET-1-stimulated cells (18 h) compared with the untreated cells. Treatment with 2-APB reduced the number of InsP3R2 positive cells ∼2-fold (31 ± 5.7; p < 0.01). Similarly, there was a significant increase in ANF positive cells (59 ± 8.6; p < 0.02) in ET-1-stimulated cells compared with control cells and this was significantly inhibited by 2-APB (32 ± 6.4; p < 0.05) (data not shown). These results reveal that InsP3R2-mediated Ca2+ mobilization regulates the expression of InsP3R2 and other hypertrophy specific genes and suggests that InsP3R2-mediated nuclear Ca2+ transients (4, 11, 18, 27) regulate gene expression by eliciting hypertrophy specific transcriptional programs.
Endothelin-1 Activates IPTR2 Promoter
The increased expression of InsP3R2 in ARVMs treated with hypertrophic agonists prompted us to look at regulation of the Itpr2 promoter. The mouse Itpr2 proximal promoter region has been cloned and reported (23). To study regulation of the Itpr2 gene promoter we constructed the conserved proximal promoter sequence of ITPR2 from the rat heart upstream of the red fluorescent protein (RFP) as a reporter. Additionally, we made a series of 5′ deletion constructs (Fig. 4, A and B). Transcription factor binding sites were predicted using Genomatix software and compared with the previously reported mouse sequence. The rat Itpr2 promoter showed putative binding sites for several known cardiac-specific transcription factors MyoD, CEBP, E-box, and CARE including NFATc (NFκB/c-Rel).
FIGURE 4.

Itpr2 gene promoter is regulated by NFATc in H9C2 cells. A, diagram depicting the promoter region of the rat Itpr2 gene and transcription factor binding sites. The promoter constructs were cloned upstream of red fluorescence protein as the reporter construct. B, ET-1 activated the Itpr2 gene promoter (increase in red fluorescence) in quiescent H9C2 (serum starved for 48 h) cells transfected with promoter constructs and co-transfected with GFP plasmid (to normalize the expression). Deletion of the NFATc binding site (del-1) attenuated ET-1-mediated stimulation of the Itpr2 gene promoter and further deletion showed no activation like the del-1 construct. The data were presented with mean ± S.E. (*, p < 0.05 compared with FL promoter) from three different experiments. GFP, green fluorescent protein; AU, arbitrary units.
Because calcineurin-NFATc signaling is downstream of InsP3R2 Ca2+ signaling and regulates hypertrophy specific gene expression (12, 13, 22), we examined regulation of the Itpr2 promoter by this signaling pathway. Initially we studied regulation of the Itpr2 promoter in H9C2 cells (immortalized rat cardiomyotubes). The promoter constructs were transfected together with GFP in H9C2 cells and serum starved for 48 h. The cells were then stimulated with ET-1 (100 nm, 12 h) and the results showed that ET-1 activated the ITPR2 promoter in quiescent (serum-starved) H9C2 cells. Deletion of the NFATc site completely abolished InsP3R2 promoter activity and further deletion did not show any additional activity (Fig. 4B). Similarly, addition of serum and other hypertrophic agonists, AngII and PE, also activated the Itpr2 promoter in quiescent H9C2 cells (data not shown) suggesting that in the immortalized rat cardiomyotube cell line, GPCR activation could increase expression of the Itpr2 gene.
Calcineurin-NFATc Regulates Itpr2 Promoter
In adult cardiomyocytes, the activation of hypertrophic gene expression is modulated by specific and distinct pathways elicited by different agonists. To gain insights on regulation of the InsP3R2 promoter in adult cardiomyocytes, we constructed adenoviruses expressing Itpr2-RFP reporter constructs with (Ad-Itpr2-RFP-FL) and without the NFATc site (Ad-Itpr2-RFP-del-1) (Fig. 5A).
FIGURE 5.

Itpr2 gene promoter is regulated by NFATc in ARVMs. A, diagram depicting the promoter constructs with and without the NFATc binding site expressed using adenoviruses. B, ARVMs were infected with adenoviruses expressing the full-length Itpr2 gene promoter construct for 24 h. The cells were stimulated with ET-1 for 12 h and the fluorescence intensity was measured in live cells. C, ARVMs were infected with adenovirus expressing the deletion construct (del-1, lacks the NFATc binding site) and processed as described above. D, quantification result showing activation of full-length Itpr2 promoter and not the NFATc deletion construct in ET-1-stimulated ARVMs. Similar results were obtained from three independent experiments. The quantification data are presented with mean ± S.E. (*, p < 0.05) from 40 to 60 cells from three independent experiments.
ARVMs were infected with both of the reporter constructs and then induced with ET-1 for 12 h. Live cell imaging was carried out to measure Itpr2 promoter activity as judged by RFP fluorescence. ET-1 induced Itpr2 promoter activity in cells infected with the full-length promoter (Ad-Itpr2-RFP-FL) compared with un-stimulated control cells (Fig. 5B). In contrast, del-1 (Ad-Itpr2-RFP-del-1)-infected cells showed no increase in RFP fluorescence in either ET-1-stimulated or non-stimulated cells (Fig. 5C). Quantification of RFP fluorescence intensity from 40 to 60 cells showed that there was a significant increase (∼3-fold) in Itpr2 promoter activity in full-length promoter-infected ET-1-stimulated cells compared with the control (un-stimulated) and del-1 construct expressing ET-1-stimulated and non-stimulated cells (Fig. 5D). For control experiments, we infected adenovirus expressing RFP protein alone and there was no significant difference in RFP protein expression in both ET-1-stimulated and non-stimulated cells (data not shown). These results suggest that the Itpr2 promoter is regulated by the calcineurin-NFATc signaling pathway and NFATc directly binds to the Itpr2 promoter to regulate its expression.
To further evaluate NFATc-mediated regulation of the Itpr2 promoter we used CsA, the potent inhibitor of calcineurin-NFAT signaling (22). ARVMs were infected with the full-length Itpr2 promoter construct (Ad-Itpr2-RFP-FL) for 24 h and then stimulated with ET-1 (100 nm) with or without CsA. ITPR2 promoter activity was measured after 12 h. As shown in Fig. 6A in cells expressing the full-length Itpr2 promoter, CsA alone had no effect and showed only a basal level of RFP fluorescence. However, when CsA-treated cells were stimulated with ET-1 (100 nm), the ET-1-mediated increase in RFP fluorescence was attenuated (Fig. 6, A and B). These data corroborate previous results and suggest that the Itpr2 promoter is regulated by direct binding of NFATc and addition of CsA attenuates ITPR2 expression by inhibiting calcineurin-NFATc signaling.
FIGURE 6.
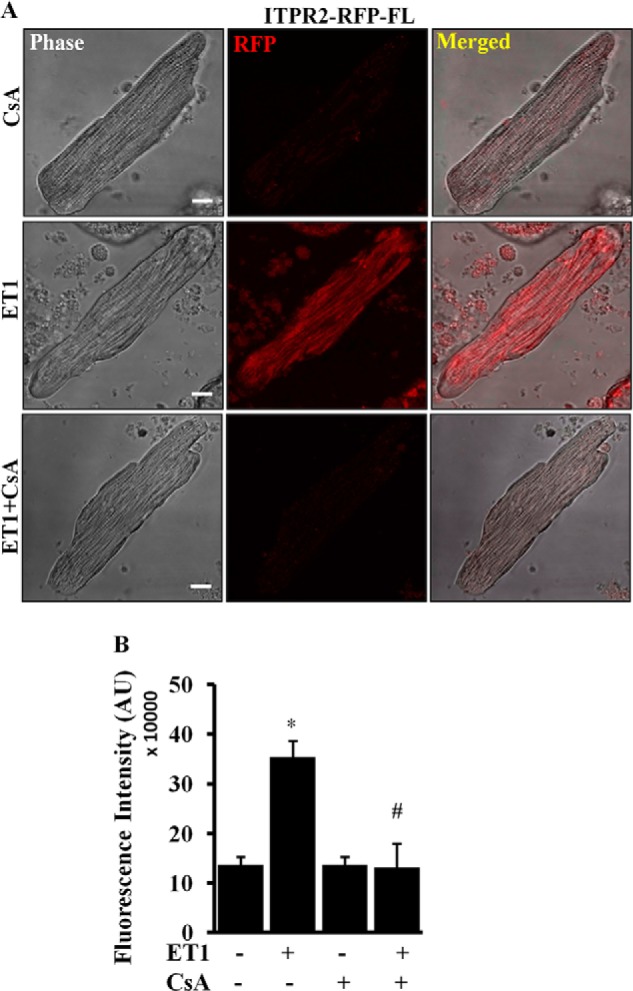
Cyclosporine-A attenuated the endothelin-1-mediated activation of the Itpr2 promoter. A, ARVMs were infected with adenovirus expressing the full-length Itpr2 gene promoter for 24 h. The cells were treated with CsA (10 μm) or ET-1 (100 nm) or CsA and ET-1 for 12 h and the fluorescence intensity was measured in live cells. B, quantification result showing Itpr2 gene promoter activation by ET-1 compared with CsA alone and treatment with CsA plus ET-1 attenuated the ET-1-mediated activation. The quantification data are presented with mean ± S.E. (*, p < 0.05 compared with control; #, p < 0.05 compared with ET-1 stimulated) from 40 to 60 cells from three independent experiments.
Calcineurin-NFATc Regulates Itpr2 Transcription
To confirm the previous results we examined the regulation of Itpr2 expression by the calcineurin-NFATc signaling pathway. To study activation of the NFATc transcriptional activity, ARVMs were infected with the adenovirus expressing NFATc-Luc-GFP construct for 24 h. The cells were then stimulated with ET-1(100 nm) with and without either 2-APB or Xes-C for 6 h. The cells were lysed and the luciferase activity was measured and normalized to the GFP fluorescence.
The results presented in Fig. 7A show that there was approximately a 4-fold increase in NFATc luciferase activity in ET-1-stimulated cells compared with control (p < 0.05). However, both of the InsP3R antagonists 2-APB and Xes-C significantly inhibited ET-1-induced NFATc luciferase activity. These results suggest that ET-1 stimulation activates NFATc activity through InsP3R2-mediated Ca2+ release and that it was attenuated by the InsP3R antagonists consistent with the previous studies (13).
FIGURE 7.
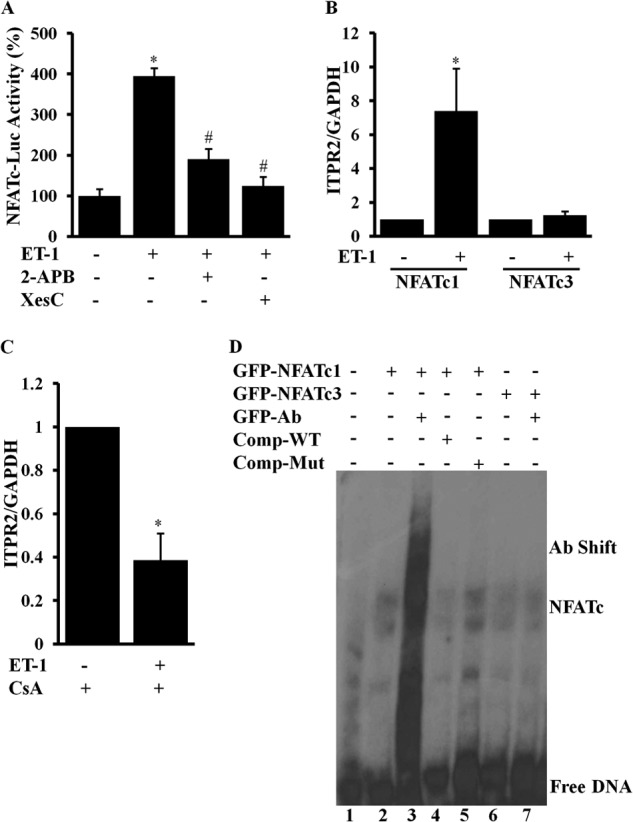
NFATc mediated regulation of InsP3R2 expression. A, ARVMs were infected with adenoviruses expressing a NFATc-Luc-GFP construct for 24 h. The cells stimulated with ET-1 (100 nm) for 6 h activated NFATc luciferase activity compared with control cells, which was attenuated by 2-APB (2 μm) and Xes-C (3 μm). B, ARVMs were infected with adenoviruses expressing GFP-NFATc1 and GFP-NFATc3 for 24 h. ET-1 stimulation for 12 h activated Itpr2 mRNA expression in GFP-NFATc1-infected cells compared with GFP-NFATc3-infected cells compared with the corresponding unstimulated cells. C, ARVMs were treated with CsA and stimulated with ET-1 (100 nm) for 12 h and RT-qPCR analysis showing attenuation of Itpr2 mRNA expression in CsA treated, ET-1-stimulated cells was compared with CsA alone treated cells. D, EMSA showing NFATc binding to the Itpr2 gene promoter and the complex supershifted by the GFP antibody. Competition assays using WT oligo abolished the complex compared with the mutated oligo at ×20 concentration. NFATc3 showing week binding, which was not supershifted by GFP antibody. The quantification data are presented with mean ± S.E. from three different experiments carried out in triplicates (*, p < 0.05 ET-1 versus control; #, p < 0.05 ET-1 versus 2-APB or Xes-C).
In heart both NFATc1 and NFATc3 have been implicated in he regulation of hypertrophic gene expression (13, 25). To study the transcriptional regulation of InsP3R2 by NFATc isoforms, we infected ARVMs with adenoviruses expressing GFP-NFATc1 and GFP-NFATc3 for 24 h followed by treatment with ET-1 (100 nm) for 12 h. Total RNA extracted from these cells was reverse transcribed and the ITPR2 mRNA level was analyzed by RT-qPCR. The results show that NFATc1-infected ET-1-stimulated cells activated Itpr2 mRNA expression (7-fold; p < 0.05) compared with NFATc1-infected non-stimulated cells. There was no significant difference in Itpr2 mRNA expression between ET-1-stimulated and non-stimulated cells infected with NFATc3 (Fig. 7B).
To confirm these results, ARVMs were treated with the calcineurin-NFATc antagonist CsA and stimulated with ET-1. The results show that there was significant inhibition of Itpr2 gene expression in ET-1-stimulated cells treated with CsA compared with CsA alone control cells (Fig. 7C). These results confirm that ET-1-stimulated expression of Itpr2 was inhibited by CsA. Together these results demonstrate that InsP3R2-mediated Ca2+ release regulates the calcineurin-NFATc signaling pathway and inhibition of either InsP3-mediated Ca2+ release or calcineurin-NFATc signaling inhibits the activation of Itpr2 gene expression.
NFATc1 Binds to the Itpr2 Gene Promoter
To further evaluate the NFATc isoform-specific regulation of Itpr2 gene expression, we carried out EMSA as described under “Experimental Procedures.” H9C2 cells were infected with adenoviruses expressing GFP-NFATc1 and GFP-NFATc3. The cells were stimulated with ET-1 for 6 h for nuclear translocation of NFATc proteins and the nuclear extract prepared from these cells was incubated with oligonucleotide corresponding to the NFAT binding site of the Itpr2 gene promoter. GFP-NFATc1 protein formed a complex with the DNA (lane 2) and this was supershifted by the GFP antibody (lane 3) confirming the presence of the NFATc1 complex (Fig. 7D). Competition assays carried out with ×20 WT oligo reduced the intensity of the complex (lane 4), whereas the NFATc-mut oligo retained the complex (lane 5) suggesting that NFATc1 forms a complex.
When GFP-NFATc3 nuclear extract was used in the binding reaction, it formed a less intense band (Fig. 7, lane 6) and GFP antibody did not show any supershift (lane 7). These results suggest that NFATc1 strongly binds to the Itpr2 gene promoter compared with NFATc3. These results are consistent with our RT-qPCR results, which showed elevated InsP3R2 mRNA expression in NFATc1-expressed ARVMs compared with NFATc3-expressed cells.
InsP3R2 Expression in Calcineurin-A Overexpressing Transgenic Animals
Our data demonstrates that the calcineurin-NFATc signaling pathway regulates expression of the Itpr2 gene by regulating a component of its promoter activity. To confirm our in vitro data we studied the expression of InsP3R2 mRNA in CnA-TG mouse hearts (22) and compared this with the WT littermates. We found increased expression of the InsP3R2 protein in CnA-TG animal hearts compared with WT.4
Here we studied Itpr2 mRNA expression. RT-qPCR analysis showed that there was an approximate 2-fold activation of Itpr2 mRNA expression in CnA-TG mouse hearts compared with WT hearts. Similarly, in other hypertrophic gene markers, Anf, Acta1, and β-Mhc, gene expression was also increased in CnA-TG mouse hearts (Fig. 8). These results are consistent with previous studies (22) and confirm that expression of the Itpr2 gene is regulated by the calcineurin-NFATc signaling pathway during cardiac hypertrophy and heart failure that results in the increased expression of InsP3R2 protein.
FIGURE 8.
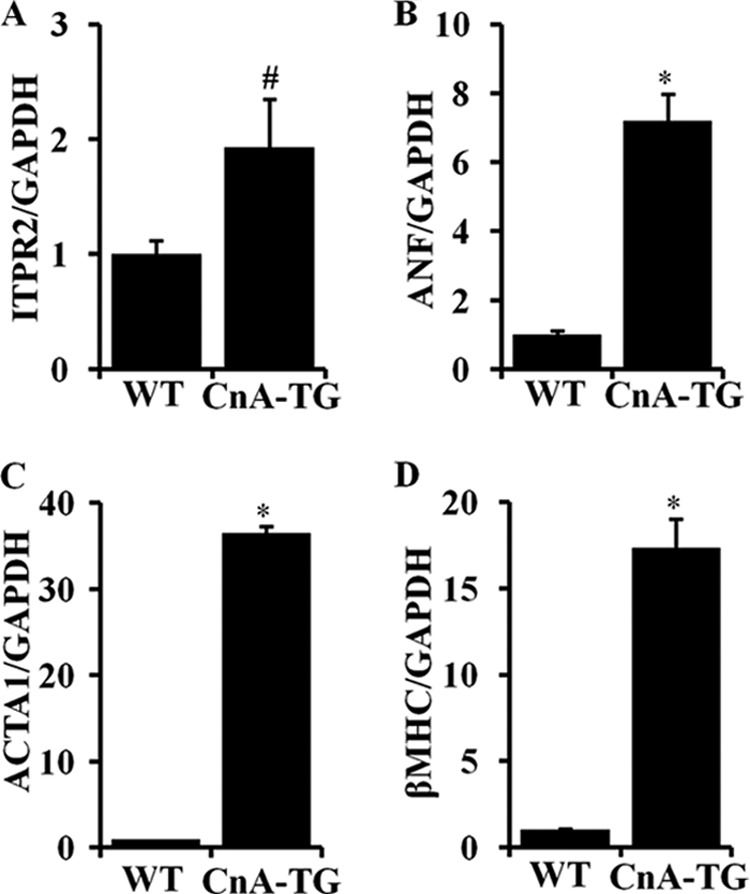
InsP3R2 mRNA expression is activated in calcineurin-A transgenic mouse hearts. A–D, RT-qPCR analysis showing the increased Itpr2, Anf, Acta1, and β-Mhc mRNA expression, respectively, in CnA-TG compared with the WT littermates. The quantification data are presented with mean ± S.D. (n = 2).
DISCUSSION
In the heart, InsP3R2 is the predominant isoform expressed among the three types of InsP3Rs and largely localized to the nuclear membrane (3, 9). The InsP3R2 channel released nuclear Ca2+ regulates excitation-transcription coupling and regulates different Ca2+-sensitive signaling pathways that activate hypertrophic gene expression (4, 11, 12, 14, 15, 26, 28).
Recent studies have shown that the InsP3R2 protein is a hypertrophy specific marker and it is overexpressed during cardiac hypertrophy and heart failure in animal models and humans (20, 21). However, the molecular mechanism(s) regulating the increased expression of InsP3R2 and its functional consequences during cardiac hypertrophy and heart failure are not known.
In this study we demonstrate that InsP3-mediated Ca2+ release activates transcriptional regulation of the Itpr2 gene through the calcineurin-NFATc signaling pathway (13). Hypertrophy agonists ET-1, AngII, and PE activate InsP3R2 mRNA and protein expression in cardiomyocytes and this activation is attenuated by InsP3R and calcineurin-NFATc signaling inhibitors 2-ABP, Xes-C, and CsA, respectively. We show that NFATc1, but not NFATc3, directly binds to the Itpr2 gene promoter to regulate its expression. Deletion of the NFATc binding region or inhibition of calcineurin-NFATc signaling attenuated activation of Itpr2 gene promoter. Consistent with these in vitro studies, InsP3R2 protein and mRNA expression was activated in calcineurin-A transgenic mouse hearts and human heart failure samples.
The hypertrophy agonists that activate α/β-adrenergic receptors have been shown to regulate hypertrophic gene expression in cultured cardiomyocytes, animal models, and humans (3, 12, 15). Consistent with these studies, our data demonstrates that hypertrophy specific genes are activated along with the Itpr2 gene in agonist-stimulated ARVMs.
Our data show that the Itpr2 gene is one of the early hypertrophic genes expressed after agonist treatment and can be detected as early as 6 h post-stimulation. These data demonstrate that Itpr2 gene expression is regulated at early time points by distinct hypertrophic transcriptional program.
Accumulating evidence shows that G-protein coupled and growth hormone receptors present in the nuclear membrane and perinuclear region are involved in the activation of hypertrophic gene expression (29–32). However, all these signaling mechanisms rely on InsP3R2 for increased nuclear Ca2+ to activate hypertrophic gene transcription. InsP3R2-mediated Ca2+ release in the activation of hypertrophic gene expression has been shown by many studies. In all these studies blocking InsP3R2-mediated Ca2+ release using InsP3R2 specific antagonists 2-APB, xestospongin-C, and InsP3-Sponge attenuates the expression of hypertrophic gene expression (3, 12, 13, 28). In close agreement with these studies Itpr2 gene expression was inhibited by InsP3R inhibitors 2-APB and Xes-C and suggests that Itpr2 and other hypertrophic genes are regulated by the InsP3R2-mediated nuclear Ca2+ release.
The initial Ca2+ released through InsP3R binds to calmodulin and regulates multiple Ca2+-sensitive signaling pathways to activate hypertrophic response (33). At present the major signaling pathways that are regulated by InsP3R2-mediated Ca2+ release are CaMKIIδ, histone deacetylase, and calcineurin-NFATc (12, 13, 16). These pathways have been shown to regulate hypertrophic development by deregulating hypertrophy specific fetal gene expression (22, 34, 35). The InsP3R inhibitors attenuated the activation of these signaling pathways followed by hypertrophic gene expression. Among these signaling pathways, calcineurin-NFATc signaling pathway-mediated fetal gene expression has been well established in the development of hypertrophy (22). Calcineurin-A is a Ca2+-calmodulin-dependent phosphatase that dephosphorylates cytosolic NFATc. The dephosphorylated NFATc translocates into the nucleus and activates hypertrophic gene expression either by binding directly to its target sequence or in concert with other transcription factors such as AP-1, GATA4, NF-κB, MEF2, cAMP-response element-binding protein, c-Myc, and IRF-1 and also the chromatin modifying proteins hypoxanthine/aminopterin/thymidines and histone deacetylases interact with NFATc (22). Activation of calcineurin has been shown to be regulated by InsP3R2-mediated Ca2+ release and InsP3R2-mediated NFATc nuclear translocation into the nucleus have been reported in rabbit cardiomyocytes (13) and during early heart development (36). In these studies, either inhibition of InsP3R Ca2+ release or the calcineurin-NFATc pathway attenuated NFATc nuclear translocation. Moreover in ventricular cardiomyocytes, NFATc1 but not NFATc3 nuclear translocation was induced by ET-1 stimulation (37). Our results are consistent with these studies and show that Itpr2 gene expression is activated in vivo in human heart failure and CnA-TG mouse hearts. Our in vitro studies using ARVMs stimulated with hypertrophy agonists clearly demonstrate InsP3R2 transcriptional and translational activation. The activation of InsP3R2 mRNA expression was regulated by NFATc1 compared with NFATc3. This NFATc1-mediated activation of InsP3R2 was attenuated by InsP3R2 inhibitors 2-APB and Xes-C, and calcineurin-NFATc inhibitor CsA. Quantification of InsP3R2 transcripts in animal hearts is controversial as shown by recent studies. Using different mouse models Cooley et al. (38) showed InsP3R2 mRNA expression by qPCR from mouse hearts yet concluded that the InsP3R2 did not contribute to progression of DCM or hypertrophy. However, Drawnel et al. (39) showed that there was no increase in InsP3R2 mRNA expression in animal hearts, and microRNA, mi133a, regulates the increased InsP3R2 protein expression during cardiac hypertrophy and heart failure. This difference in Itpr2 gene expression in animal hearts may be due to the temporally constrained regulation of Itpr2 gene expression. Our in vitro data provide evidence that the Itpr2 gene is regulated during early time points and declines after 24 h suggesting that Itpr2 mRNA expression and stability are tightly regulated during early time points after α/β-adrenergic receptor activation.
Several studies have shown NFATc in the regulation of the InsP3R1 (type 1) expression in neuronal cells and those predominantly express InsP3R1 (40, 41). A recent study has shown that during hypertension InsP3R1 expression is activated in vascular smooth muscle cells in a NFATc-dependent manner (42). This increase in InsP3R1 sensitizes IP3-mediated Ca2+ signaling. All these studies have shown activation of InsP3R1 by calcineurin-NFATc-mediated signaling. However, in the heart the InsP3R2 is the major isoform and this is the first report describing the regulation of InsP3R2 by the calcineurin-NFATc signaling pathway at the transcriptional level. Together, the positive feedback loop between the InsP3R2 Ca2+ channel and calcineurin-NFATc pathway regulates hypertrophic gene expression including the Itpr2 gene during cardiac remodeling.
In conclusion, our data provide evidence that InsP3R2-mediated activation of the calcineurin-NFATc signaling pathway regulates Itpr2 and hypertrophy specific gene expression in a positive feedback loop (Fig. 9). The increased expression of InsP3R2 during cardiac hypertrophy and heart failure is regulated by both transcriptional and post-transcriptional mechanisms that may be important to maintain Ca2+ homeostasis during cardiac remodeling.
FIGURE 9.
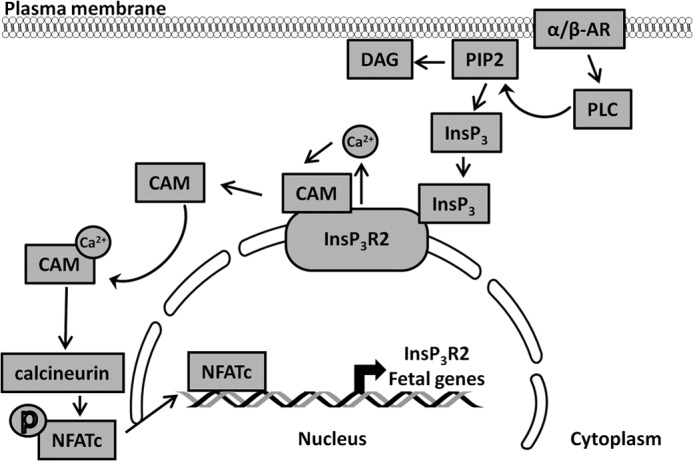
A working model showing the regulation if InsP3R2 expression during cardiac remodeling. α/β-Adrenergic stimulation followed by phospholipase-C activation releases the second messenger InsP3 that stimulates the InsP3R2 channel to release Ca2+. This Ca2+ associates with calmodulin and Ca2+-CaM regulates the activity of calcineurin-A. The activated CnA dephosphorylates the phospho-NFATc transcription factor in the cytosol. The dephosphorylated NFATc translocates into the nucleus and binds to the Itpr2 gene promoter to regulate its expression in a positive feedback loop. Similarly, NFATc transcription factors activate the responsive hypertrophy specific fetal genes during cardiac remodeling process.
Acknowledgments
We thank Dr. Jeff Molkentin for providing CnA-TG mouse heart samples and Dr. Seth Robia for technical assistance in confocal microscopy. We also thank Dr. Ajay Rana for help in EMSA experiments.
This work was supported, in whole or in part, by National Institutes of Health Grant PO1-HL080101 (to G. A. M.).
N. Sankar, C. B. Gray, S. Dewan, E. Bovo, J. T. Maxwell, J. H. Brown, D. M. Bers, P. P. deTombe, and G. A. Mignery, manuscript in preparation.
- InsP3R
- inositol 1,4,5-triphosphate receptor
- ET-1
- endothelin-1
- AngII
- angiotensin II
- PE
- phenylephrine
- CsA
- cyclosporine-A
- 2-APB
- 2-aminoethoxydiphenyl borate
- ARVMs
- adult ventricular myocytes
- NFAT
- nuclear factor activated in T cells
- DCM
- dilated cardiomyopathy
- CnA-Tg
- calcineurin-A over-expressing transgenic
- qPCR
- quantitative PCR
- RFP
- red fluorescent protein
- ANF
- atrial natriuretic factor.
REFERENCES
- 1. Lorell B. H., Carabello B. A. (2000) Left ventricular hypertrophy. Pathogenesis, detection, and prognosis. Circulation 102, 470–479 [DOI] [PubMed] [Google Scholar]
- 2. Dorn G. W., 2nd, Force T. (2005) Protein kinase cascades in the regulation of cardiac hypertrophy. J. Clin. Invest. 115, 527–537 [DOI] [PMC free article] [PubMed] [Google Scholar]
- 3. Bare D. J., Kettlun C. S., Liang M., Bers D. M., Mignery G. A. (2005) Cardiac type 2 inositol 1,4,5-trisphosphate receptor. Interaction and modulation by calcium/calmodulin-dependent protein kinase II. J. Biol. Chem. 280, 15912–15920 [DOI] [PubMed] [Google Scholar]
- 4. Anderson M. E. (2000) Connections count. Excitation-contraction meets excitation-transcription coupling. Circ. Res. 86, 717–719 [DOI] [PubMed] [Google Scholar]
- 5. Kuwahara K., Nishikimi T., Nakao K. (2012) Transcriptional regulation of the fetal cardiac gene program. J. Pharmacol. Sci. 119, 198–203 [DOI] [PubMed] [Google Scholar]
- 6. Borlak J., Thum T. (2003) Hallmarks of ion channel gene expression in end-stage heart failure. FASEB J. 17, 1592–1608 [DOI] [PubMed] [Google Scholar]
- 7. Foskett J. K., White C., Cheung K. H., Mak D. O. (2007) Inositol trisphosphate receptor Ca2+ release channels. Physiol. Rev. 87, 593–658 [DOI] [PMC free article] [PubMed] [Google Scholar]
- 8. Newton C. L., Mignery G. A., Südhof T. C. (1994) Co-expression in vertebrate tissues and cell lines of multiple inositol 1,4,5-trisphosphate (InsP3) receptors with distinct affinities for InsP3. J. Biol. Chem. 269, 28613–28619 [PubMed] [Google Scholar]
- 9. Perez P. J., Ramos-Franco J., Fill M., Mignery G. A. (1997) Identification and functional reconstitution of the type 2 inositol 1,4,5-trisphosphate receptor from ventricular cardiac myocytes. J. Biol. Chem. 272, 23961–23969 [DOI] [PubMed] [Google Scholar]
- 10. Zima A. V., Bare D. J., Mignery G. A., Blatter L. A. (2007) IP3-dependent nuclear Ca2+ signalling in the mammalian heart. J. Physiol. 584, 601–611 [DOI] [PMC free article] [PubMed] [Google Scholar]
- 11. Lipp P., Laine M., Tovey S. C., Burrell K. M., Berridge M. J., Li W., Bootman M. D. (2000) Functional InsP3 receptors that may modulate excitation-contraction coupling in the heart. Curr. Biol. 10, 939–942 [DOI] [PubMed] [Google Scholar]
- 12. Wu X., Zhang T., Bossuyt J., Li X., McKinsey T. A., Dedman J. R., Olson E. N., Chen J., Brown J. H., Bers D. M. (2006) Local InsP3-dependent perinuclear Ca2+ signaling in cardiac myocyte excitation-transcription coupling. J. Clin. Invest. 116, 675–682 [DOI] [PMC free article] [PubMed] [Google Scholar]
- 13. Rinne A., Blatter L. A. (2010) Activation of NFATc1 is directly mediated by IP3 in adult cardiac myocytes. Am. J. Physiol. Heart Circ. Physiol. 299, H1701–H1707 [DOI] [PMC free article] [PubMed] [Google Scholar]
- 14. Kockskämper J., Zima A. V., Roderick H. L., Pieske B., Blatter L. A., Bootman M. D. (2008) Emerging roles of inositol 1,4,5-trisphosphate signaling in cardiac myocytes. J. Mol. Cell Cardiol. 45, 128–147 [DOI] [PMC free article] [PubMed] [Google Scholar]
- 15. Higazi D. R., Fearnley C. J., Drawnel F. M., Talasila A., Corps E. M., Ritter O., McDonald F., Mikoshiba K., Bootman M. D., Roderick H. L. (2009) Endothelin-1-stimulated InsP3-induced Ca2+ release is a nexus for hypertrophic signaling in cardiac myocytes. Molecular cell 33, 472–482 [DOI] [PubMed] [Google Scholar]
- 16. Bossuyt J., Helmstadter K., Wu X., Clements-Jewery H., Haworth R. S., Avkiran M., Martin J. L., Pogwizd S. M., Bers D. M. (2008) Ca2+/calmodulin-dependent protein kinase IIδ and protein kinase D overexpression reinforce the histone deacetylase 5 redistribution in heart failure. Circ. Res. 102, 695–702 [DOI] [PubMed] [Google Scholar]
- 17. Kockskämper J., Sheehan K. A., Bare D. J., Lipsius S. L., Mignery G. A., Blatter L. A. (2001) Activation and propagation of Ca2+ release during excitation-contraction coupling in atrial myocytes. Biophys. J. 81, 2590–2605 [DOI] [PMC free article] [PubMed] [Google Scholar]
- 18. Mackenzie L., Bootman M. D., Laine M., Berridge M. J., Thuring J., Holmes A., Li W. H., Lipp P. (2002) The role of inositol 1,4,5-trisphosphate receptors in Ca2+ signalling and the generation of arrhythmias in rat atrial myocytes. J. Physiol. 541, 395–409 [DOI] [PMC free article] [PubMed] [Google Scholar]
- 19. Mackenzie L., Roderick H. L., Proven A., Conway S. J., Bootman M. D. (2004) Inositol 1,4,5-trisphosphate receptors in the heart. Biol. Res. 37, 553–557 [DOI] [PubMed] [Google Scholar]
- 20. Harzheim D., Movassagh M., Foo R. S., Ritter O., Tashfeen A., Conway S. J., Bootman M. D., Roderick H. L. (2009) Increased InsP3Rs in the junctional sarcoplasmic reticulum augment Ca2+ transients and arrhythmias associated with cardiac hypertrophy. Proc. Natl. Acad. Sci. U.S.A. 106, 11406–11411 [DOI] [PMC free article] [PubMed] [Google Scholar]
- 21. Harzheim D., Talasila A., Movassagh M., Foo R. S., Figg N., Bootman M. D., Roderick H. L. (2010) Elevated InsP3R expression underlies enhanced calcium fluxes and spontaneous extra-systolic calcium release events in hypertrophic cardiac myocytes. Channels 4, 67–71 [DOI] [PubMed] [Google Scholar]
- 22. Heineke J., Molkentin J. D. (2006) Regulation of cardiac hypertrophy by intracellular signalling pathways. Nat. Rev. Mol. Cell Biol. 7, 589–600 [DOI] [PubMed] [Google Scholar]
- 23. Morikawa K., Ohbayashi T., Nakagawa M., Konishi Y., Makino Y., Yamada M., Miyawaki A., Furuichi T., Mikoshiba K., Tamura T. (1997) Transcription initiation sites and promoter structure of the mouse type 2 inositol 1,4,5-trisphosphate receptor gene. Gene 196, 181–185 [DOI] [PubMed] [Google Scholar]
- 24. Sankar N., Baluchamy S., Kadeppagari R. K., Singhal G., Weitzman S., Thimmapaya B. (2008) p300 provides a corepressor function by cooperating with YY1 and HDAC3 to repress c-Myc. Oncogene 27, 5717–5728 [DOI] [PubMed] [Google Scholar]
- 25. Molkentin J. D., Lu J. R., Antos C. L., Markham B., Richardson J., Robbins J., Grant S. R., Olson E. N. (1998) A calcineurin-dependent transcriptional pathway for cardiac hypertrophy. Cell 93, 215–228 [DOI] [PMC free article] [PubMed] [Google Scholar]
- 26. Nakayama H., Bodi I., Maillet M., DeSantiago J., Domeier T. L., Mikoshiba K., Lorenz J. N., Blatter L. A., Bers D. M., Molkentin J. D. (2010) The IP3 receptor regulates cardiac hypertrophy in response to select stimuli. Circ. Res. 107, 659–666 [DOI] [PMC free article] [PubMed] [Google Scholar]
- 27. Lipp P., Thomas D., Berridge M. J., Bootman M. D. (1997) Nuclear calcium signalling by individual cytoplasmic calcium puffs. EMBO J. 16, 7166–7173 [DOI] [PMC free article] [PubMed] [Google Scholar]
- 28. Domeier T. L., Zima A. V., Maxwell J. T., Huke S., Mignery G. A., Blatter L. A. (2008) IP3 receptor-dependent Ca2+ release modulates excitation-contraction coupling in rabbit ventricular myocytes. Am. J. Physiol. Heart Circ. Physiol. 294, H596–H604 [DOI] [PubMed] [Google Scholar]
- 29. Ibarra C., Vicencio J. M., Estrada M., Lin Y., Rocco P., Rebellato P., Munoz J. P., Garcia-Prieto J., Quest A. F., Chiong M., Davidson S. M., Bulatovic I., Grinnemo K. H., Larsson O., Szabadkai G., Uhlén P., Jaimovich E., Lavandero S. (2013) Local control of nuclear calcium signaling in cardiac myocytes by perinuclear microdomains of sarcolemmal insulin-like growth factor 1 receptors. Circ. Res. 112, 236–245 [DOI] [PubMed] [Google Scholar]
- 30. Vaniotis G., Allen B. G., Hébert T. E. (2011) Nuclear GPCRs in cardiomyocytes. An insider's view of β-adrenergic receptor signaling. Am. J. Physiol. Heart Circ. Physiol. 301, H1754–H1764 [DOI] [PMC free article] [PubMed] [Google Scholar]
- 31. Vaniotis G., Del Duca D., Trieu P., Rohlicek C. V., Hébert T. E., Allen B. G. (2011) Nuclear β-adrenergic receptors modulate gene expression in adult rat heart. Cell. Signal. 23, 89–98 [DOI] [PMC free article] [PubMed] [Google Scholar]
- 32. Zhang L., Malik S., Pang J., Wang H., Park K. M., Yule D. I., Blaxall B. C., Smrcka A. V. (2013) Phospholipase Cϵ hydrolyzes perinuclear phosphatidylinositol 4-phosphate to regulate cardiac hypertrophy. Cell 153, 216–227 [DOI] [PMC free article] [PubMed] [Google Scholar]
- 33. Tilley D. G. (2011) G protein-dependent and G protein-independent signaling pathways and their impact on cardiac function. Circ. Res. 109, 217–230 [DOI] [PMC free article] [PubMed] [Google Scholar]
- 34. Zhang T., Kohlhaas M., Backs J., Mishra S., Phillips W., Dybkova N., Chang S., Ling H., Bers D. M., Maier L. S., Olson E. N., Brown J. H. (2007) CaMKIIδ isoforms differentially affect calcium handling but similarly regulate HDAC/MEF2 transcriptional responses. J. Biol. Chem. 282, 35078–35087 [DOI] [PubMed] [Google Scholar]
- 35. Zhang T., Maier L. S., Dalton N. D., Miyamoto S., Ross J., Jr., Bers D. M., Brown J. H. (2003) The δC isoform of CaMKII is activated in cardiac hypertrophy and induces dilated cardiomyopathy and heart failure. Circ. Res. 92, 912–919 [DOI] [PubMed] [Google Scholar]
- 36. Mizushima A., Uchida S., Zhou X. M., Osugi T., Imaizumi T., Misaki N., Tatebayashi Y., Yoshida H. (1989) The H-L subgroup of guinea-pig cardiac M2 receptors (M2β) regulates inositol phosphate formation. Eur. J. Pharmacol. 168, 375–380 [DOI] [PubMed] [Google Scholar]
- 37. Rinne A., Blatter L. A. (2010) Activation of NFATc1 is directly mediated by IP3 in adult cardiac myocytes. Am. J. Physiol. Heart Circ. Physiol. 299, H1701–H1707 [DOI] [PMC free article] [PubMed] [Google Scholar]
- 38. Cooley N., Ouyang K., McMullen J. R., Kiriazis H., Sheikh F., Wu W., Mu Y., Du X. J., Chen J., Woodcock E. A. (2013) No contribution of IP3-R(2) to disease phenotype in models of dilated cardiomyopathy or pressure overload hypertrophy. Circulation 6, 318–325 [DOI] [PMC free article] [PubMed] [Google Scholar]
- 39. Drawnel F. M., Wachten D., Molkentin J. D., Maillet M., Aronsen J. M., Swift F., Sjaastad I., Liu N., Catalucci D., Mikoshiba K., Hisatsune C., Okkenhaug H., Andrews S. R., Bootman M. D., Roderick H. L. (2012) Mutual antagonism between IP(3)RII and miRNA-133a regulates calcium signals and cardiac hypertrophy. J. Cell Biol. 199, 783–798 [DOI] [PMC free article] [PubMed] [Google Scholar]
- 40. Genazzani A. A., Carafoli E., Guerini D. (1999) Calcineurin controls inositol 1,4,5-trisphosphate type 1 receptor expression in neurons. Proc. Natl. Acad. Sci. U.S.A. 96, 5797–5801 [DOI] [PMC free article] [PubMed] [Google Scholar]
- 41. Mizuno K., Kurokawa K., Ohkuma S. (2013) Regulation of type 1 IP3 receptor expression by dopamine D2-like receptors via AP-1 and NFATc4 activation. Neuropharmacology 71, 264–272 [DOI] [PubMed] [Google Scholar]
- 42. Abou-Saleh H., Pathan A. R., Daalis A., Hubrack S., Abou-Jassoum H., Al-Naeimi H., Rusch N. J., Machaca K. (2013) IP3 receptor up-regulation in hypertension is associated with sensitization of Ca2+ release and vascular smooth muscle contractility. J. Biol. Chem. 288, 32941–32951 [DOI] [PMC free article] [PubMed] [Google Scholar]
- 43. Maxwell J. T., Natesan S., Mignery G. A. (2012) Modulation of inositol 1,4,5-trisphosphate receptor type 2 channel activity by Ca2+/calmodulin-dependent protein kinase II (CaMKII)-mediated phosphorylation. J. Biol. Chem. 287, 39419–39428 [DOI] [PMC free article] [PubMed] [Google Scholar]