

Abstract
Objective:
To investigate whether patients with behavioral variant frontotemporal dementia (bvFTD) have dysregulation in satiety-related hormonal signaling using a laboratory-based case-control study.
Methods:
Fifty-four participants (19 patients with bvFTD, 17 patients with Alzheimer disease dementia, and 18 healthy normal controls [NCs]) were recruited from a tertiary-care dementia clinic. During a standardized breakfast, blood was drawn before, during, and after the breakfast protocol to quantify levels of peripheral satiety-related hormones (ghrelin, cortisol, insulin, leptin, and peptide YY) and glucose. To further explore the role of patients' feeding abnormalities on hormone levels, patients were classified into overeating and nonovereating subgroups based on feeding behavior during separate laboratory-based standardized lunch feeding sessions.
Results:
Irrespective of their feeding behavior in the laboratory, patients with bvFTD, but not patients with Alzheimer disease dementia, have significantly lower levels of ghrelin and cortisol and higher levels of insulin compared with NCs. Furthermore, while laboratory feeding behavior did not predict alterations in levels of ghrelin, cortisol, and insulin, only patients with bvFTD who significantly overate in the laboratory demonstrated significantly higher levels of leptin compared with NCs, suggesting that leptin may be sensitive to particularly severe feeding abnormalities in bvFTD.
Conclusions:
Despite a tendency to overeat, patients with bvFTD have a hormonal profile that should decrease food intake. Aberrant hormone levels may represent a compensatory response to the behavioral or neuroanatomical abnormalities of bvFTD.
Behavioral variant frontotemporal dementia (bvFTD) is characterized by progressive behavioral changes, including pronounced feeding abnormalities.1 Despite the fact that more than 80% of patients with bvFTD develop feeding abnormalities during the course of their illness,2 the neurohormonal mechanisms and consequences of these abnormalities remain unknown.
Several hormones are implicated in the regulation of feeding behavior. Ghrelin and cortisol promote food intake whereas insulin, leptin, and peptide YY (PYY) are anorectic hormones that typically reduce food intake.3 Additionally, glucose, while not a hormone, is also a key regulator of food consumption, independent from insulin.4 Laboratory studies show that these hormones directly influence reward-related and cognitive control brain circuits.3–7 However, there have been no human neuroanatomical lesion studies investigating the effects of focal neurodegeneration on peripheral satiety hormone levels. The bvFTD pathology is characterized by dysfunction of reward and regulatory circuits8,9 and presents a unique opportunity to elucidate this important neurohormonal system.
We examined whether bvFTD is associated with dysregulation in ghrelin, cortisol, insulin, leptin, PYY, and glucose levels using a laboratory-based controlled study. Control groups included patients with Alzheimer disease (AD) dementia, a disorder not typically associated with overeating, and healthy age-matched participants. To further characterize feeding disturbances, we also administered 2 calorically quantified lunches. Given that behavioral disinhibition, including compulsive overeating, in bvFTD is likely caused by atrophy in frontal and reward-related brain areas, we hypothesized that patients with bvFTD would have levels of satiety-related hormones consistent with a satiated state that should tend to counteract these behavioral and neuroanatomical abnormalities (figure 1).
Figure 1. Dysregulated reward circuits in bvFTD.

This model diagram depicts how alterations to brain circuits may lead to disinhibition in patients with bvFTD, which in turn may lead to hormonal changes. In a healthy brain, stimulatory reward circuits such as the VTA, medial OFC, and striatum are balanced by inhibitory circuits such as the medial PFC, dlPFC, and ACC. The pathogenesis of bvFTD may result in an imbalance of these circuits as the inhibitory regions are early targets of brain atrophy. Moreover, there is evidence supporting a pathologic enlargement of the VTA in bvFTD. This imbalance may lead to compensatory alterations in levels of ghrelin, cortisol, and insulin, as these hormones directly modulate the activity of both the reward-related brain circuits as well as top-down cognitive control circuits. ACC = anterior cingulate cortex; bvFTD = behavioral variant frontotemporal dementia; dlPFC = dorsolateral prefrontal cortex; OFC = orbitofrontal cortex; PFC = prefrontal cortex; VTA = ventral tegmental area.
METHODS
Standard protocol approvals, registrations, and consents.
All study participants signed an institutional review board–approved consent form.
Participants.
Thirty-six patients with a neurodegenerative disease (19 with a bvFTD syndrome [meeting international research criteria10] and 17 with AD dementia [meeting National Institute of Neurological and Communicative Disorders and Stroke–Alzheimer's Disease and Related Disorders Association research criteria11]) were recruited from the University of California, San Francisco (UCSF) Memory and Aging Center, a dementia specialty clinic. Eighteen healthy demographically matched caregivers were recruited as control participants (NC). Patient diagnoses were established by the consensus of a multidisciplinary team comprising neurologists, nurses, neuropsychologists, neuroradiologists, and psychiatrists. Semistructured caregiver interviews were conducted to ensure accurate diagnostic histories. Participants with diabetes were excluded. All participants were evaluated during a 4- to 5-day stay at the UCSF Clinical Care Research Center. During their inpatient stay, each participant participated in a 3-day feeding paradigm, consisting of a standardized breakfast with blood draws on day 2 and 2 successive lunches on days 3 and 4 (figure 2). Study size was determined by practical availability of subjects. To maximize power, we included all potential participants who met the above criteria and could be assessed within the study's timeframe for data collection.
Figure 2. Three-day standardized paradigm consisting of one breakfast and 2 lunches.
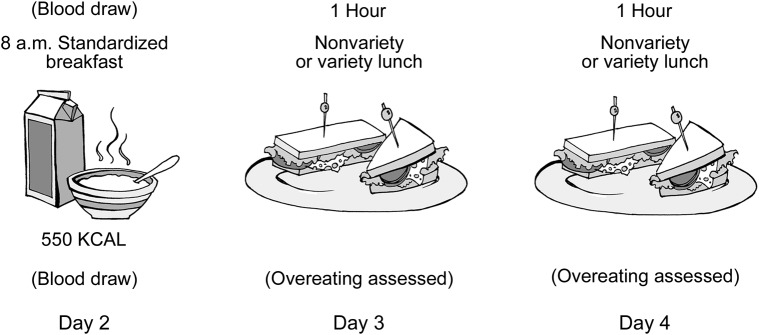
The breakfast was administered on day 2 of the inpatient admission and was used to assess hormonal responses to food intake, with each patient having 2 fasting blood draws, 2 blood draws during the breakfast, and 4 postprandial blood draws. Lunches were used to assess overeating behavior and consisted of an unlimited number of standardized sandwiches administered on days 3 and 4 of the admission.
Breakfast.
Each participant fasted after midnight the night before the breakfast. At 7:20 am, an IV was placed and saline locked and was not removed until after all blood draws. At 8 am, each participant was given a standardized 550-kcal breakfast consisting of oatmeal, peaches, a hardboiled egg, 3.25% milk, orange juice, butter, cottage cheese, and decaffeinated tea. Participants were instructed to complete their meal by 8:30 am at which time the food tray was removed. Participants were encouraged to eat the entire meal (tea optional) within 30 minutes and the quantity of each food item that remained after the 30 minutes was noted. Participants underwent blood draws before, during, and after the breakfast (time point 0 = delivery of breakfast, approximately 8 am). Two samples were drawn before the breakfast (−30 and −5), one was drawn during the breakfast (+15), one was drawn at the end of breakfast (+30), and 4 were drawn after the breakfast was removed (+60, +90, +120, +180). At each blood draw, 1 mL was collected in an SST (Serum Separator Tube) for cortisol assays and 7 mL was collected in an ethylenediaminetetraacetic acid (EDTA) tube for ghrelin, insulin, and glucose assays. At time points −30 and −5 minutes, the 7 mL collected in the EDTA tube was also used for PYY and leptin assays. Samples were immediately stored on wet ice and were aliquoted (the EDTA tube was evenly distributed into separate cryovials for ghrelin, insulin, PYY, glucose, and leptin) before being placed in a −80°C freezer. The following assays were performed: insulin, leptin, and PYY levels quantified by radioimmunoassay (RIA) (Millipore, St. Charles, MO); ghrelin levels, quantified by RIA (Phoenix Pharmaceuticals, Burlingame, CA); cortisol levels quantified by RIA (MP Biomedicals, Solon, OH); and glucose measured with a YSI 2300 glucose analyzer (YSI, Yellow Springs, OH). For PYY, values from the 2 baseline blood draws were combined to calculate a single average PYY level. Because of practical issues involved with blood draws (e.g., temporary blocks in IV lines, missed collections, and lost samples), only 91% of planned samples were obtained.
Lunches.
Each participant refrained from eating for at least 2 hours before each lunch. At noon, participants participated in 1 of 2 lunch feeding paradigms: a nonvariety protocol or a variety protocol (described previously1). Total caloric intake during each lunch was calculated. Participants who ate more than 2 SDs above the average caloric intake of the patients and NCs were classified as “overeaters.”
Medications and body mass index.
To establish comparability among the groups, each participant's height and weight were measured to calculate body mass index (BMI). Participants' waist-to-hip ratios were calculated from waist measures at the midpoint between the bottom of the rib cage and the top of the hip bone and hip measures at the widest part of the hips. A physician documented each participant's medications at admission.
Cognitive testing.
All patients underwent cognitive, neuropsychiatric, and functional evaluations including the Mini-Mental State Examination (MMSE), Clinical Dementia Rating (CDR) scale, and Neuropsychiatric Inventory (NPI). The MMSE measures cognitive decline, the CDR measures dementia severity, and the NPI is a caregiver interview that measures neuropsychiatric and behavioral disturbances.
Statistical analyses conducted.
To examine differences between groups across time points, a random coefficients model using SAS Proc Mixed (SAS 9.2; SAS Institute Inc., Cary, NC) was used to generate estimates of hormone levels for each diagnostic group at each time point, which were compared between the 2 patient groups and the control group. To correct for multiple comparisons, Fisher least significant difference was used to test the global hypothesis of each statistical model at p < 0.05. A deviation statistic was calculated between the condition means model, consisting of the covariates age, sex, and BMI, and the overall model, consisting of time point, diagnostic group, time point × diagnostic group, age, sex, and BMI. Pairwise comparisons were performed at the same level of significance only when the deviation statistic was statistically significant, using a Dunnett-Hsu test to compare patients with NCs.
RESULTS
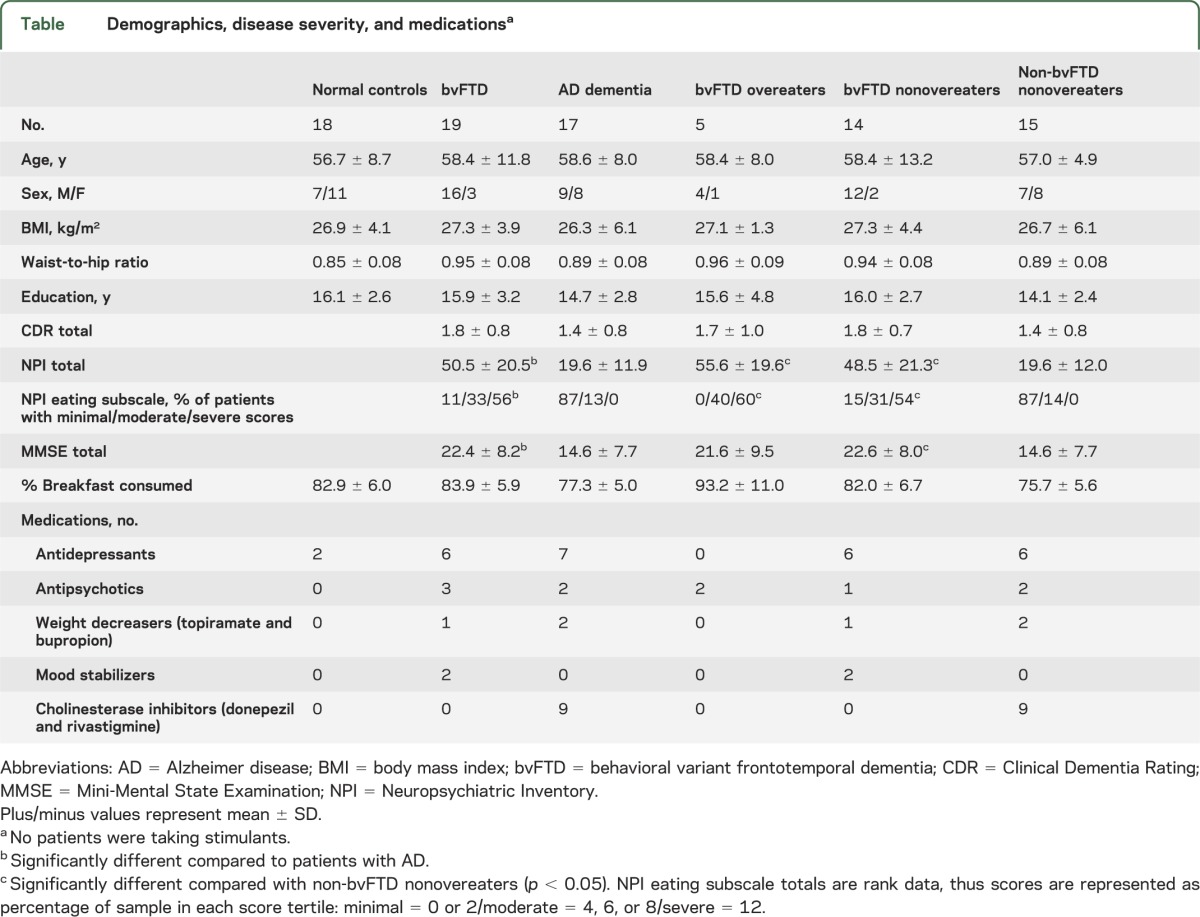
General linear models with Dunnett post hoc tests did not show differences at α p < 0.05 in age, BMI, waist-to-hip ratio, education, or percentage of breakfast calories consumed between patient groups and NCs (table). Using general linear models with post hoc Tukey tests comparing across all groups, there were no differences in CDR scores between diagnostic groups, although patients with bvFTD had higher NPI total (F32,1 = 27.92, p < 0.001), NPI eating subscale (F31,1 = 35.29, p < 0.001), and MMSE (F34,1 = 5.60, p < 0.008) scores than did patients with AD dementia.
Table.
Demographics, disease severity, and medicationsa
Prophagic hormone levels.
Before breakfast, patients with bvFTD had lower levels of the prophagic hormone ghrelin compared with NCs (figure 3A). Patients with bvFTD also had lower levels of ghrelin at +15 and +180 minutes after the delivery of breakfast and there were nonsignificant trends toward lower levels of ghrelin in patients with bvFTD compared with NCs at all other time points during and after the meal (p < 0.10) (figure 3A). In contrast, patients with AD dementia were not different than NCs in levels of ghrelin at any time point. Patients with bvFTD also had lower levels of the prophagic hormone cortisol before breakfast. After breakfast, cortisol levels in patients with bvFTD and those with AD dementia were not different from NCs except at +180 minutes when both groups showed higher cortisol values compared with levels in NCs (figure 3C). This finding is likely because patients began cognitive testing at +150 minutes after breakfast delivery. Cortisol levels are sensitive to cognitive demands. Overall, the hormonal pattern of low ghrelin and cortisol levels is consistent with a satiated state and should tend to decrease food intake.
Figure 3. Pre- and postprandial hormone levels.

Fasting and postprandial (breakfast eaten between 0 and 30 minutes) ghrelin, cortisol, insulin, and glucose levels in patients with bvFTD compared with patients with AD and healthy controls (graphs A, C, E, and G). Fasting and postprandial ghrelin, cortisol, insulin, and glucose levels in bvFTD overeaters compared with bvFTD nonovereaters, non-bvFTD overeaters, non-bvFTD nonovereaters, and healthy controls (graphs B, D, F, and H) (*p < 0.05; +p < 0.10). AD = Alzheimer disease; bvFTD = behavioral variant frontotemporal dementia; NC = normal control.
Anorectic hormone levels.
Meal intake was associated with an increase in levels of the anorectic hormone insulin and glucose in all groups, reaching a peak 30 minutes after the meal (figure 3, E–H). Patients with bvFTD had higher peak insulin levels (+30 and +60 minutes after breakfast) and lower peak glucose levels (+30 and +60 minutes after breakfast) compared with NCs. The increased insulin levels in bvFTD should tend to decrease food intake and may contribute to the observed decrease in glucose levels in patients with bvFTD. Patients with AD dementia had lower glucose levels at +60 and +90 minutes after breakfast. However, levels of PYY and leptin were not different between patients with bvFTD or AD dementia and NCs at either of the prebreakfast time points (figure 4, A and C).
Figure 4. Preprandial leptin and PYY.

Fasting leptin and PYY levels in patients with bvFTD compared with patients with AD and healthy controls (graphs A and C). Fasting leptin and PYY levels in bvFTD overeaters compared with bvFTD nonovereaters, non-bvFTD overeaters, non-bvFTD nonovereaters, and healthy controls (graphs B and D) (*p < 0.05; +p < 0.10). AD = Alzheimer disease; bvFTD = behavioral variant frontotemporal dementia; NC = normal control; PYY = peptide YY.
Overeaters vs nonovereaters.
Five patients with bvFTD and 2 patients with AD dementia consumed calories more than 2 SDs above the group mean and were thus classified as overeaters. The bvFTD overeaters, bvFTD nonovereaters, and non-bvFTD nonovereaters were not different from each other in age, BMI, waist-to-hip ratio, education, CDR scores, or percentage of breakfast calories consumed (table). However, bvFTD overeaters had worse behavioral and eating symptoms as indexed by higher NPI (F29,2 = 12.55, p < 0.001) and NPI eating subscale (F28,2 = 13.32, p < 0.001) scores than non-bvFTD nonovereaters. The bvFTD nonovereaters also showed higher NPI (F29,2 = 12.55, p < 0.001) and NPI eating subscale (F28,2 = 13.32, p < 0.001) scores, as well as lower MMSE scores (F30,2 = 3.71, p < 0.04) than non-bvFTD nonovereaters. NPI eating subscale scores did not differ between overeating and nonovereating patients with bvFTD.
Overeating and nonovereating patients with bvFTD also had similar levels of ghrelin, cortisol, insulin, and glucose (figure 3, B, D, F, and H). Specifically, both overeating and nonovereating patients with bvFTD had lower levels of the prophagic hormone ghrelin at baseline and nonsignificantly (p < 0.1) lower ghrelin levels during and after breakfast compared with NCs. Furthermore, both overeating and nonovereating patients with bvFTD had lower baseline cortisol levels, higher peak insulin, and lower peak glucose levels compared with NCs although the differences for overeating patients with bvFTD were only at trend levels. This pattern of hormonal changes is consistent with a satiated state and should decrease food intake. In contrast, levels of the anorectic hormone leptin were higher in overeating patients with bvFTD compared with NCs at both baseline time points, while leptin levels were not different between nonovereating patients with bvFTD and NCs (figure 4B). Non-bvFTD nonovereaters had ghrelin values similar to NCs across the entire session but lower glucose values at +30 minutes and +120 minutes. PYY levels in both overeating and nonovereating patients were similar to levels in NCs (figure 4D).
DISCUSSION
In the present study, patients with bvFTD had lower levels of ghrelin and cortisol and higher peak levels of insulin compared with NCs. Ghrelin and cortisol are well-documented prophagic hormones, while insulin is a satiety-promoting hormone that regulates glucose levels.3,12 Therefore, the hormonal pattern found in patients with bvFTD is consistent with a satiated state, which should decrease food intake, but nonetheless, patients with bvFTD commonly overeat. Our data, therefore, do not support the hypothesis that hormonal abnormalities promote overeating in bvFTD. Instead, it appears that the overeating that results from loss of brain-based inhibitory signals in bvFTD cannot be overridden by appropriate compensatory hormonal responses. Additionally, only patients with bvFTD who overate in the laboratory and therefore likely had particularly severe eating abnormalities had elevated levels of leptin, a hormone that functions to decrease feeding behavior and maintain energy homeostasis.13 Therefore, elevations in this hormone may be specifically related to severe overeating.
Ghrelin is a potent prophagic hormone synthesized in the gastric oxyntic mucosa3 that increases before meal initiation, decreases during meal consumption in association with decreasing hunger, and increases with food restriction in healthy individuals.7 In response to weight loss such as in anorexia; cancer cachexia; liver, heart, or kidney failure–related cachexia; and diet-induced weight loss, ghrelin levels increase,14–19 while in response to weight gain in obesity and forced feeding, ghrelin levels decrease and remain low during and between meals.20 Additionally, when weight normalizes in these disorders, ghrelin levels and dynamics also normalize.16 In our bvFTD patient group, ghrelin levels were low despite normal weight and frequent overeating. This pattern is similar to that seen in binge eating disorder (BED), a psychiatric disorder characterized by episodic out-of-control binge eating.21 Patients with BED have low levels of ghrelin before and during meals20–22 even compared with BMI-matched, non–binge eating controls.20 Patients with BED also have lower levels of cortisol23 and higher peak postprandial levels of the anorectic hormone insulin,20 similar to the pattern in bvFTD. It has been hypothesized that these hormonal abnormalities represent a compensatory response to compulsive overeating in BED,20,21 which may also be the case in bvFTD. However, both overeating and nonovereating patients with bvFTD showed identical changes in levels of ghrelin, cortisol, and insulin, which suggests that eating abnormalities may not be the sole drivers of these hormonal changes in bvFTD. However, our laboratory feeding paradigm likely underestimated real-world rates of overeating because more than 80% of patients with bvFTD develop feeding abnormalities during the course of their illness,2 and we found no differences in NPI eating subscores between overeating and nonovereating patients with bvFTD. Thus, the “overeating” patients with bvFTD in our study likely represent patients with particularly severe overeating abnormalities.
Only patients with bvFTD who overate in the laboratory had higher levels of leptin compared with NCs. Leptin is secreted from adipose tissue, decreases feeding behavior, and is a long-term marker for nutritional status.3 The only other study to quantify leptin levels in patients with bvFTD found that only female patients with an FTD-spectrum phenotype had elevated levels of leptin compared with sex-matched patients with AD dementia,24 and this effect was particularly pronounced for the FTD-spectrum females who also had eating disturbances. Although we did not find sex differences in our study, this may be attributable to the small number of women in our sample. Additionally, most studies report higher levels of leptin in patients with BED even controlling for BMI.25 Taken together with this previous research, our findings indicate that elevated leptin levels may be specifically associated with severe overeating in bvFTD.
Eating abnormalities are likely an instance of a more general pattern of behavioral disinhibition in bvFTD, which manifests as inappropriate social behavior, environmental dependency, and substance abuse.1,26 Previous work indicates that overeating patients with bvFTD have damage to a right-sided orbitofrontal-insular-striatal circuit1 and that patients with bvFTD develop pathologically enlarged ventral tegmental areas (VTAs) (a key dopaminergic center) compared with healthy controls, which is associated with greater severity of disinhibited eating and worse overall behavioral impairment.8 Previous work also indicates that patients with bvFTD have impaired top-down cognitive control circuitry that contributes to their behavioral disinhibition. Accumulating evidence demonstrates that peripheral hormones such as ghrelin, insulin, and cortisol normally function to regulate these same dopaminergic and top-down circuits.3–7 For example, ghrelin administration stimulates food reward–related brain areas including the VTA, striatum, amygdala, insula, and medial orbitofrontal cortex that are implicated in the hedonic aspects of feeding, and these activations correlate with ghrelin-induced subjective feelings of hunger.5 Similarly, higher cortisol levels have been associated with riskier decision making in a gambling paradigm,27 potentiate the desire to smoke,28 and inhibit the anterior cingulate cortex (ACC) and medial prefrontal cortex (PFC), important top-down cognitive control circuits.6,29 In contrast, intranasal administration of insulin inhibits the reward-related medial orbitofrontal cortex and stimulates the ACC and dorsolateral (dl)PFC, brain regions implicated in top-down cognitive control of eating.30 These neural regulatory effects of ghrelin, cortisol, and insulin are also supported by extensive nonhuman research.3,31–33 Thus, the hormonal shifts in bvFTD may occur to compensate for the reward circuit dysfunction (e.g., increased VTA size), decreased top-down cognitive control (e.g., prominent ACC and dlPFC atrophy in bvFTD), or associated disinhibited behaviors caused by bvFTD (figure 1). Whether or not these compensatory hormonal changes are in response to the more global disinhibition found in bvFTD, or specifically to feeding disinhibition similar to patients with BED, remains to be determined.
There are several limitations to this study. The study design, our relatively small sample sizes, and the interrelatedness of the hormones measured do not allow conclusive determination of causality or brain-behavior relationships.34–36 Also, extrapolations of these results to neuropathologic correlations are limited, because our patients met consensus clinical criteria for their diagnostic syndromes, but no further information was available about their underlying neuropathology. Patients who legitimately meet FTD consensus criteria for the bvFTD syndrome may have one of many underlying neuropathologies, including a variety of tauopathies, different variants of TDP-43 (transactive response DNA binding protein 43), FUS (fused in sarcoma), and AD.10 Additionally, while patients' eating behaviors were monitored in our controlled laboratory paradigm, patients' feeding habits may differ in their home environments. We used patients' caregivers as controls because they were demographically matched to our patients, but they may have hormonal abnormalities related to the chronic stress of caregiving. Moreover, our bvFTD group was predominantly male (16:3), while our control group was largely female. Both ghrelin and cortisol secretion are sexually dimorphic with higher levels in females.37,38 However, we controlled for sex in our analyses. Additionally, many of our patients were taking medications that affect hunger and weight (table), and these effects could not be adequately controlled for. Finally, contrary to previous studies,39 we found no differences in levels of ghrelin, cortisol, insulin, or leptin in patients with AD dementia compared with NCs. This may be because our patients with AD dementia were younger as they were age-matched to the patients with bvFTD.
In conclusion, we identified that patients with bvFTD, relative to healthy age-matched controls, have abnormally low levels of ghrelin and cortisol, and high levels of insulin, regardless of overeating behaviors, as measured through a laboratory-based feeding paradigm. In addition, only patients with bvFTD who overate had elevated leptin. These findings suggest that patients with bvFTD overeat despite their hormonal milieu. Further research is needed to explore the underlying mechanisms of this hormonal dysfunction.
ACKNOWLEDGMENT
The authors thank the patients and their families for their contributions to this research.
GLOSSARY
- ACC
anterior cingulate cortex
- AD
Alzheimer disease
- BED
binge eating disorder
- BMI
body mass index
- bvFTD
behavioral variant frontotemporal dementia
- CDR
Clinical Dementia Rating
- dlPFC
dorsolateral prefrontal cortex
- EDTA
ethylenediaminetetraacetic acid
- MMSE
Mini-Mental State Examination
- NC
normal control
- NPI
Neuropsychiatric Inventory
- PFC
prefrontal cortex
- PYY
peptide YY
- RIA
radioimmunoassay
- UCSF
University of California, San Francisco
- VTA
ventral tegmental area
AUTHOR CONTRIBUTIONS
Dr. Woolley contributed to study design, data collection, data analysis, manuscript preparation, and manuscript revision. Mr. Khan contributed to data collection, data analysis, manuscript preparation, and manuscript revision. Ms. Natesan contributed to data analysis, manuscript preparation, and manuscript revision. Ms. Karydas contributed to data analysis and manuscript revision. Dr. Dallman contributed to study design, data analysis, and manuscript revision. Dr. Havel contributed to data analysis and manuscript revision. Dr. Miller contributed to study design and manuscript revision. Dr. Rankin contributed to study design, data analysis, manuscript preparation, and manuscript revision.
STUDY FUNDING
National Institute on Aging (NIA) grants 5-P01 AG19724 and P50 AG023501; state of California, Alzheimer's Disease Research Center of California grant 03-7527; NIH grants R01AG038791 and R01AG031278; 2004 UCSF REAC grant (Rankin). This publication was supported by the National Center for Research Resources and the National Center for Advancing Translational Sciences, NIH, through UCSF-CTSI grant UL1 RR024131. Its contents are solely the responsibility of the authors and do not necessarily represent the official views of the NIH.
DISCLOSURE
J. Woolley, B. Khan, A. Natesan, A. Karydas, M. Dallman, and P. Havel report no disclosures. B. Miller serves as board member on the John Douglas French Alzheimer's Foundation and Larry L. Hillblom Foundation, serves as a consultant for TauRx, Allon Therapeutics, Siemens, BMS, the Tau Consortium, and the Consortium for Frontotemporal Research, has received institutional support from Novartis, and is funded by NIH grants P50AG023501, P01AG019724, and P50 AG1657303 and the state of California. K. Rankin is funded by NIH grants NIH/NIA 1R01AG029577, P50AG023501, P50 AG1657303, as well as the Larry L. Hillblom Foundation and the Tau Consortium. Go to Neurology.org for full disclosures.
REFERENCES
- 1.Woolley JD, Gorno-Tempini ML, Seeley WW, et al. Binge eating is associated with right orbitofrontal-insular-striatal atrophy in frontotemporal dementia. Neurology 2007;69:1424–1433 [DOI] [PubMed] [Google Scholar]
- 2.Piguet O, Hornberger M, Shelley BP, Kipps CM, Hodges JR. Sensitivity of current criteria for the diagnosis of behavioral variant frontotemporal dementia. Neurology 2009;72:732–737 [DOI] [PMC free article] [PubMed] [Google Scholar]
- 3.Figlewicz DP, Sipols AJ. Energy regulatory signals and food reward. Pharmacol Biochem Behav 2010;97:15–24 [DOI] [PMC free article] [PubMed] [Google Scholar]
- 4.Page KA, Seo D, Belfort-DeAguiar R, et al. Circulating glucose levels modulates neural control of desire for high-calorie foods in humans. J Clin Invest 2011;121:4161–4169 [DOI] [PMC free article] [PubMed] [Google Scholar]
- 5.Malik S, McGlone F, Bedrossian D, Dagher A. Ghrelin modulates brain activity in areas that control appetitive behavior. Cell Metab 2008;7:400–409 [DOI] [PubMed] [Google Scholar]
- 6.Ossewaarde L, Qin S, Van Marle HJ, Van Wingen GA, Fernández G, Hermans EJ. Stress-induced reduction in reward-related prefrontal cortex function. Neuroimage 2011;55:345–352 [DOI] [PubMed] [Google Scholar]
- 7.Schloegl H, Percik R, Horstmann A, Villringer A, Stumvoll M. Peptide hormones regulating appetite: focus on neuroimaging studies in humans. Diabetes Metab Res Rev 2011;27:104–112 [DOI] [PubMed] [Google Scholar]
- 8.Gennatas ED, Cholfin JA, Zhou J, et al. COMT Val158Met genotype influences neurodegeneration within dopamine-innervated brain structures. Neurology 2012;78:1663–1669 [DOI] [PMC free article] [PubMed] [Google Scholar]
- 9.Rosen HJ, Gorno-Tempini ML, Goldman WP, et al. Patterns of brain atrophy in frontotemporal dementia and semantic dementia. Neurology 2002;58:198–208 [DOI] [PubMed] [Google Scholar]
- 10.Rascovsky K, Hodges JR, Knopman D, et al. Sensitivity of revised diagnostic criteria for behavioral variant frontotemporal dementia. Brain 2011;134:2456–2477 [DOI] [PMC free article] [PubMed] [Google Scholar]
- 11.McKhann G, Drachman D, Folstein M, Katzman R, Price D, Stadlan EM. Clinical diagnosis of Alzheimer's disease: report of the NINCDS-ADRDA Work Group under the auspices of Department of Health and Human Services Task Force on Alzheimer's Disease. Neurology 1984;34:939–944 [DOI] [PubMed] [Google Scholar]
- 12.Levine MD, Marcus MD. Eating behavior following stress in women with and without bulimic symptoms. Ann Behav Med 1997;19:132–138 [DOI] [PubMed] [Google Scholar]
- 13.Morash B, Li A, Murphy PR, Wilkinson M, Ur E. Leptin gene expression in the brain and pituitary gland. Endocrinology 1999;140:5995–5998 [DOI] [PubMed] [Google Scholar]
- 14.Cummings DE, Weigle DS, Frayo RS, et al. Plasma ghrelin levels after diet induced weight loss or gastric bypass surgery. N Engl J Med 2002;346:1623–1630 [DOI] [PubMed] [Google Scholar]
- 15.Nagaya N, Uematsu M, Kojima M, et al. Elevated circulating level of ghrelin in cachexia associated with chronic heart failure: relationships between ghrelin and anabolic/catabolic factors. Circulation 2001;104:2034–2038 [DOI] [PubMed] [Google Scholar]
- 16.Otto B, Cuntz U, Fruehauf E, et al. Weight gain decreases elevated plasma ghrelin concentrations of patients with anorexia nervosa. Eur J Endocrinol 2001;145:669–673 [PubMed] [Google Scholar]
- 17.Shimizu Y, Nagaya N, Isobe T, et al. Increased plasma ghrelin levels in lung cancer cachexia. Clin Cancer Res 2003;9:774–778 [PubMed] [Google Scholar]
- 18.Tacke F, Brabant G, Kruck E, et al. Ghrelin in chronic liver disease. J Hepatol 2003;38:447–454 [DOI] [PubMed] [Google Scholar]
- 19.Yoshimoto A, Mori K, Sugawara A, et al. Plasma ghrelin and desacyl ghrelin concentrations in renal failure. J Am Soc Nephrol 2002;13:2748–2752 [DOI] [PubMed] [Google Scholar]
- 20.Geliebter A, Yahav EK, Gluck ME, Hashim SA. Gastric capacity, test meal intake, and appetitive hormones in binge eating disorder. Physiol Behav 2004;81:735–740 [DOI] [PubMed] [Google Scholar]
- 21.Geliebter A, Gluck ME, Hashim SA. Plasma ghrelin concentrations are lower in binge eating disorder. J Nutr 2005;135:1326–1330 [DOI] [PubMed] [Google Scholar]
- 22.Geliebter A, Hashim SA, Gluck ME. Appetite-related gut peptides, ghrelin, PYY and GLP-1 in obese women with and without binge eating disorder (BED). Physiol Behav 2008;94:696–699 [DOI] [PMC free article] [PubMed] [Google Scholar]
- 23.Larsen JK, van Ramshorst B, van Doornen LJ, Geenen R. Salivary cortisol and binge eating disorder in obese women after surgery for morbid obesity. Int J Behav Med 2009;16:311–315 [DOI] [PMC free article] [PubMed] [Google Scholar]
- 24.Alberici A, Bocchio L, Geroldi C, et al. Serum leptin levels are higher in females affected by frontotemporal lobar degeneration than Alzheimer's disease. J Neurol Neurosurg Psychiatry 2008;79:712–715 [DOI] [PubMed] [Google Scholar]
- 25.Adami GF, Campostano A, Cella F, Scopinaro N. Serum leptin concentration in obese patients with binge eating disorder. Int J Obes Relat Metab Disord 2002;26:1125–1128 [DOI] [PubMed] [Google Scholar]
- 26.Weder ND, Aziz R, Wilkins K, Tampi RR. Frontotemporal dementias: a review. Ann Gen Psychiatry 2007;6:1–10 [DOI] [PMC free article] [PubMed] [Google Scholar]
- 27.Putman P, Antypa N, Crysovergi P, van der Does WA. Exogenous cortisol acutely influences motivated decision making in healthy young men. Psychopharmacology 2010;208:257–263 [DOI] [PMC free article] [PubMed] [Google Scholar]
- 28.McKee SA, Sinha R, Weinberger AH, et al. Stress decreases the ability to resist smoking and potentiates smoking intensity and reward. J Psychopharmacol 2011;25:490–502 [DOI] [PMC free article] [PubMed] [Google Scholar]
- 29.Veer IM, Oei NY, Spinhoven P, van Buchem MA, Elzinga BM, Rombouts SA. Endogenous cortisol is associated with functional connectivity between the amygdala and medial prefrontal cortex. Psychoneuroendocrinology 2012;37:1039–1047 [DOI] [PubMed] [Google Scholar]
- 30.Kullmann S, Frank S, Heni M, et al. Intranasal insulin modulates intrinsic reward and prefrontal circuitry of the human brain in lean women. Neuroendocrinology 2013;97:176–182 [DOI] [PubMed] [Google Scholar]
- 31.Davis JF, Choi DL, Benoit SC. Insulin, leptin and reward. Trends Endocrinol Metab 2010;21:68–74 [DOI] [PMC free article] [PubMed] [Google Scholar]
- 32.Marinelli M, Piazza PV. Interaction between glucocorticoid hormones, stress and psychostimulant drugs. Eur J Neurosci 2002;16:387–394 [DOI] [PubMed] [Google Scholar]
- 33.Skibicka KP, Dickson SL. Ghrelin and food reward: the story of potential underlying substrates. Peptides 2011;32:2265–2273 [DOI] [PubMed] [Google Scholar]
- 34.Arvat E, Maccario M, Di Vito L, et al. Endocrine activities of ghrelin, a natural growth hormone secretagogue (GHS), in humans: comparison and interactions with hexarelin, a nonnatural peptidyl GHS, and GH-releasing hormone. J Clin Endocrinol Metab 2001;86:1169–1174 [DOI] [PubMed] [Google Scholar]
- 35.Lambillotte C, Gilon P, Henquin JC. Direct glucocorticoid inhibition of insulin secretion: an in vitro study of dexamethasone effects in mouse islets. J Clin Invest 1997;99:414–423 [DOI] [PMC free article] [PubMed] [Google Scholar]
- 36.Reimer MK, Pacini G, Ahrén B. Dose-dependent inhibition by ghrelin of insulin secretion in the mouse. Endocrinology 2003;144:916–921 [DOI] [PubMed] [Google Scholar]
- 37.Barkan AL, Dimaraki EV, Jessup SK, Symons KV, Ermolenko M, Jaffe CA. Ghrelin secretion in humans is sexually dimorphic, suppressed by somatostatin, and not affected by the ambient growth hormone levels. J Clin Endocrinol Metab 2003;88:2180–2184 [DOI] [PubMed] [Google Scholar]
- 38.Toogood AA, Taylor NF, Shalet SM, Monson JP. Sexual dimorphism of cortisol metabolism is maintained in elderly subjects and is not oestrogen dependent. Clin Endocrinol 2000;52:61–66 [DOI] [PubMed] [Google Scholar]
- 39.Martins I, Gomes S, Costa RO, et al. Leptin and ghrelin prevent hippocampal dysfunction induced by AB oligomers. Neuroscience 2013;241:41–51 [DOI] [PubMed] [Google Scholar]