

Abstract
Objective:
To obtain quantitative neurometabolite measurements, specifically myoinositol (mI) and glutamate plus glutamine (Glx), markers of glial and neuronal excitation, in deep gray matter structures after mild traumatic brain injury (mTBI) using proton magnetic resonance spectroscopy (1H-MRS) and to compare these measurements against normal healthy control subjects.
Methods:
This study approved by the institutional review board is Health Insurance Portability and Accountability Act compliant. T1-weighted MRI and multi-voxel 1H-MRS imaging were acquired at 3 tesla from 26 patients with mTBI an average of 22 days postinjury and from 13 age-matched healthy controls. Two-way analysis of variance was used to compare patients and controls for mean N-acetylaspartate, choline, creatine (Cr), Glx, and mI levels as well as the respective ratios to Cr within the caudate, globus pallidus, putamen, and thalamus.
Results:
Quantitative putaminal mI was higher in patients with mTBI compared with controls (p = 0.02). Quantitative neurometabolite ratios of putaminal mI and Glx relative to Cr, mI/Cr, and Glx/Cr were also higher among patients with mTBI compared with controls (p = 0.01 and 0.02, respectively). No other differences in neurometabolite levels or ratios were observed in any other brain region evaluated.
Conclusion:
Increased putaminal mI, mI/Cr, and Glx/Cr in patients after mTBI compared with control subjects supports the notion of a complex glial and excitatory response to injury without concomitant neuronal loss, evidenced by preserved N-acetylaspartate levels in this region.
Traumatic brain injury (TBI) is a major cause of morbidity and mortality, with a US annual incidence of approximately 1.7 million.1 Mild TBI (mTBI) accounts for 75% of these injuries.1 Although focal injuries occur frequently after moderate and severe head injury, conventional imaging evaluation of the brain after mTBI detects abnormalities in only a small minority of patients.2 Nevertheless, cognitive, neurologic, and psychological problems persist in 10% to 55%,3 suggesting that mTBI may have greater consequences than formerly assumed.4 Previous studies have documented deep gray matter injury, believed to contribute to complex neurocognitive and psychological dysfunction after injury.5,6 The thalami and the nuclei of the basal ganglia form a series of centrally located relay stations for information transmitted throughout the brain and to the brainstem and spinal cord and, as such, participate in critical communication among sensory, motor, and associative areas.7 Primary or secondary injury to these structures after brain trauma would be expected to result in widespread functional impairments, such as those observed in postconcussive syndrome.
There is current thinking that secondary inflammation and neuronal excitation have a role in the pathophysiology of ongoing injury.8,9 Prior proton magnetic resonance spectroscopic (1H-MRS) studies show increased myoinositol (mI) in patients with moderate and severe head injuries, which has been attributed to astrocytosis, known to occur after TBI.10,11 Glutamate, the primary excitatory neurotransmitter in the CNS, has also been implicated in post-TBI excitotoxicity using animal models as well as in human subjects12–16 and is associated with unfavorable long-term outcome.12,16 The precise role inflammation and excitotoxicity have in the pathophysiology after mTBI is not clear.
The purpose of this study was to measure quantitative mI and glutamate plus glutamine (Glx) in deep gray matter structures in patients with mTBI using 1H-MRS imaging and to compare these measurements with normal healthy controls.
METHODS
Standard protocol approvals, registrations, and patient consents.
The study was approved by the institutional ethics committee and was in accordance with the ethical standards of the 1964 Declaration of Helsinki, and all participants gave written informed consent.
Human subjects.
Twenty-six patients with documented mTBI17 (5 women and 21 men, aged 33 ± 10.9 years) were prospectively recruited. Twenty-five subjects were enrolled after emergency room visits and one was referred from a physician's office. In this latter patient, mTBI diagnosis was based on clinical evaluation and 30 minutes’ loss of consciousness. Inclusion criteria applied to all patients were as follows: mTBI as defined by the American Congress of Rehabilitation Medicine, namely, closed head injury with either posttraumatic amnesia of less than 24 hours or loss of consciousness of 30 minutes or less with Glasgow Coma Scale (GCS) score between 13 and 15. Exclusion criteria included history of substance abuse, previous TBI, HIV, or neurologic or psychological disease. Of note, we have previously reported global concentrations of N-acetylaspartate (NAA), choline (Cho), and creatine (Cr) in this patient cohort.18,19
Thirteen healthy controls matched for sex, age, and handedness were also studied (5 women and 8 men, aged 33 ± 11.6 years). Exclusion criteria used for controls were the same as for the patients. In addition, control subjects were also excluded if there were any abnormal MRI findings on conventional imaging.
MRI data acquisition.
All scans were performed using a 3-tesla MR scanner (TIM Trio; Siemens AG, Erlangen, Germany) using a TEM3000 (MR Instruments, Minneapolis, MN) transmit-receive head coil. After placing subjects head-first supine into the magnet, a localizer was acquired to ensure the head's correct position in the coil. We then acquired axial T2-weighted fluid-attenuated inversion recovery (FLAIR) images: echo time (TE)/inversion time/repetition time (TR) = 88/2,500/9,000 milliseconds, 256 × 256 mm2 field of view (FOV), 512 × 512 matrix, and 30 slices 3.7 mm thick each. This was followed by sagittal 3-dimensional magnetization-prepared rapid-acquisition gradient echo (MP-RAGE): TE/inversion time/TR = 2.6/800/1,360 milliseconds, 256 × 256 × 160 mm3 FOV, and 256 × 256 × 160 matrix, tilted to parallel the corpus callosum's genu–splenium line and reformatted at 1 mm3 isotropic pixels in axial, sagittal, and coronal orientations.
Our 3-dimensional chemical-shift imaging–based procedure then adjusted the scanner's second-order shims automatically in less than 3 minutes.20 Next, a 10-cm anterior-posterior × 8-cm left-right × 4.5-cm inferior-superior (IS) = 360 cm3 1H-MRS imaging volume of interest (VOI) was image-guided over the corpus callosum, as shown in figure 1, A and B. The VOI was excited with TE/TR = 35/1,800 millisecond PRESS in three 1.5-cm-thick, second-order Hadamard-encoded slabs (6 slices) interleaved in every TR in the IS direction, as described elsewhere.19 The purpose of this is to optimize the signal-to-noise ratio and the spatial coverage, and allow the application of strong, 6 mT/m, Hadamard slice selection gradients.21 The latter limits the interslice chemical shift displacement (1.5 ppm between NAA and mI) to less than 8% of the slice’s thickness.22 The 6 slices were partitioned with 2-dimensional 16 × 16 chemical-shift imaging over a 16 × 16 cm2 FOV to yield 0.75 cm3 nominal voxels, as shown in figure 1. The 1H-MRS signal was acquired for 256 milliseconds at ±1 kHz bandwidth and at 2 averages took 34 minutes. The entire protocol time was less than an hour.
Figure 1. 1H-MRS technique.

Sagittal (A) and axial (B) T1-weighted MP-RAGE MRI of a subject, demonstrating 8 × 10 × 4.5 cm3 VOI, 16 × 16 × 4.5 cm3 FOV (thick and dashed white frames), and 3 second-order, 1.5-cm-thick Hadamard slabs yielding 6 1H-MRS slices 0.75 cm thick every TR. The arrow on A indicates the spatial position of B. (C) Real part of the 8 × 10 1H spectra matrix from the VOI on B, all on common 1.8 to 4.0 ppm and intensity scales. Note the signal-to-noise ratio and spectral resolution from the 0.75 cm3 voxels and the quality of the spectral fit. Cho = choline; Cr = creatine; CSI = chemical-shift imaging; FOV = field of view; Glx = glutamate plus glutamine; 1H-MRS = proton magnetic resonance spectroscopy; mI = myoinositol; MP-RAGE = magnetization-prepared rapid-acquisition gradient echo; NAA = N-acetylaspartate; TR = repetition time; VOI = volume of interest.
MRS postprocessing.
The 1H-MRS data were voxel-shifted to align the NAA grid with the VOI, then Fourier transformed in the time, anterior-posterior, and left-right dimensions, and Hadamard reconstructed along the IS direction, using in-house software (Research Systems Inc., Boulder, CO). Each of the 480 spectra in the VOI was frequency-aligned and zero-order phase corrected, as shown in figure 1C. Relative levels of the i = NAA, Cr, Cho, mI, metabolite in the j = 1 … 480 voxel of the k = 1 … 39 subject were obtained from their peak area, Sijk, using SITools-FITT parametric spectral modeling software of Soher et al.23 They were then scaled into absolute millimolar concentrations, Cijk, relative to a 2-L sphere of Cvitro = 12.5, 10.0, 3.0, and 7.5 mM NAA, Cr, Cho, and mI in water at physiologic ionic strength to load the coil as:
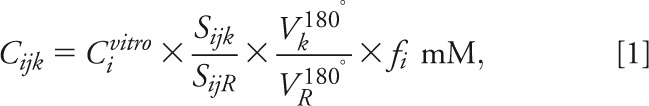 |
where SijR is the signal of the sphere's voxels' metabolites, Vj180°, VR180° the radiofrequency voltage for a nonselective, 1-millisecond, 180° inversion pulse on the k-th subject, sphere and fi a correction for in vivo (T1vivo, T2vivo) and phantom (T1vitro, T2vitro) relaxation times differences for metabolite − i:
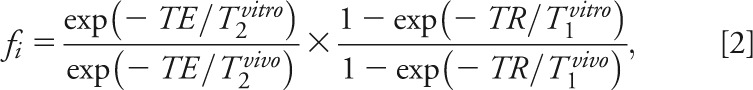 |
using structure- and age-specific 3T T2vivo values for NAA, Cr, and Cho,24 mI T2vivo of 200 milliseconds,25,26 and T1vivo = 1,360, 1,300, 1,145, and 1,170 milliseconds for NAA, Cr, Cho, and mI, respectively.25,27 The corresponding values in the phantom were T2vitro = 483, 288, 200, and 233 milliseconds and T1vitro = 605, 336, 235, and 280 milliseconds. Because our phantom did not contain Glx, we used the in vivo NAA signal as “the reference” in Eqs. [1] and [2].
The caudate nucleus, globus pallidus, putamen, and thalamus were examined in every subject using region-of-interest (ROI) analysis with regions outlined manually on axial MRIs (figure 2). We then used in-house software, zero-filled the MRS matrix to 256 × 256, and averaged metabolic concentrations in all voxels falling entirely or partially within the outline.28 Note that some metabolites in a spectrum may be of lower signals, especially at the edges of the VOI, because of chemical shift displacement, whereas some of the anterior spectra are globally of lower signals because of magnetic field susceptibility in the frontal lobe, due to the air-filled sinuses underneath, as shown in figure 1. Consequently, individual metabolites for which the voxel's Cramér-Rao lower bounds were <20% were automatically identified as “poor quality” and excluded from the regional analyses.
Figure 2. 1H-MRS ROI analysis.
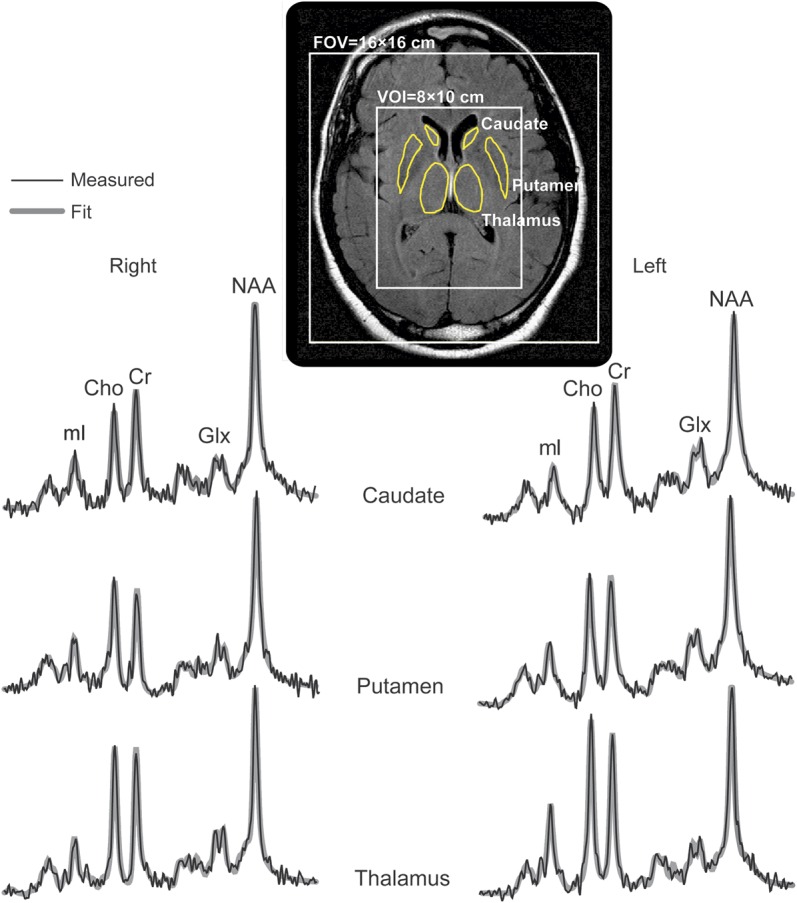
Top: Axial slice showing the MRS FOV and VOI and the manually traced bilateral head of the caudate, putamen, and thalamus (yellow outlines). Bottom: Average spectra from all voxels that are contained in each of the respective outlined structures (thin black lines) overlaid with their SITools-FITT parametric spectral modeling (thick gray lines), all on common 1.8 to 4.0 ppm and intensity scales. Note the improved spectral signal-to-noise ratio (compare with the single voxels in figure 1) that is proportional to the structure's volume, and the quality of the spectral fits for each structure. Cho = choline; Cr = creatine; FOV = field of view; Glx = glutamate plus glutamine; 1H-MRS = proton magnetic resonance spectroscopy; mI = myoinositol; NAA = N-acetylaspartate; VOI = volume of interest.
Statistical analysis.
Analysis of covariance (ANCOVA) was used to compare patients with controls for the mean level of each metabolite (NAA, Cho, Cr, Glx, and mI) and the mean of each ratio (NAA/Cr, Cho/Cr, Glx/Cr, and mI/Cr) within each region evaluated, adjusting for age and sex. A separate ANCOVA was conducted for each metabolite and each ratio. In each case, the imaging measure was the dependent variable and the model included age and sex as covariates and subject group as a classification factor. The normality assumptions underlying the parametric analyses were found through residual plots and Shapiro-Wilk tests. In the deep gray matter structures demonstrating significant differences in neurometabolites between patients with mTBI and controls, a separate ANCOVA was used to compare neurometabolites between the right and left structures. Student t test was used to assess age differences between patients and controls who passed the spectral quality control, and between GCS scores of excluded and nonexcluded patients. Note that the latter test could not be conducted for the thalamus because only 2 patients were excluded. All reported p values are 2-sided and indicate a significant difference if p < 0.05. SAS version 9.3 statistical software (SAS Institute, Cary, NC) was used for all computations.
RESULTS
Subjects were studied at a mean time interval between trauma and MRI of 21 days (range: 3–55) and had an average GCS score of 14.7. Four patients with mTBI had MRI findings on conventional MP-RAGE and FLAIR imaging as follows: 2 patients had arachnoid cysts and 2 had scattered, nonspecific white matter subcortical T2 hyperintensities, believed unlikely to be related to trauma.
ROIs demonstrating noisy spectral quality excluded from analysis included 2 thalamic, 9 caudate, 6 putamen, and 9 globus pallidus ROIs, leaving 24, 17, 20, and 17 regions in patients with mTBI for each regional analysis, respectively. For controls, 2 caudate, 2 putamen, and 3 globus pallidus ROIs were excluded, leaving 11, 11, and 10 samples for these structures. For each structure, there were no statistically significant age differences between the patients and controls whose data were used in the statistical analyses (e.g., putamen: patients' age [average ± SD] 35 ± 11 years, vs controls: 32 ± 10 years, p = 0.6). In addition, for each structure, there were no statistically significant differences between the GCS scores of the excluded and nonexcluded patients (e.g., putamen: excluded patients' GCS score 14.8 ± 0.4, vs nonexcluded patients' score 14.7 ± 0.6, p = 0.6).
Evaluation of quantitative neurometabolite measurements in the deep gray matter structures studied showed elevated mI in the putamen in patients with mTBI compared with controls (p = 0.02). Additional evaluation of metabolite ratios also showed higher putaminal mI/Cr and Glx/Cr in patients compared with controls (p = 0.01 and 0.02, respectively). No other differences in neurometabolites or metabolite ratios were seen in all the regions studied. The findings are summarized in tables 1 and 2 and plotted in figure 3. There was no mI, mI/Cr, Glx, Glx/Cr, and Cr difference between the patients' right and left putamina or thalamus.
Table 1.
Mean concentrations of neurometabolites (in mM) and SDs within the deep gray matter structures for each subject group, and statistical difference between groups
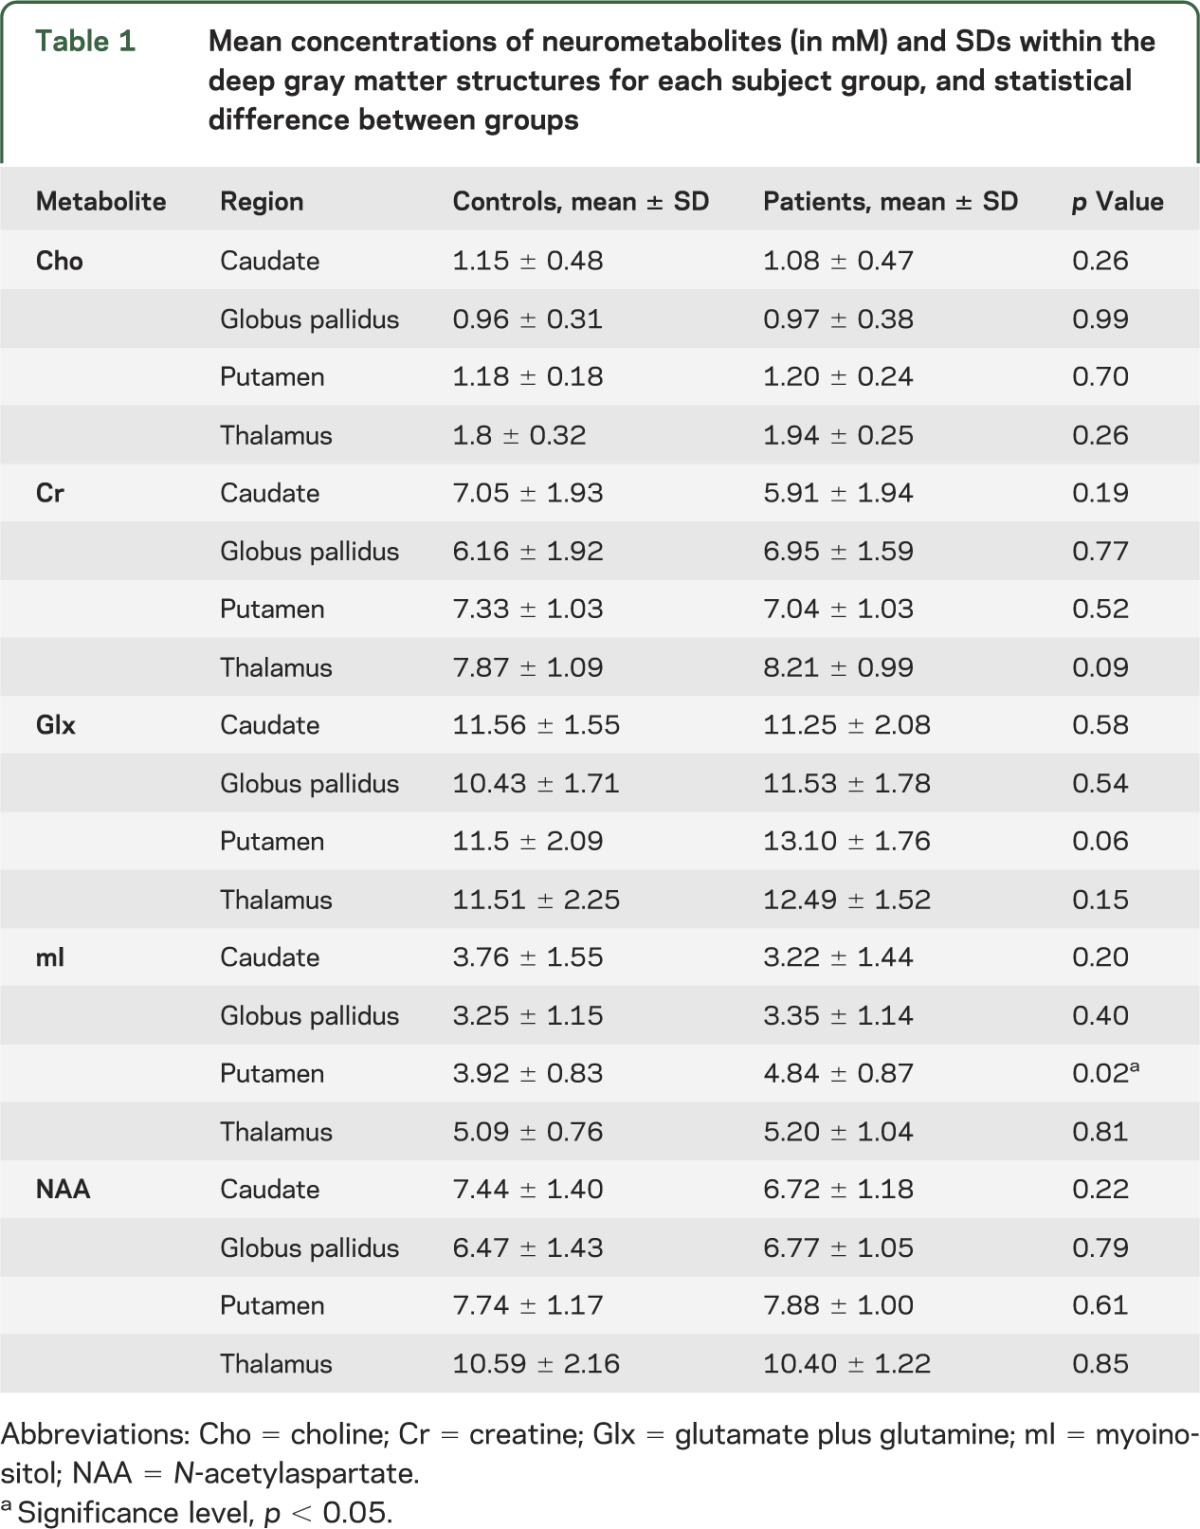
Table 2.
Mean ratios of neurometabolite concentrations and SDs within the deep gray matter structures for each subject group, and statistical difference between groups
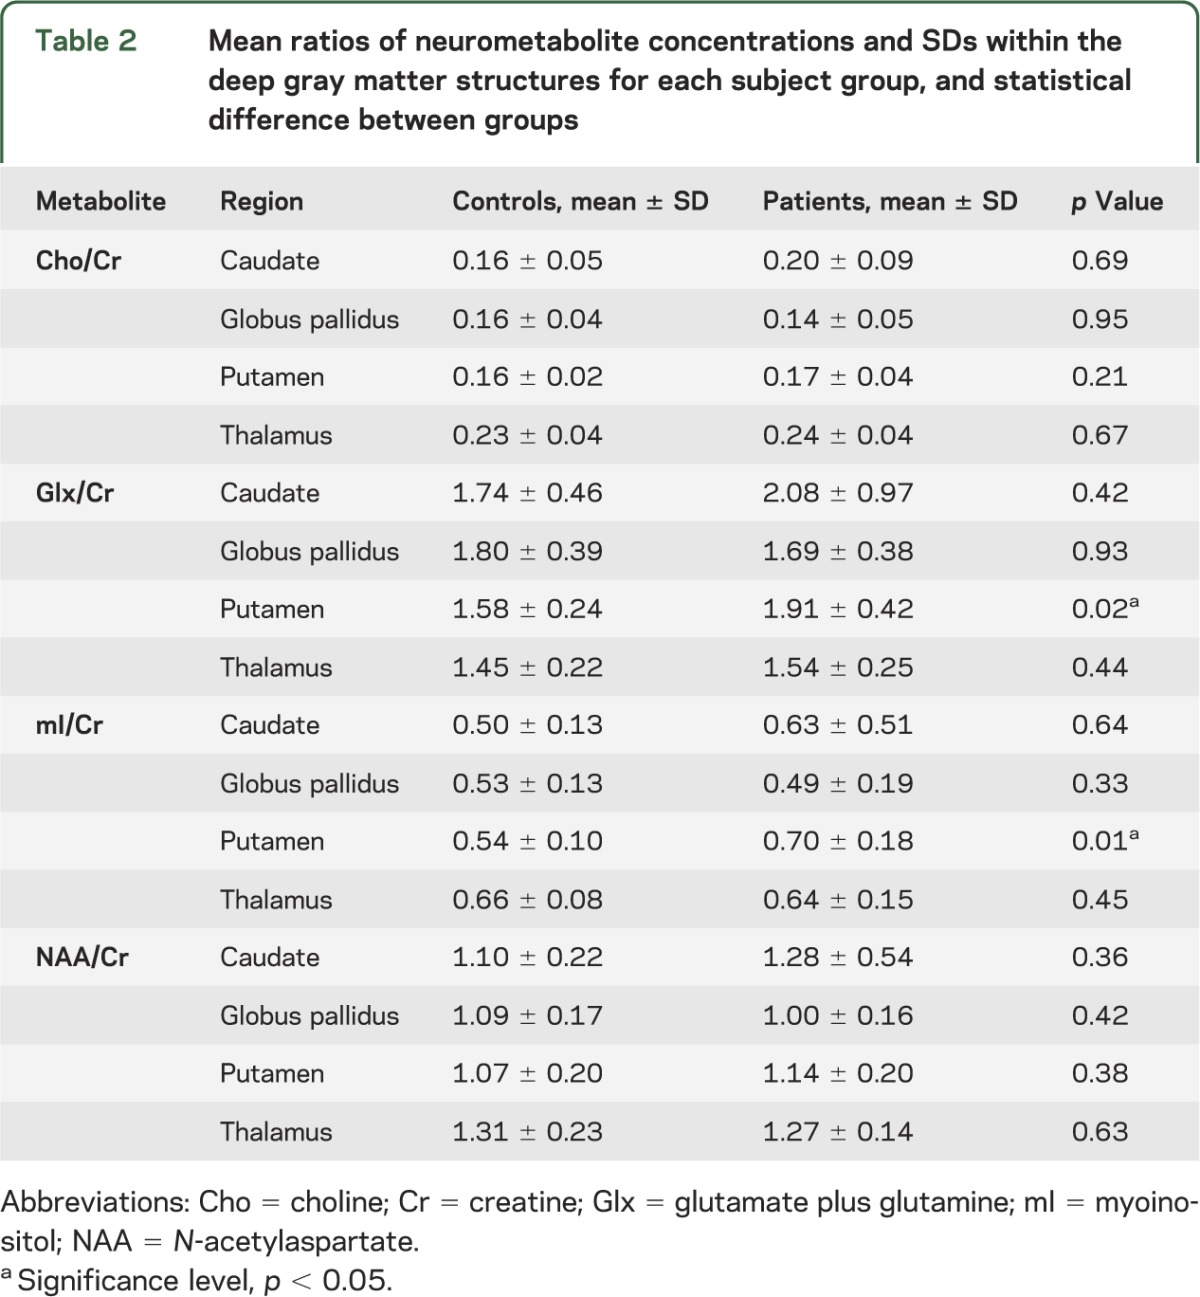
Figure 3. Myoinositol and Glx levels in the putamen of patients with mTBI compared with controls.
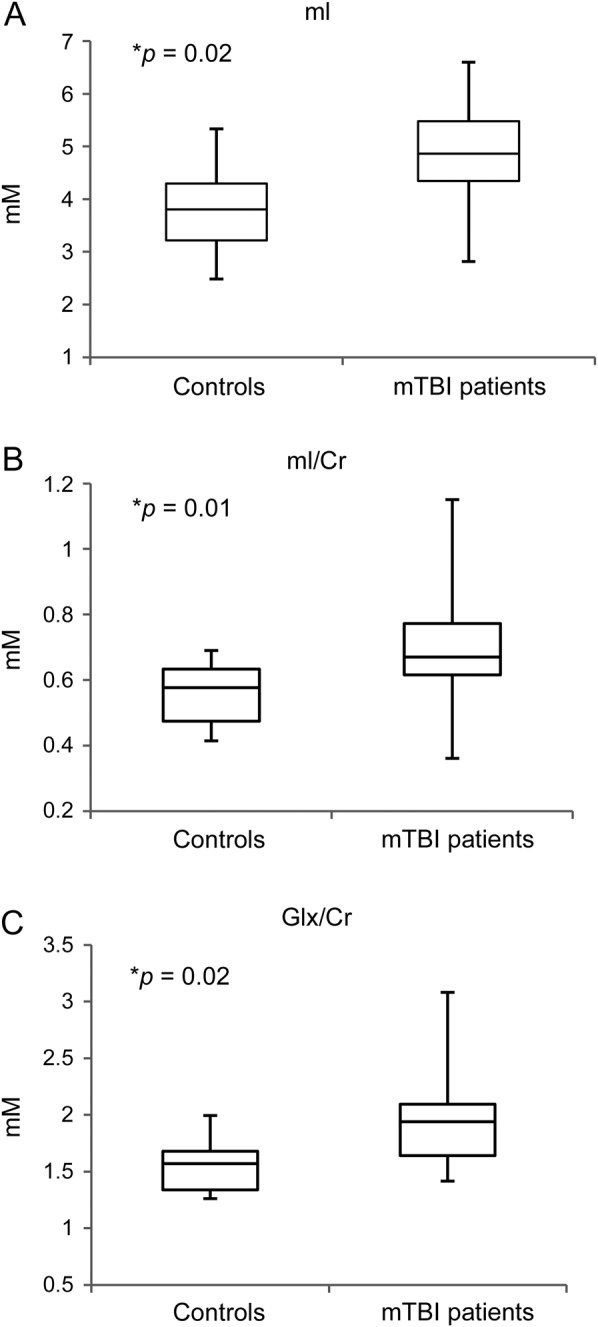
Box plots displaying 25%, median, 75% (box), and 95% (whiskers) range of the variation of the levels of absolute putamen mI (A) and mI/Cr (B) (p = 0.02 and 0.01, respectively) and Glx/Cr (C) (p = 0.02). Significance level of p < 0.05 is indicated by the asterisk. Cr = creatine; Glx = glutamate plus glutamine; mI = myoinositol; mTBI = mild traumatic brain injury.
DISCUSSION
Our findings show higher putaminal mI, mI/Cr, and Glx/Cr in patients with mTBI compared with controls in the subacute phase after injury. These results point toward a unique mechanism of injury in the putamen after mTBI that involves perturbations of mI and Glx without NAA abnormalities to suggest frank neuronal injury. Our findings support prior evidence that the deep gray matter structures are implicated in the pathogenesis of mTBI5,6 and that there are inflammatory and excitatory cascades that may occur after injury.8–10
Myoinositol is an osmolyte primarily located in astrocytes and microglia glial cells.9,10 The mI spectroscopic signal is specific for mI, without inclusion of additional inositol stereoisomers or derivatives.11 Increased mI levels are observed using 1H-MRS in both subacute to chronic stages after experimental closed head injury in rats as well as after moderate and severe human head injury.8–10,29 Reactive astrocytosis and microgliosis with increased glial content and proliferation are the proposed mechanisms resulting in mI abnormalities after TBI.9,10 It should be noted that increased mI is not specific and can also be seen in conditions such as Down syndrome, increased myelin breakdown, and hypertonic stress.30
Glutamate, the primary CNS excitatory neurotransmitter,13–16 and glutamine, an amino acid metabolically coupled to glutamate at synapses16 are measured in vivo using 1H-MRS as overlapping resonances at 2.4 ppm, termed the glutamate plus glutamine complex or Glx.16 Glutamate is taken up in the synaptic cleft by astrocytes and converted to glutamine, which is then shuttled back to the presynaptic neuron and converted to glumate.13 Elevated extracellular glutamate has been demonstrated using invasive microdialysis methods in rat fluid percussion models of TBI as well as in human subjects after mild and severe head injury.13–16,31–33 Two independent MRS studies showed elevated Glx in adult31 and pediatric16 subjects with severe TBI and is associated with poor long-term outcome. However, interpretation of Glx results may be complicated by the fact that Glx reflects the sum of glutamate and glutamine, neurometabolites linked by the glutamate cycle.13 It has been proposed in previous studies that diverting glutamate production to alternative pathways and/or diversion of glutamate from dendritic regions may occur to avoid excitotoxicity or for protective or repair purposes after mTBI.13,14 It is possible that such an adaptive mechanism occurs in the putamen after mTBI.
Of interest, increased mI after TBI has been previously associated with increased Glx.10 A prior study demonstrated increased mI with a concomitant increase in Glx in occipital cortex and parietal white matter as well as a correlation between the 2 in a pediatric severe head injury cohort.10 Activation of microglia occurs as an inflammatory reaction and is known to modulate excitatory neurotransmission by recruiting astrocytes, which then amplify release of glutamate.34 Our finding of increased putaminal measurements of mI and Glx may represent a combination of metabolic processes occurring after mTBI correlating to secondary injury cascades including astrocytosis, microgliosis, and neuronal excitation.33,34
Microglial activation has been previously documented in the putamen after TBI using PET in patients with TBI encompassing a range of injury severities.35 Why there is specific involvement of the putamen is, however, unclear.
The putamen and caudate nucleus together form the neostriatum, which receives a massive number of projections from the entire cerebral cortex, almost all of which are excitatory and glutamate-mediated,36 and contains dense connections to the prefrontal cortex, an area known to be susceptible to traumatic injury.36 Furthermore, the putamen has historically been thought of as a key structure involved in motor control, but has recently been shown to be involved in cognitive and emotional functions.37 The dorsal amygdala, also known as the extended amygdala, spans the basal forebrain and projects densely to the ventral striatum.38 The extended amygdala has been found to be involved in emotional control, and is activated with changes in emotional intensity of sensory stimuli.38 It is plausible that mTBI-induced disruption of the basal ganglia, specifically the putamen, may cause failure of such critical circuits that participate in working memory, cognitive control, category learning, and emotional control, findings often deficit in early postconcussive syndrome.2
We studied absolute metabolite values as well as relative metabolite ratios to Cr to determine whether results could be reproduced across the 2 methods as well as to assess which metric might be more sensitive. The Cr spectroscopic signal reflects concentrations of both Cr and phosphocreatine, and the combined Cr-phosphocreatine signal is often assumed to be constant.13,14 This assumption has been called into question with some studies showing increased Cr in temporal lobe gray and white matter29 and supraventricular white matter13,14 in patients with mTBI. This is believed to be attributable to upregulation of Cr, which supports more high-energy phosphates including adenosine triphosphate that help restore trauma-induced ionic imbalances.13,14 In this study, the evaluation of metabolic ratios relative to Cr resulted in a greater degree of significance within the putamen than analysis of absolute metabolite concentrations. Given the lack of difference in putaminal Cr between subject groups, this may reflect decreased variance of the ratio measurement relative to the signal-normalized individual metabolite values in this region and is believed to less likely result from putaminal Cr alterations. Again, the trend toward increased thalamic Cr in patients with mTBI was not found to be significant.
Our findings within deep gray matter structures regarding NAA corroborate with our previous published results in which whole VOI analysis showed global gray matter NAA to be stable after mTBI.18,19 The findings also agree with prior evidence showing that regional gray matter NAA, including thalamic NAA, is not decreased in patients after mTBI.39 NAA reflects measures of neuronal integrity and metabolism.13,14 We therefore hypothesize that the effects of mTBI on the putamen involve complex secondary signaling changes and inflammation resulting in perturbations of mI and Glx and do not necessarily relate to frank neuronal injury. It is unlikely that our findings are related to posttraumatic edema because there was no FLAIR-signal abnormality in the putamen of any of the patients with mTBI. Secondary injury after mTBI is particularly important to further understand because these abnormalities may potentially direct unique medical intervention.
Our study limitations include operator dependence, inherent to ROI analysis. Small ROIs such as the ones used here decrease power to detect small differences. Because of noisy spectral quality, probably due to worse local shim, small size of the structures evaluated, and CSF partial volume averaging, we had to exclude some regions, introducing selection bias. However, the smallest number of regions examined in the patient cohort was nevertheless 17. Overall, the subject sample size is relatively small; however, we adhered to strict inclusion and exclusion criteria to achieve a useful and specific study cohort. Future work includes temporally following these subjects to examine longitudinal alterations over time and correlating with neurocognitive testing to determine their predictive value.
In summary, patients with mTBI demonstrate significantly increased mI, mI/Cr, and Glx/Cr in the putamen approximately 1 month after injury compared with normal control subjects. This supports the concept that there is a complex glial and excitatory response without concomitant neuronal injury as evidenced by preserved NAA levels.
GLOSSARY
- ANCOVA
analysis of covariance
- Cho
choline
- Cr
creatine
- FLAIR
fluid-attenuated inversion recovery
- FOV
field of view
- GCS
Glasgow Coma Scale
- Glx
glutamate plus glutamine
- 1H-MRS
proton magnetic resonance spectroscopy
- IS
inferior-superior
- mI
myoinositol
- MP-RAGE
magnetization-prepared rapid-acquisition gradient echo
- mTBI
mild traumatic brain injury
- NAA
N-acetylaspartate
- ROI
region of interest
- TBI
traumatic brain injury
- TE
echo time
- TR
repetition time
- VOI
volume of interest
AUTHOR CONTRIBUTIONS
Andrea S. Kierans: drafting/revising the manuscript for content, including medical writing for content, and analysis or interpretation of data. Ivan I. Kirov: drafting/revising manuscript for content, including medical writing for content, analysis or interpretation of data, acquisition of data. Oded Gonen: drafting/revising manuscript for content, including medical writing for content, analysis or interpretation of data, study concept or design. Gillian Haemer and Eric Nisenbaum: analysis or interpretation of data. James S. Babb: revising of manuscript, statistical analysis. Robert I. Grossman: study concept or design. Yvonne W. Lui: drafting/revising the manuscript for content, including medical writing for content, analysis or interpretation of data, study concept or design.
STUDY FUNDING
Supported in part by the following federal grants from the NIH: 1UL1RR029893, RO1 NS039135, EB01015, and RO1 NS050520.
DISCLOSURE
The authors report no disclosures relevant to the manuscript. Go to Neurology.org for full disclosures.
REFERENCES
- 1.Faul M, Xu L, Wald MM, Coronado VG. Traumatic Brain Injury in the United States: Emergency Department Visits, Hospitalizations and Deaths 2002–2006. Atlanta: Centers for Disease Control and Prevention, National Center for Injury Prevention and Control; 2010 [Google Scholar]
- 2.Smits M, Hunink MG, Van Rijssel DA, et al. Outcome after complicated minor head injury. AJNR Am J Neuroradiol 2008;29:506–513 [DOI] [PMC free article] [PubMed] [Google Scholar]
- 3.Kraus JF, McArthur DL. Epidemiologic aspects of brain injury. Neurol Clin 1996;14:435–450 [DOI] [PubMed] [Google Scholar]
- 4.McAllister TW. Neuropsychiatric sequelae of head injuries. Psychiatr Clin North Am 1992;15:395–413 [PubMed] [Google Scholar]
- 5.García-Panach J, Lull N, Lull JJ, et al. A voxel-based analysis of FDG-PET in traumatic brain injury: regional metabolism and relationship between the thalamus and cortical areas. J Neurotrauma 2011;28:1707–1717 [DOI] [PubMed] [Google Scholar]
- 6.Ge Y, Patel MB, Chen Q, et al. Assessment of thalamic perfusion in patients with mild traumatic brain injury by true FISP arterial spin labelling MR imaging at 3T. Brain Inj 2009;23:666–674 [DOI] [PMC free article] [PubMed] [Google Scholar]
- 7.Haber SN, Calzavara R. The cortico-basal ganglia integrative network: the role of the thalamus. Brain Res Bull 2009;78:69–74 [DOI] [PMC free article] [PubMed] [Google Scholar]
- 8.Nagamoto-Combs K, McNeal DW, Morecraft RJ, et al. Prolonged microgliosis in the rhesus monkey central nervous system after traumatic brain injury. J Neurotrauma 2007;24:1719–1742 [DOI] [PubMed] [Google Scholar]
- 9.McGraw J, Hiebert GW, Steeves JD. Modulating astrogliosis after neurotrauma. J Neurosci Res 2001;63:109–115 [DOI] [PubMed] [Google Scholar]
- 10.Ashwal S, Holshouser B, Tong K, et al. Proton spectroscopy detected myoinositol in children with traumatic brain injury. Pediatr Res 2004;56:630–638 [DOI] [PubMed] [Google Scholar]
- 11.Pascual JM, Solivera J, Prieto R, et al. Time course of early metabolic changes following diffuse traumatic brain injury in rats as detected by (1)H NMR spectroscopy. J Neurotrauma 2007;24:944–959 [DOI] [PubMed] [Google Scholar]
- 12.Babikian T, Freier MC, Ashwal S, et al. MR spectroscopy: predicting long-term neuropsychological outcome following pediatric TBI. J Magn Reson Imaging 2006;24:801–811 [DOI] [PubMed] [Google Scholar]
- 13.Yeo RA, Gasparovic C, Merideth F, et al. A longitudinal proton magnetic resonance spectroscopy study of mild traumatic brain injury. J Neurotrauma 2011;28:1–11 [DOI] [PMC free article] [PubMed] [Google Scholar]
- 14.Gasparovic C, Yeo R, Mannell M, et al. Neurometabolite concentrations in gray and white matter in mild traumatic brain injury: an 1H-magnetic resonance spectroscopy study. J Neurotrauma 2009;26:1635–1643 [DOI] [PMC free article] [PubMed] [Google Scholar]
- 15.Hinzman JM, Thomas TC, Burmeister JJ, et al. Diffuse brain injury elevates tonic glutamate levels and potassium-evoked glutamate release in discrete brain regions at two days post-injury: an enzyme-based microelectrode array study. J Neurotrauma 2010;27:889–899 [DOI] [PMC free article] [PubMed] [Google Scholar]
- 16.Ashwal S, Holshouser B, Tong K, et al. Proton MR spectroscopy detected glutamate/glutamine is increased in children with traumatic brain injury. J Neurotrauma 2004;21:1539–1552 [DOI] [PubMed] [Google Scholar]
- 17.Petchprapai N, Winkelman C. Mild traumatic brain injury: determinants and subsequent quality of life: a review of the literature. J Neurosci Nurs 2007;39:260–272 [PubMed] [Google Scholar]
- 18.Kirov II, Tal A, Babb JS, et al. Diffuse axonal injury in mild traumatic brain injury: a 3D multivoxel proton MR spectroscopy study. J Neurol 2013;260:242–252 [DOI] [PMC free article] [PubMed] [Google Scholar]
- 19.Kirov II, Tal A, Babb JS, et al. Proton MR spectroscopy correlates diffuse axonal abnormalities with post-concussive syndrome symptoms in mild traumatic brain injury. J Neurotrauma 2013;30:1200–1204 [DOI] [PMC free article] [PubMed] [Google Scholar]
- 20.Hu J, Javaid T, Arias-Mendoza F, et al. A fast, reliable, automatic shimming procedure using 1H chemical-shift-imaging spectroscopy. J Magn Reson B 1995;108:213–219 [DOI] [PubMed] [Google Scholar]
- 21.Goelman G, Liu S, Hess D, et al. Optimizing the efficiency of high-field multivoxel spectroscopic imaging by multiplexing in space and time. Magn Reson Med 2006;56:34–40 [DOI] [PubMed] [Google Scholar]
- 22.Goelman G, Liu S, Fleysher R, et al. Chemical-shift artifact reduction in Hadamard-encoded MR spectroscopic imaging at high (3T and 7T) magnetic fields. Magn Reson Med 2007;58:167–173 [DOI] [PubMed] [Google Scholar]
- 23.Soher BJ, Young K, Govindaraju V, et al. Automated spectral analysis III: application to in vivo proton MR spectroscopy and spectroscopic imaging. Magn Reson Med 1998;40:822–831 [DOI] [PubMed] [Google Scholar]
- 24.Kirov II, Fleysher L, Fleysher R, et al. Age dependence of regional proton metabolites T2 relaxation times in the human brain at 3 T. Magn Reson Med 2008;60:790–795 [DOI] [PMC free article] [PubMed] [Google Scholar]
- 25.Posse S, Otazo R, Caprihan A, et al. Proton echo-planar spectroscopic imaging of J-coupled resonances in human brain at 3 and 4 tesla. Mag Reson Med 2007;58:236–244 [DOI] [PubMed] [Google Scholar]
- 26.Choi C, Coupland NJ, Bhardwaj PP, et al. T2 measurement and quantification of glutamate in human brain in vivo. Magn Reson Med 2006;56:971–977 [DOI] [PubMed] [Google Scholar]
- 27.Traber F, Block W, Lamerichs R, et al. 1H metabolite relaxation times at 3.0 tesla: measurements of T1 and T2 values in normal brain and determination of regional differences in transverse relaxation. J Magn Reson Imaging 2004;19:537–545 [DOI] [PubMed] [Google Scholar]
- 28.Du YP, Parker DL, Davis WL, et al. Reduction of partial-volume artifacts with zero-filled interpolation in three-dimensional MR angiography. J Magn Reson Imaging 1994;4:733–741 [DOI] [PubMed] [Google Scholar]
- 29.Brooks WM, Friedman S, Gasparovic C. Magnetic resonance spectroscopy in traumatic brain injury. J Head Trauma Rehabil 2001;16:149–164 [DOI] [PubMed] [Google Scholar]
- 30.Fisher SK, Novak JE, Agranoff BW. Inositol and higher inositol phosphates in neural tissues: homeostasis, metabolism and functional significance. J Neurochem 2002;82:736–754 [DOI] [PubMed] [Google Scholar]
- 31.Timofeev I, Carpenter KL, Nortje J, et al. Cerebral extracellular chemistry and outcome following traumatic brain injury: a microdialysis study of 223 patients. Brain 2011;134:484–494 [DOI] [PubMed] [Google Scholar]
- 32.Gallagher CN, Carpenter KL, Grice P. The human brain utilizes lactate via the tricarboxylic acid cycle: a 13C-labelled microdialysis and high-resolution nuclear magnetic resonance study. Brain 2009;132:2839–2849 [DOI] [PubMed] [Google Scholar]
- 33.Xu S, Zhuo J, Racz J, et al. Early microstructural and metabolic changes following controlled cortical impact injury in rat: a magnetic resonance imaging and spectroscopy study. J Neurotrauma 2011;28:2091–2102 [DOI] [PMC free article] [PubMed] [Google Scholar]
- 34.Pascual O, Ben Achour S, Rostaing P, et al. Microglia activation triggers astrocyte-mediated modulation of excitatory neurotransmission. Proc Natl Acad Sci USA 2012;109:197–205 [DOI] [PMC free article] [PubMed] [Google Scholar]
- 35.Ramlackhansingh AF, Brooks DJ, Greenwood RJ, et al. Inflammation after trauma: microglial activation and traumatic brain injury. Ann Neurol 2011;70:374–383 [DOI] [PubMed] [Google Scholar]
- 36.Grahn JA, Parkinson JA, Owen AM, et al. The role of the basal ganglia in learning and memory: neuropsychological studies. Behav Brain Res 2009;199:53–60 [DOI] [PubMed] [Google Scholar]
- 37.Ell SW, Sebastien H, Hutchinson S. Contributions of the putamen to cognitive function. In: Costa A, Villalba E, editors. Horizons in Neuroscience Research. Hauppauge, NY: Nova Science Publishers; 2012:29–52 [Google Scholar]
- 38.Fudge JL, Emiliano AB. The extended amygdala and the dopamine system: another piece of the dopamine puzzle. J Neuropsychiatry Clin Neurosci 2003;15:306–316 [DOI] [PMC free article] [PubMed] [Google Scholar]
- 39.Kirov I, Fleysher L, Babb JS, et al. Characterizing “mild” in traumatic brain injury with proton MR spectroscopy in the thalamus: initial findings. Brain Inj 2007;21:1147–1154 [DOI] [PubMed] [Google Scholar]