

Abstract
The China Health and Retirement Longitudinal Study (CHARLS) is a nationally representative longitudinal survey of persons in China 45 years of age or older and their spouses, including assessments of social, economic, and health circumstances of community-residents. CHARLS examines health and economic adjustments to rapid ageing of the population in China. The national baseline survey for the study was conducted between June 2011 and March 2012 and involved 17 708 respondents. CHARLS respondents are followed every 2 years, using a face-to-face computer-assisted personal interview (CAPI). Physical measurements are made at every 2-year follow-up, and blood sample collection is done once in every two follow-up periods. A pilot survey for CHARLS was conducted in two provinces of China in 2008, on 2685 individuals, who were resurveyed in 2012. To ensure the adoption of best practices and international comparability of results, CHARLS was harmonized with leading international research studies in the Health and Retirement Study (HRS) model. Requests for collaborations should be directed to Dr Yaohui Zhao (yhzhao@nsd.edu.cn). All data in CHARLS are maintained at the National School of Development of Peking University and will be accessible to researchers around the world at the study website. The 2008 pilot data for CHARLS are available at: http://charls.ccer.edu.cn/charls/. National baseline data for the study are expected to be released in January 2013.
Why was the cohort set up?
The importance of research on ageing is recognized worldwide, where numerous high-quality surveys modelled after the US Health and Retirement Study (HRS) are ongoing.1 Developing countries, especially in Asia, are experiencing rapid changes in demographics and health as the elderly population becomes more prominent and the nature of health problems changes from infectious to chronic diseases. Until recently, few panel surveys have focused on ageing-related issues in developing countries in Asia, especially in the case of surveys similar to the HRS in design and content.
With respect to ageing, China is arguably the most important developing country in the world. Not only does it have the world’s largest elderly population, but because of increases in longevity and especially reductions in fertility, China’s population is ageing rapidly. It is projected that the proportion of persons 60 years of age and older will increase from 10% of the population in 2000 to about 30% in 2050.2 China’s elderly support ratio (the number of prime-age adults from 25 to 64 years of age divided by the number older than 64 years) is projected to fall from nearly 13 in 2000 to 2.1 by 2050. China has also been ageing at a much lower level of national income than have European countries.1
With the introduction of economic reforms directed toward the achievement of a market economy, China faces unique problems in supporting its elderly population. Many recent changes made in social-security policies have unknown implications for the welfare of the elderly. There has also been a rapid expansion in the provision of health insurance, the most successful one being the New Cooperative Medical Scheme (NCMS), which was introduced in 2003 in the rural areas. The Ministry of Health of China claims that more than 97% of the rural population of the country participated in NCMS in 2011.3 Studying the effects of these policies will yield insights that may be relevant for other developing countries.4
CHARLS is a nationally representative longitudinal survey of the middle-aged and elderly population of China, consisting of persons 45 years of age or older, and including assessments of the social, economic, and health circumstances of community residents. It is intended to provide a high-quality public micro-database with a wide range of information serving the needs of scientific and policy research on ageing-related issues. CHARLS was harmonized with leading international research studies to ensure a cross-study comparability of results.
Who is in the cohort?
The national baseline survey for CHARLS was conducted between June 2011 and March 2012 and included 17 708 individual participants. Samples were chosen through multistage probability sampling. In the first stage, 150 county-level units were randomly chosen with a probability-proportional-to-size (PPS) sampling technique from a sampling frame containing all county-level units with the exception of Tibet. The sample was stratified by region and within region by urban districts or rural counties and per capita statistics on gross domestic product (GDP). The final sample of 150 counties fell within 28 provinces. Our sample used the lowest level of government organization, consisting of administrative villages (cun) in rural areas and neighborhoods (shequ or juweihui) in urban areas, as primary sampling units (PSUs). We selected 3 PSUs within each county-level unit, using PPS sampling.
Because no pre-existing sampling frame of residents existed, we conducted mapping and listing operations within each village-level unit to obtain the sampling frame for CHARLS. We excluded collective dwellings such as military bases, schools, dormitories, nursing homes, and domestic helpers living in the homes of employers. Migrants living in factory dormitories or employers’ homes were sampled in their homes of origin as household members living in collective dwellings away from home.
If more than one household was found within each dwelling unit, we randomly selected a household with a member 39 years of age or older. If the chosen household had more than one age-eligible member, we randomly selected one of them. If the selected person was between 39 and 45 years of age that person was designated for inclusion in a future refreshment sample and was not interviewed. If the chosen person was 45 years of age or older, we interviewed both that person and his or her spouse. All stages of the sampling were conducted by computer to avoid human manipulation.
The survey assigned 23 422 dwelling units to interviewers. After excluding empty or non-resident dwellings, 12 740 were age-eligible for CHARLS. Final CAPI interviews were conducted on 10 257 households, which completed at least one module of the survey beyond the cover screening for age eligibility. Dividing this number by the numbers of age-eligible households for the survey gives a response rate of 80.5%. Of the 19.5% rate of nonresponse, 8.8% was due to refusal to respond, 8.2% to the inability of interviewers to contact sample residents, and 2.0% to other reasons (e.g., the resident was willing to be interviewed but could not do so for health- or for interviewer-related reasons).
Of the final sample of 17 708 individual participants who provided CAPI interview data, 10 069 were main respondents randomly selected after the randomization procedures for the survey, and 7639 were spouses of main respondents. The survey included 14 910 spousal pairs (in 184 cases the main respondents did not participate in the interview but the spouses did). Among all study participants, 13 978 individuals (78.9%) provided anthropometric and physical-performance measures. With funding from Chinese sources, and after the household interviews in a county or district had been completed, respondents were invited to township hospitals or to a local office of China Center for Disease Prevention and Control (CDC), where trained nurses drew 8-ml samples of fasting blood. Tests for a complete blood count (CBC) were conducted within 1–2 hours of sample collection. A specimen of whole blood was stored during transport at 4°C for later testing of haemoglobin A1C (HbA1C), and the remainder of the blood sample was separated into plasma and red blood cells at the same time at which the CBC was done and was stored for transport at −20°C. All blood samples were shipped back to Beijing and stored at –70°C at the China CDC for analysis. Blood collection for the study is continuing in the field, with 10 916 study participants having so far donated blood. A flow diagram including response rates for each part of the study is shown in Figure 1.
Figure 1.
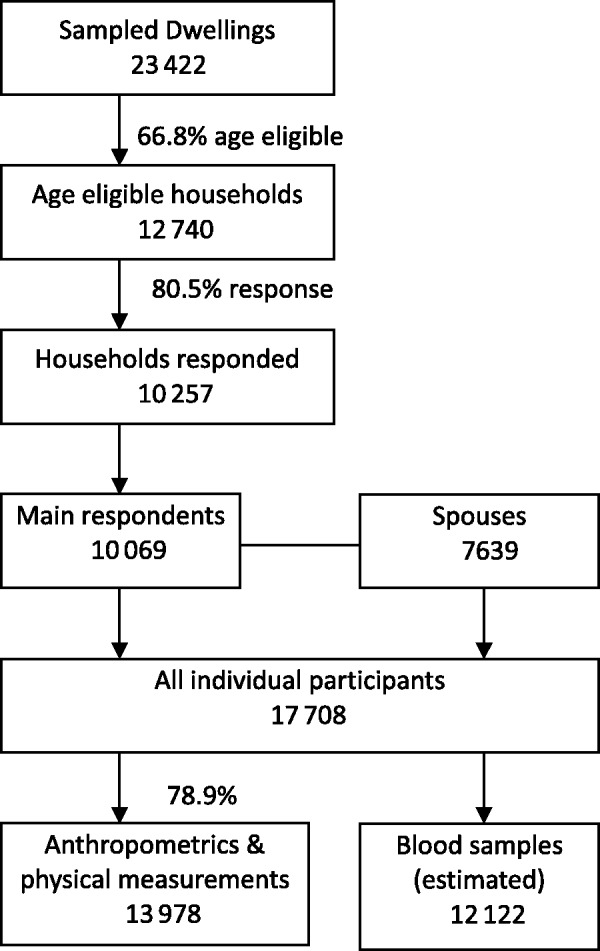
Response rate for CHARLS national baseline
In cases in which a household member was unable to answer questions because of illness or was unreachable because of migration, we allowed a proxy interview, in which a knowledgeable person answered on behalf of the originally designated respondent. We minimized such proxy responses by requiring that the survey interviewer call the study headquarters to request permission for a proxy response, and upon approval a password was given to proceed. The national baseline rate of proxy interviews was 8.02%. Of such proxy interviews, 64% were conducted because a respondent was living away from home, 25% for health-related reasons, and 11% for other reasons. In follow-up surveys the rate of proxy interviews will decline because migrants will be interviewed at their destination. In financial questions, we minimized the frequency of nonresponses to specific items by using unfolding brackets.
Table 1 compares weighted demographic data for age structure and marital status in CHARLS with corresponding data in the Chinese population census of 2010. In terms of these two variables, CHARLS is quite similar to the Chinese national population.
Table 1.
Comparison between CHARLS (Weighted) and 2010 Census
| Age Category | Age Structure |
Marital Status |
||||||||||
|---|---|---|---|---|---|---|---|---|---|---|---|---|
| Married |
Divorced |
Widowed |
Never Married |
|||||||||
| CHARLS | Census | CHARLS | Census | CHARLS | Census | CHARLS | Census | CHARLS | Census | |||
| 46–50 | 22.1 | 23.8 | 95.3 | 93.8 | 2.0 | 2.3 | 1.8 | 2.0 | 0.9 | 1.8 | ||
| 51–55 | 16.3 | 17.8 | 93.4 | 92.3 | 2.1 | 2.0 | 3.4 | 3.9 | 1.1 | 1.8 | ||
| 56–60 | 19.9 | 18.3 | 91.0 | 90.2 | 1.6 | 1.4 | 5.9 | 6.5 | 1.4 | 1.8 | ||
| 61–65 | 14.5 | 13.2 | 87.2 | 85.5 | 0.8 | 1.0 | 10.7 | 11.5 | 1.3 | 1.9 | ||
| 65+ | 27.2 | 26.8 | 67.2 | 63.2 | 0.4 | 0.7 | 31.5 | 34.5 | 0.8 | 1.7 | ||
| 66–70 | 10.1 | 9.3 | n/a | n/a | n/a | n/a | n/a | n/a | n/a | n/a | ||
| 70+ | 17.2 | 17.6 | n/a | n/a | n/a | n/a | n/a | n/a | n/a | n/a | ||
| All | 100.0 | 100.0 | 85.3 | 83.5 | 1.4 | 1.5 | 12.2 | 13.3 | 1.1 | 1.8 | ||
Before the national baseline survey for CHARLS was conducted, a pilot survey for the study was conducted in 2008 in the two provinces of Zhejiang and Gansu. In this pilot survey, which followed the same sampling procedure outlined above, 2685 individuals in 1750 households were interviewed by CAPI, yielding a response rate of 85%. A follow-up survey of this sample was conducted in the summer of 2012 with an individual response rate of 93%. The procedures for the follow-up of the pilot-survey respondents will be used to guarantee a successful follow-up of the national baseline sample for CHARLS in 2013 and beyond.
What does CHARLS cover?
CHARLS is a comprehensive study and includes:
Comparisons of self-reported and objective measures of health among middle-aged and elderly in China, and of changes in health with age.
Interactions of socio-economic factors and health-related behaviors and health outcomes in the process of ageing.
A study of the effects of childhood circumstances and community environment on health later in life.
Sex differences in conditions of mental, cognitive and physical health.
Descriptions by respondents of their current economic positions, social and family support, health insurance, and health-care utilization.
Follow-up interviews will monitor how respondents' health, economic, and social conditions change over time and how respondents adjust to these changes.
What has been measured?
We sent two interviewers to each county-level unit to interview about 72 households located in three communities. The interviewers were trained at Peking University by CHARLS staff members, and the interviews took place in respondents’ homes with the use of CAPI technology.
Core CHARLS questionnaires include sections directed at: demographics, family structure and changes, health status and functioning, general health now and before age 16, physician-diagnosed chronic illnesses, lifestyle and health-related behaviors (smoking, drinking, physical activities), subjective expectation of mortality, activities of daily living (ADL), instrumental activities of daily living (IADL), helpers, cognition testing, depression [Center for Epidemiological Studies Depression Scale (CES-D) short form], health vignettes, health care and insurance, work, retirement and pension, income and consumption, and assets (individual and household) (Table 2).
Table 2.
Summary of data collected in household questionnaire for China Health and Retirement Longitudinal Study
| Demographic information (main respondent and spouse) | Cognition depression |
| Birth date and birth place | Health vignettes |
| Residence and migration | Health care and insurance |
| Hukou information | Current and past medical insurance |
| Education | Health care utilization: outpatient and inpatient care |
| Marital status and history | Health care costs and payment methods |
| Household roster (nonrespondent household members) | Work, retirement and pension |
| Sex, birth date, marital status | Current job status |
| Relationship with the main respondent | Work history |
| Hukou informationa | Detailed information on current main job |
| Education | Unemployment and job search activities |
| Family | Most recent job (if currently not working) |
| All parents and children: | Retirement |
| demographics | Pension |
| Education | Income, expenditures and assets |
| Occupation | Household income and expenditures |
| For deceased: time of death | Household assets |
| Siblings: simple aggregate information | Individual assets |
| Interactions of each family member: | Housing characteristics |
| Time spent caring for parents | Construction materials |
| Visits from children | Home facilities |
| Two-way financial exchanges with parents and children | Cleanliness and temperature |
| Health status and functioning | Interviewer observation |
| Self-reported general health | Interference during interviews; attitude and comprehensive ability of respondent |
| Doctor diagnosed chronic and infectious disease | |
| eye, hearing, oral health, pain | |
| accidents, fall, fracture | |
| Lifestyle and life behavior including sleep, physical activity, social connectedness, diet, smoking and drinking | |
| Functional limitations and helpers |
aAs a legacy of the centralized planning era, every Chinese is assigned a registration, or hukou, status in a specific locality indicating whether he/she is an agricultural or non-agricultural resident. This identity has implications for social benefits entitlements and is widely considered to inhibit geographical mobility.
The interviewers who conducted the county-level interviews described above also carried equipment for and conducted measurements of health functioning and performance in respondents’ households. These included the anthropometric measurements of height, weight, waist circumference, lower right leg length and arm length, lung capacity, grip strength, speed of repeated chair stand, blood pressure, walking speed, and balance tests (Table 3).
Table 3.
Summary of clinical measurements collected in the China Health and Retirement Longitudinal Study
| Variables | Number of measurements | Equipment used | Manufacturer/source |
|---|---|---|---|
| Blood pressure | Three, at 45-second intervals | OmronTM HEM-7200 Monitor | Omron (Dalian) Co., LTD., Dalian, China |
| Pulse | Three, at 45-second intervals | OmronTM HEM-7200 Monitor | Omron (Dalian) Co., LTD., Dalian, China |
| Peak expiratory flow | Three, at 30-second intervals | EverpureTM Peak flow meter with a disposable mouthpiece | Shanghai Everpure Medical Plastic Co. LTD., Shanghai, China |
| Hand grip strength | Two readings for each hand | YuejianTM WL-1000 dynamometer | Nantong Yuejian Physical Measurement Instrument Co., LTD., Nantong, China |
| Balance tests | One | Tandem, semi-tandem, side-by-side diagram showing foot positions; stopwatch | |
| Timed walk | Two repetitions of 2.5 meters each, at normal speed | Tape measure, masking tape, and stop watch | |
| Upper arm length | One, left arm | DongfangTM XTCL-I Martin rule | Shijiazhuang Eastern Metal Product Co., LTD. Shijiazhuang, China |
| Lower leg length | One, left arm | DongfangTM XTCL-I Martin rule | Shijiazhuang Eastern Metal Product Co., LTD. Shijiazhuang, China |
| Repeated chair stand | Five repetitions of sitting-to-standing positions | Chair (height: 47 cm); stopwatch | |
| Height | One | SecaTM213 stadiometer | Seca Trading (Hangzhou) Co., LTD., Hangzhou, China |
| Weight | One | OmronTM HN-286 scale | Krell Precision (Yangzhou) Co. LTD., Yangzhou, China |
| Waist size | One | Soft measure tape | |
| Venous blood sample | 8 ml | Standard blood-taking materials | |
| Depression | One | Ten-item CES-D scale | |
| Cognition | One | Several measures from Telephone Interview of Cognition Status form (self-rated memory, today’s date, day of the week, and current season); recall and delayed recall test of memory of 10 words; test of serial subtractions of 7 from 100; ability to reproduce a picture of two overlapped pentagons | HRS; see McArdle, J.J., Fisher, G.G. and Kadlec, K.M. (2007)12 |
Detailed community-level information was collected in the county-level interviews. This included information on community area size, population, and demographic structure; prices of foodstuffs, fuel, and housing; distance to health-care facilities commonly used by residents; premium for and participation rate in community-based health insurance programs; natural disasters in the preceding 5 years (frequency, timing of the most recent disaster and number of injuries and deaths); and the three most severe natural disasters or epidemics since 1947 (beginning and ending year, number and percent of injured or dead, percent loss in agricultural output relative to that in a normal year).
How often will the respondents be followed?
CHARLS respondents are followed every 2 years through a face-to-face CAPI interview. Physical measurements are conducted at every follow up and blood-sample collection is done once in every two follow-up cycles. Funding has already been secured for a second wave of follow-up interviews in 2013, and is currently being sought for subsequent follow-ups.
What has been found?
Several publications have come from the CHARLS 2008 pilot data, including chapters in a recent volume published by the U.S. National Academy of Science.5 Because the 2011–2012 baseline data are nationally representative, prevalence rates are of interest (Table 4). Both overweight and underweight are problems for Chinese elderly persons, the rate of underdiagnosis of hypertension is high, and rural residents and women in the Chinese population have poorer health in almost all categories (physical and mental health and cognition)6 than do urban residents and men. Strong socioeconomic gradients were found in many dimensions of health, as also was an underdiagnosis of diseases. The baseline data reveal nearly universal coverage with health insurance, but large differences remain in the generosity of reimbursement.7
Table 4.
Health and well-being of respondents in China Health and Retirement Longitudinal Study at national baseline survey for study by age group and sex (weighted data)
| Men |
Women |
|||||
|---|---|---|---|---|---|---|
| Variable | Age 45–59 | Age 60–74 | Age 75+ | Age 45–59 | Age 60–74 | Age 75+ |
| Poor or very poor health, % | 16.5 | 25.6 | 35.5 | 21.3 | 30.9 | 35.7 |
| Diagnosed hypertension | 18.3 | 31.6 | 40.5 | 19.1 | 33.7 | 38.6 |
| Total hypertension | 29.7 | 45.7 | 58.0 | 30.1 | 49.9 | 62.1 |
| Diagnosed diabetes | 4.8 | 6.3 | 9.6 | 4.9 | 9.3 | 6.6 |
| CESD-10a Depression Scale score | 6.5 | 7.5 | 7.9 | 8.1 | 9.6 | 10.7 |
| Overweight, % of respondents | 30.2 | 28.3 | 19.1 | 42.3 | 37.0 | 24.2 |
| Underweight, % of respondents | 3.4 | 8.5 | 17.8 | 4.2 | 8.0 | 18.4 |
| Immediate and delayed memory, 10 words | 3.7 | 3.3 | 2.3 | 3.7 | 3.0 | 1.7 |
| Intact mental status, 0–10b | 9.2 | 8.8 | 7.7 | 8.4 | 7.6 | 5.98 |
| Current smoker, % | 54.9 | 45.5 | 29.8 | 3.2 | 6.6 | 6.2 |
| Ever smoker, % | 70.8 | 65.8 | 55.8 | 4.4 | 9.3 | 12.1 |
aCenter for Epidemiologic Studies 10-Item Depression Scale.
bIntact Mental Status based on Telephone Interview of Cognition Status.
The baseline data for CHARLS show that height is inversely associated with socioeconomic condition and positively associated with poor health outcomes across many categories, especially cognition.8 CHARLS reveals large sex-related differences in cognition to the disadvantage of women (Table 5), with the large sex-related gap in education being the primary reason for this.9 These sex-related disparities are eliminated in younger cohorts. There is strong transmission of childhood health status into adulthood.10
Table 5.
Sex differences in cognitive function by age
| Cohort Age (years) | Mental Intactness |
Episodic Memory |
||||||||
|---|---|---|---|---|---|---|---|---|---|---|
| n | All | Female | Male | Diff | n | All | Female | Male | Diff | |
| 45–49 | 2673 | 8.890 | 8.535 | 9.344 | −0.809** | 2698 | 3.91 | 3.856 | 3.982 | −0.125* |
| 50–54 | 1964 | 8.551 | 8.128 | 8.984 | −0.856** | 1979 | 3.527 | 3.482 | 3.573 | −0.092 |
| 55–59 | 2679 | 8.289 | 7.672 | 8.919 | −1.247** | 2684 | 3.311 | 3.171 | 3.455 | −0.284** |
| 60–64 | 2191 | 8.164 | 7.533 | 8.756 | −1.223** | 2208 | 3.196 | 3.055 | 3.332 | −0.277** |
| 65–74 | 2361 | 7.657 | 6.815 | 8.357 | −1.541** | 2360 | 2.781 | 2.602 | 2.931 | −0.329** |
| 75+ | 904 | 6.523 | 5.78 | 7.247 | −1.466** | 914 | 1.811 | 1.597 | 2.028 | −0.431** |
| Overall | 12 772 | 8.192 | 7.646 | 8.744 | −1.098** | 12 843 | 3.246 | 3.152 | 3.342 | −0.190** |
Source: CHARLS Baseline 2011-2012. Note: Difference=female-male. ** is statistically significant at one percent level; * is statistically significant at ten percent level.
Although 60% of elderly people do not live with any adult children, they are not isolated from their families.11 Most have at least one child living within the same county, resolving the conflict between independence/privacy and family support. Transfers are critical for reducing poverty rates. The poverty rate for persons 60 years of age and older, based on respondent and spouse income, is reduced by about one third after the inclusion of public and private transfers.
What are the main strengths and weaknesses of the study?
CHARLS provides nationally representative panel data that enable inferences to be made about the Chinese population 45 years of age and older. The survey instrument was developed on the basis of the best international practices and was harmonized with more than 25 HRS type surveys in the world, thereby permitting international comparisons of the findings in CHARLS with those in other studies. The CHARLS research team is familiar with Chinese institutions and adapted the instrument to capture Chinese specifics.
CHARLS instruments cover life domains essential for the well-being of middle-aged and elderly Chinese persons, including health and the provision of health care, economic resources, work, and relations between generations within a family. Health is measured in three ways, through: (i) a question-and-answer CAPI instrument, (ii) assays of venous blood, and (iii) tests of physical performance. The latter two are essential in China, where a large proportion of disease is undiagnosed. CHARLS will be conducted as a panel survey that will permit researchers to conduct analyses of changes with time in the lives and conditions of individual respondents.
A weakness in CHARLS is that its baseline survey did not include residents of nursing homes. This is unlikely to cause a major problem, however, because the fraction of nursing-home residents is very small in China. In the future, as respondents move to nursing homes, they will be tracked and remain in our sample. Another limitation is that CHARLS samples persons 45 years of age and older, so that it does not prospectively capture complete histories of their health and behavior, which may have ramifications for their health status measured today. Another current limitation is that the CHARLS blood sample has not yet been genotyped. We are actively seeking funding for this and will make the resulting genetic data available to the international research community.
To deal with nonresponse bias, we created separate weights for households, individuals, and biomarkers that correct for nonresponse and sampling-frame errors in each step of CHARLS. Additionally, during the first follow-up survey of 2013 we will send enumerators back to the households who did not respond in the national baseline survey of 2011–12 to improve the baseline response rate. The availability of electronic maps and pictures at the study facilities will make it easier to locate the physical address of nonresponding households. We will screen for original residents at the time of the CHARLS baseline survey, and will try to follow those who have left a household.
Can I obtain the CHARLS data?
All data collected in CHARLS are maintained at the National School of Development of Peking University, Beijing, China. Following the completion of data cleansing, construction of weights, and creation of a users guide and codebook for the study data, which is estimated to occur by January 2013, all of the data will be accessible to researchers around the world at the CHARLS project website (http://charls.ccer.edu.cn/charls/). The 2008 pilot survey data have been available since April 2009, and more than 2000 users, including about one third from outside of China, have downloaded data from the pilot survey. The data are described in detail at http://charls.ccer.edu.cn/charls/.
Funding
This work was supported by the Behavioral and Social Research division of the National Institute on Aging of the National Institute of Health (grants 1-R21-AG031372-01, 1-R01-AG037031-01, and 3-R01AG037031-03S1); the Natural Science Foundation of China (grants 70773002, 70910107022, and 71130002), the World Bank (contracts 7145915 and 7159234), and Peking University.
Acknowledgements
We thank the Behavioral and Social Research division of the National Institute on Aging, the Natural Science Foundation of China, the World Bank, and Peking University for financial support. We thank the CHARLS research and field team and every respondent in the study for their contributions.
Conflict of interest: None declared.
Key Messages.
Underdiagnosis of hypertension is a major problem in China. Among persons 45 years of age and older, only 66% of men and 64% of women are correctly diagnosed as having hypertension. Of those in whom hypertension is diagnosed, about 80% take some medication for the condition.
Chinese elderly persons manifest the problems of over- and undernutrition, with 33% of women and 27% of men over the age of 60 years being overweight. Among respondents to the 2011–2012 CHARLS survey, 65% of those older than 70 years of age have low blood concentrations of haemoglobin.
The overwhelming majority of Chinese 45 years of age and older have some health insurance, but less than half the cost of medical care is reimbursed, with this being more the case for inpatient than for outpatient care.
There are major sex differences in cognition that favor men and increase with age. Differences in education are the major cause of this. As disparities in education disappear among younger adults, so do cognitive differences
References
- 1.Smith JP. Preparing for population aging in Asia—strengthening the infrastructure for science and policy. In: Smith JP, Majmundar M, editors. Aging in Asia: Findings from New and Emerging Data Initiatives. Washington: National Academy of Sciences; 2012. [PubMed] [Google Scholar]
- 2.United Nations (2009) 2009. World Population Ageing 1950–2050. http://www.un.org/esa/population/publications/worldageing19502050/ (30 November 2012, date last accessed) [Google Scholar]
- 3. The Central People's Government of the People's Republic of China. Website: http://www.gov.cn/xwfb/2012-02/27/content_2077409.htm. (13 August 2012, date last accessed)
- 4.Banks J, Smith JP. International comparisons in health economics: evidence from aging studies. Annu Rev Econ. 2012;4:57–81. doi: 10.1146/annurev-economics-080511-110944. [DOI] [PMC free article] [PubMed] [Google Scholar]
- 5.Smith JP, Majmundar M, editors. Aging in Asia: Findings from New and Emerging Data Initiatives. Washington: National Academy of Sciences; 2012. [PubMed] [Google Scholar]
- 6.Strauss J, Lei X, Park A, Shen Y, Smith JP, Yang Z, et al. Health outcomes and socio-economic status among the elderly in China: evidence from the CHARLS Pilot. J Popul Ageing. 2010;3:111–42. doi: 10.1007/s12062-011-9033-9. [DOI] [PMC free article] [PubMed] [Google Scholar]
- 7.Strauss J, Hong H, Li L, Park A, Yang L, Zhao Y. Health care and insurance among the elderly in China—evidence from the CHARLS Pilot. In: Smith JP, Majmundar M, editors. Aging in Asia: findings from new and emerging data initiatives. Washington: National Academy of Sciences; 2012. [Google Scholar]
- 8.Huang W, Lei X, Ridder G, Strauss J, Zhao Y. Health, height, height shrinkage and SES at older ages: evidence from China. Am Econ J: Appl Econ. doi: 10.1257/app.5.2.86. in press. [DOI] [PMC free article] [PubMed] [Google Scholar]
- 9.Hu Y, Lei X, Smith JP, Zhao Y. Gender differences in cognition among older adults in China. J Hum Resour. 2012;47:951–71. doi: 10.3368/jhr.47.4.951. [DOI] [PMC free article] [PubMed] [Google Scholar]
- 10.Smith JP, Shen Y, Strauss J, Yang Z, Zhao Y. The effects of childhood health on adult health and SES in China. Econ Dev Cult Change. 2012;61:127–56. doi: 10.1086/666952. [DOI] [PMC free article] [PubMed] [Google Scholar]
- 11.Lei X, Giles J, Hu Y, Park A, Strauss J, Zhao Y. Patterns and correlates of intergenerational non-time transfers: evidence from CHARLS. In: Smith JP, Majmundar M, editors. Aging in Asia: findings from new and emerging data initiatives. Washington: National Academy of Sciences; 2012. [Google Scholar]
- 12.McArdle JJ, Fisher GG, Kadlec KM. Latent variable analysis of age trends in tests of cognitive ability in the Health and Retirement Survey, 1992–2004. Psychology and Aging. 2007;23:525–45. doi: 10.1037/0882-7974.22.3.525. [DOI] [PubMed] [Google Scholar]